2025 ACM Price Prediction: Expert Analysis and Market Outlook for the Coming Year


Introduction: AC Milan Fan Token Market Position and Investment Value
AC Milan Fan Token (ACM) stands as a functional token designed to provide fans of AC Milan football club with tokenized shares to participate in club decisions through the Socios platform. Since its launch in February 2021, ACM has established itself as a pioneering fan engagement asset in the sports and entertainment sector. As of December 2025, ACM maintains a market capitalization of approximately $6.43 million with a circulating supply of around 12.22 million tokens, trading at $0.5259 per token. This innovative "fan governance token" is playing an increasingly pivotal role in bridging sports institutions with blockchain-based community participation mechanisms.
This article will comprehensively analyze ACM's price trajectory through 2025-2030, integrating historical price patterns, market supply dynamics, ecosystem developments, and macroeconomic factors to provide investors with professional price forecasts and actionable investment strategies.
I. ACM Price History Review and Current Market Status
ACM Historical Price Evolution Trajectory
- February 24, 2021: Launch period, ACM reached its all-time high of $23.2, marking the peak of initial market enthusiasm.
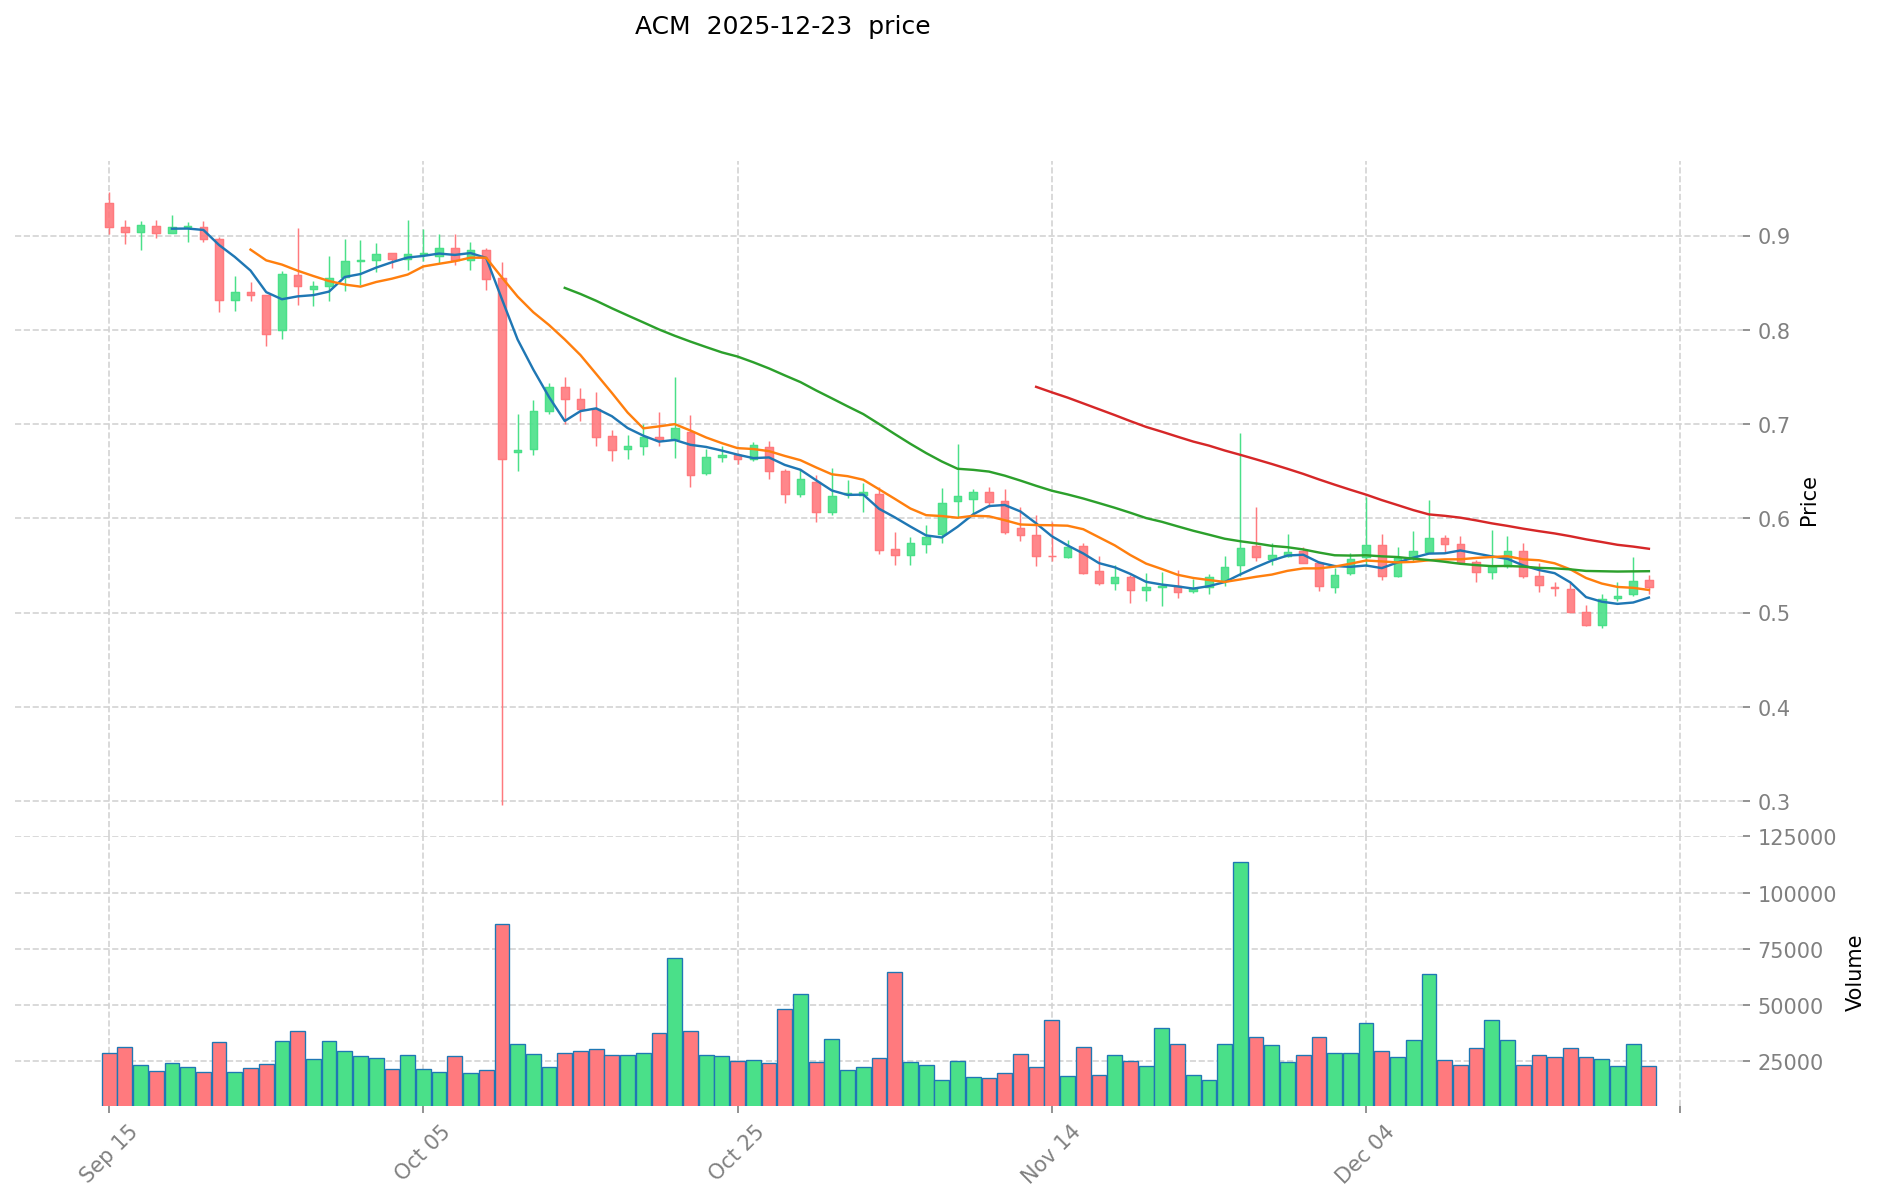
- October 11, 2025: ACM declined to its all-time low of $0.435368, reflecting prolonged market weakness over the past years.
- December 23, 2025: Price recovery to $0.5259, showing modest stabilization after reaching historical lows.
ACM Current Market Dynamics
As of December 23, 2025, ACM is trading at $0.5259, representing a significant decline of 97.73% from its historical peak of $23.2. The token's 24-hour trading volume stands at $12,022.99, with a total market capitalization of $10,475,928.
The current market sentiment reflects extreme fear, with the token experiencing minor price movements in the short term. Over the past 24 hours, ACM has declined 1.9%, while maintaining a slight positive momentum over the past hour at +0.097%. Over a 7-day period, the token has shown minimal volatility with a -0.25% change.
From a longer-term perspective, the 1-year performance has been severely challenged, with ACM losing 65.42% of its value. However, the 30-day period shows a modest recovery trend with a +0.52% increase, suggesting potential stabilization efforts.
The token's market position reflects its niche status within the sports fan engagement ecosystem, with a market cap rank of 1,399 and a dominance of 0.00032%. The circulating supply consists of 12,219,108 ACM tokens out of a maximum supply of 19,920,000, representing a circulation ratio of 61.34%.
Click to view current ACM market price
ACM Market Sentiment Indicator
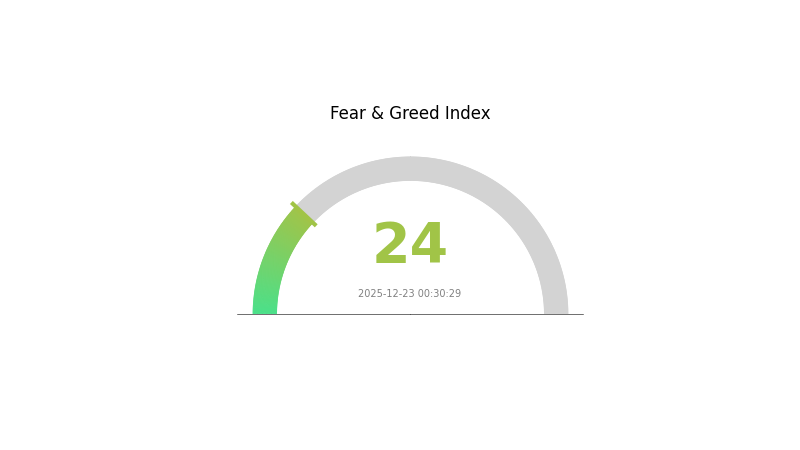
2025-12-23 Fear and Greed Index: 24 (Extreme Fear)
Click to view current Fear & Greed Index
The crypto market is experiencing extreme fear, with the Fear and Greed Index at 24. This indicates significant market anxiety and risk aversion among investors. When the index reaches such low levels, it often signals oversold conditions and potential buying opportunities for long-term investors. However, caution is advised as market volatility may persist. Monitor key support levels and consider dollar-cost averaging strategies during periods of extreme fear to manage risk effectively on Gate.com.
ACM Holding Distribution
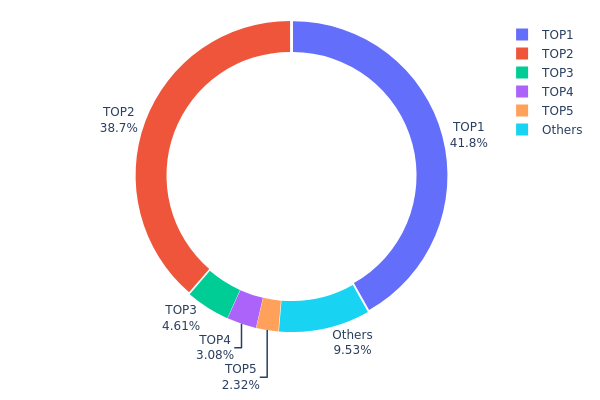
The address holding distribution represents the concentration of token ownership across the blockchain network, illustrating how ACM tokens are allocated among different wallet addresses. This metric serves as a critical indicator of market decentralization, liquidity patterns, and potential systemic risks associated with token concentration.
The current holding distribution of ACM exhibits significant concentration among top-tier addresses. The top two addresses collectively control approximately 80.46% of the total supply, with the leading address (0xF977...41aceC) commanding 41.80% and the second address (0x6F45...41a33D) holding 38.66% respectively. This pronounced concentration in the top two holders presents a notable centralization concern. The third through fifth largest holders account for an additional 10.01% combined, while the remaining addresses constitute only 9.53% of the circulating supply. Such a distribution pattern indicates that ACM's token ecosystem remains heavily dependent on a limited number of major stakeholders, which could potentially influence market dynamics and price discovery mechanisms.
The concentration profile raises important considerations regarding market structure stability and governance resilience. With over 80% of tokens held by just two addresses, the token exhibits characteristics typical of assets in relatively early distribution phases or those with significant institutional backing. While this concentration does not necessarily indicate malicious intent, it does create conditions where coordinated actions by major holders could materially impact market sentiment, liquidity availability, and price volatility. The relatively small proportion of tokens distributed among other addresses (9.53%) suggests that organic, decentralized participation remains limited at present, potentially constraining the depth of secondary market trading and long-term sustainability of truly distributed governance structures.
View the latest ACM holding distribution data
| Top | Address | Holding Qty | Holding (%) |
|---|---|---|---|
| 1 | 0xF977...41aceC | 8326.05K | 41.80% |
| 2 | 0x6F45...41a33D | 7700.89K | 38.66% |
| 3 | 0xc80A...e92416 | 919.03K | 4.61% |
| 4 | 0x8791...988062 | 613.12K | 3.08% |
| 5 | 0x76eC...78Fbd3 | 461.54K | 2.32% |
| - | Others | 1899.37K | 9.53% |
II. Core Factors Affecting ACM's Future Price
Supply Mechanism
-
Raw Material Cost Fluctuations: ACM prices are closely linked to the cost of methyl methacrylate (MMA), a key upstream raw material. Historical data shows that ACM price movements follow MMA price trends with a relatively consistent price differential of 7,500-9,000 yuan per ton maintained since 2018.
-
Historical Patterns: From 2017 to 2019, when MMA prices fluctuated between 20,000-25,000 yuan per ton, ACM prices correspondingly moved within the 22,000-25,000 yuan per ton range. In July 2019, ACM prices declined to approximately 16,500 yuan per ton as MMA prices entered a downward trend.
-
Current Impact: As a chemical product, ACM demonstrates pronounced cyclical price volatility. The market currently indicates that ACM sales prices are near the bottom of the cycle, with limited downside potential for further price declines in the near term.
Macroeconomic Environment
-
Currency Policy Impact: Changes in monetary policy will significantly influence ACM price trends. U.S. Treasury performance and yield rate fluctuations play prominent roles in global capital markets, directly affecting commodity pricing dynamics.
-
Geopolitical Factors: Financial, regulatory, and political events can trigger notable movements in ACM prices. Global market concentration with major players in Europe, North America, and East Asia means that regional geopolitical developments have material pricing implications.
Three、2025-2030 ACM Price Forecast
2025 Outlook
- Conservative Forecast: $0.3786 - $0.5275
- Neutral Forecast: $0.5259
- Bullish Forecast: $0.5575 (requiring sustained market momentum and positive ecosystem developments)
2026-2027 Medium-term Outlook
- Market Stage Expectation: Gradual accumulation phase with moderate volatility, transitioning toward growth acceleration by 2027
- Price Range Predictions:
- 2026: $0.3088 - $0.6175
- 2027: $0.3594 - $0.7998
- Key Catalysts: Enhanced protocol adoption, ecosystem expansion initiatives, and broader market cycle recovery
2028-2030 Long-term Outlook
- Base Case Scenario: $0.3725 - $0.9104 (assuming steady adoption and market maturation by 2028)
- Bullish Scenario: $0.4800 - $1.1601 (contingent on accelerated institutional adoption and network effects materialization by 2029)
- Transformative Scenario: $0.8331 - $1.0683 (under conditions of breakthrough technological advancement and mainstream integration by 2030)
Analysis Note: The forecast trajectory suggests an 86% cumulative appreciation potential from 2025 to 2030, with the most significant growth acceleration expected between 2028-2029. This multi-year projection reflects anticipated network maturation and increased market recognition. Investors are advised to monitor regulatory developments and on-chain metrics through Gate.com and other analytical platforms for real-time assessment updates.
| 年份 | 预测最高价 | 预测平均价格 | 预测最低价 | 涨跌幅 |
|---|---|---|---|---|
| 2025 | 0.55745 | 0.5259 | 0.37865 | 0 |
| 2026 | 0.61751 | 0.54168 | 0.30876 | 3 |
| 2027 | 0.79984 | 0.57959 | 0.35935 | 10 |
| 2028 | 0.91043 | 0.68972 | 0.37245 | 31 |
| 2029 | 1.1601 | 0.80007 | 0.48004 | 52 |
| 2030 | 1.0683 | 0.98009 | 0.83308 | 86 |
AC Milan Fan Token (ACM) Investment Strategy and Risk Management Report
IV. ACM Professional Investment Strategy and Risk Management
ACM Investment Methodology
(1) Long-term Holding Strategy
- Suitable investors: Sports fans and long-term believers in fan tokenization platforms, institutional investors interested in sports entertainment blockchain integration
- Operation recommendations:
- Accumulate ACM tokens during periods of market weakness, targeting positions when prices approach historical support levels
- Participate in governance voting on AC Milan club decisions to maximize utility value of held tokens
- Reinvest earned rewards from Socios platform activities to compound returns over time
(2) Active Trading Strategy
- Market analysis approach:
- Price action analysis: Monitor 24-hour and 7-day price trends to identify momentum shifts; current 24-hour change of -1.9% and 7-day change of -0.25% suggest recent market consolidation
- Volume analysis: Track the 24-hour trading volume of $12,022.99 USD against historical averages to confirm breakout signals
- Wave trading key points:
- Establish entry positions near the 24-hour low of $0.5196 and exit at resistance levels near the 24-hour high of $0.5399
- Monitor the historical high of $23.2 (reached February 24, 2021) as a long-term resistance benchmark, while respecting the recent low of $0.435368 (October 11, 2025) as critical support
ACM Risk Management Framework
(1) Asset Allocation Principles
- Conservative investors: 1-2% of total portfolio
- Active investors: 3-5% of total portfolio
- Professional investors: 5-10% of total portfolio
(2) Risk Hedging Strategies
- Diversification approach: Balance ACM holdings with positions in established Layer 2 solutions and major blockchain infrastructure tokens to reduce single-asset concentration risk
- Dollar-cost averaging: Spread ACM purchases across multiple time periods to mitigate timing risk and reduce the impact of price volatility
(3) Secure Storage Solutions
- Web3 wallet option: Gate Web3 Wallet provides integrated custody with direct trading capabilities on Gate.com
- Exchange custody: Maintain smaller trading positions on Gate.com for active trading while keeping core holdings in secure wallets
- Security considerations: Enable two-factor authentication on all accounts, never share private keys or seed phrases, verify contract addresses before transferring tokens, and be cautious of phishing attempts targeting sports fan token holders
V. ACM Potential Risks and Challenges
ACM Market Risk
- Severe historical price depreciation: The token has declined 65.42% over the past year, indicating significant loss of investor confidence and market sentiment deterioration
- Low liquidity and trading volume: With only $12,022.99 USD in 24-hour volume and limited exchange listings (12 exchanges), the token faces challenges in executing large trades without substantial slippage
- Fan token market uncertainty: The broader fan tokenization sector remains experimental, with uncertain adoption rates and unclear long-term value proposition
ACM Regulatory Risk
- Sports licensing complications: Regulatory bodies may impose stricter oversight on tokens issued by sports organizations, potentially affecting ACM's governance utility and trading status
- Jurisdiction-specific restrictions: Different countries maintain varying regulatory frameworks for sports betting and fan participation, creating compliance challenges for Socios platform operations
- Evolving financial regulations: Increased global scrutiny of cryptocurrency and tokenized assets may restrict retail participation or impose additional compliance requirements
ACM Technology Risk
- Chiliz Chain dependency: ACM's functionality relies entirely on the Chiliz Chain infrastructure; any technical failures, security breaches, or network disruptions could directly impact token utility and value
- Smart contract vulnerabilities: Governance voting mechanisms and reward distribution systems operate through smart contracts, which carry inherent risks of exploits or unintended behavior
- Integration risks: Changes to the Socios platform or modifications to AC Milan's participation terms could render token utility obsolete
VI. Conclusion and Action Recommendations
ACM Investment Value Assessment
ACM represents a speculative position within the sports entertainment blockchain sector. While the token provides legitimate governance utility through fan voting and participation in AC Milan club decisions, the severe 65.42% year-over-year decline, limited trading liquidity, and modest fully diluted market capitalization of $10.48 million USD indicate significant market skepticism regarding long-term viability. The token currently trades at $0.5259, representing a 97.7% decline from its all-time high of $23.2. Investors should carefully evaluate whether sports fan engagement mechanisms justify exposure to this level of volatility and downside risk.
ACM Investment Recommendations
✅ Beginners: Start with minimal positions (0.5-1% of portfolio) through Gate.com, focus on understanding the Socios platform and AC Milan governance structure before increasing exposure, and prioritize capital preservation over return maximization given the high-risk profile.
✅ Experienced investors: Consider tactical accumulation during extreme weakness, maintain strict position sizing discipline with stops at 15-20% loss levels, and actively participate in governance voting to maximize utility value extraction.
✅ Institutional investors: Conduct comprehensive due diligence on Socios platform adoption metrics and fan participation rates, evaluate regulatory risks across key jurisdictions, and consider ACM as a non-core satellite position only within broader sports and entertainment blockchain strategies.
ACM Trading Participation Methods
- Exchange trading on Gate.com: Create an account, complete verification, fund your wallet, and execute buy/sell orders on the spot trading platform during market hours
- Governance participation: Purchase ACM tokens and participate in binding fan votes on AC Milan decisions through the Socios application to unlock governance utility
- Reward activities: Engage in platform activities and challenges on Socios to earn additional ACM rewards, creating a potential income stream alongside price appreciation
Cryptocurrency investments carry extreme risk. This report does not constitute investment advice. Investors must make decisions based on personal risk tolerance and should consult qualified financial advisors before committing capital. Never invest more than you can afford to lose completely.
FAQ
Is ACM a buy sell or hold?
Based on current market analysis, ACM is recommended as a Strong Buy for investors with above-average risk tolerance. The project shows positive momentum and growth potential in the current market cycle.
What is the price prediction for ACM stock?
ACM stock is predicted to reach $103.77 tomorrow. For 2025, it's expected to trade between $96.74 and $104.35. Long-term 2030 forecasts range from $119.69 to $181.75.
What are the future projections for ACM?
ACM is projected to reach $126.73 by 2026, with short-term forecasts around $93.97. Long-term outlooks suggest continued growth potential, driven by increasing adoption and market demand in the cryptocurrency ecosystem.
Share
Content
Introduction: AC Milan Fan Token Market Position and Investment Value
I. ACM Price History Review and Current Market Status
II. Core Factors Affecting ACM's Future Price
Three、2025-2030 ACM Price Forecast
IV. ACM Professional Investment Strategy and Risk Management
V. ACM Potential Risks and Challenges
VI. Conclusion and Action Recommendations
FAQ
How to Buy Cryptocurrency


Trending Cryptocurrencies


Understanding Linear Token Unlock Strategies and Investor Benefits

What Does 'Stonks' Mean ?
Aergo Price Analysis: 112% Surge in 90 Days - What's Next for 2025?

Sahara AI (SAHARA) Price Analysis: Recent Volatility Trends and Market Correlations

why is crypto crashing and will it recover ?

How to convert SOL to USD: Real-time Solana price calculator

Exploring Yescoin: Features and Benefits of a Blockchain Platform

What is ALPHA: A Comprehensive Guide to Understanding the Leading Performance Metric in Investment and Portfolio Management

What is EVAA: A Comprehensive Guide to Electric Vehicle Advanced Analytics

Cardano Prepares for Significant Price Surge with High Trading Volume Analysis

What is WAI: A Comprehensive Guide to Web Accessibility Initiative and Its Impact on Digital Inclusion