2025 C Price Prediction: Analyzing Market Trends and Potential Growth Factors
Introduction: C's Market Position and Investment Value
Chainbase (C) has established itself as a foundational layer for the DataFi era since its inception. As of 2025, Chainbase's market capitalization has reached $14,651,200, with a circulating supply of approximately 160,000,000 tokens, and a price hovering around $0.09157. This asset, hailed as the "Hyperdata Network for AI," is playing an increasingly crucial role in transforming fragmented onchain signals into structured, verifiable, and AI-ready data.
This article will comprehensively analyze Chainbase's price trends from 2025 to 2030, combining historical patterns, market supply and demand, ecosystem development, and macroeconomic factors to provide investors with professional price predictions and practical investment strategies.
I. Historical Review and Current Market Status of C
C Historical Price Evolution
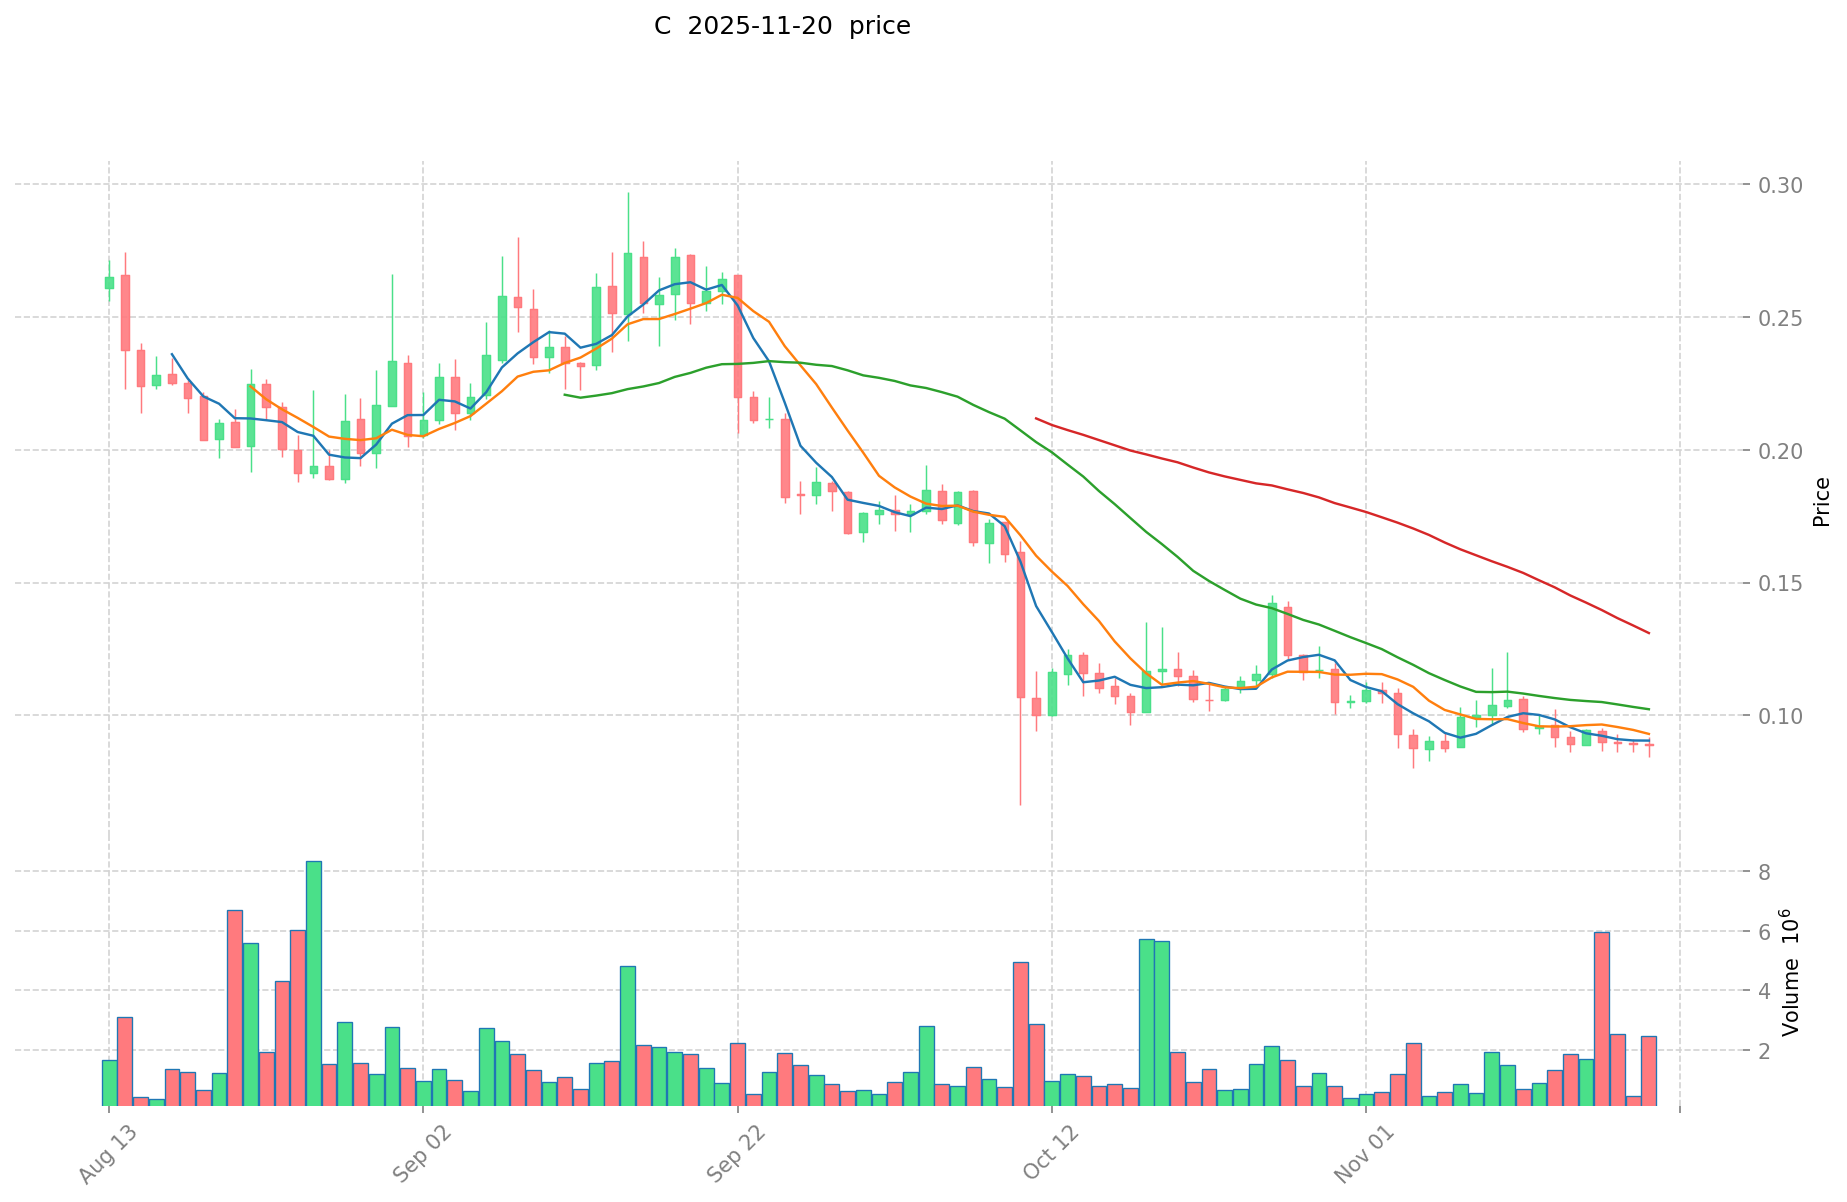
- July 2025: C reached its all-time high of $0.5396, marking a significant milestone in its price history.
- October 2025: The token experienced a sharp decline, hitting its all-time low of $0.0661, reflecting high market volatility.
- November 2025: C has shown signs of recovery, with the price stabilizing around $0.09157.
Current Market Situation of C
C is currently trading at $0.09157, showing a 3.88% increase in the last 24 hours. The token has a market capitalization of $14,651,200, ranking it at 1050 in the global cryptocurrency market. Despite the recent positive momentum, C is still down 15.75% over the past 30 days. However, it has shown impressive long-term growth, with a 67.67% increase over the past year. The current price represents a significant recovery from its all-time low but remains well below its peak, indicating potential for further growth. With a circulating supply of 160,000,000 tokens out of a total supply of 1,000,000,000, C has a relatively low circulation ratio of 16%, which could impact its liquidity and price dynamics.
Click to view the current market price of C
C Market Sentiment Indicator
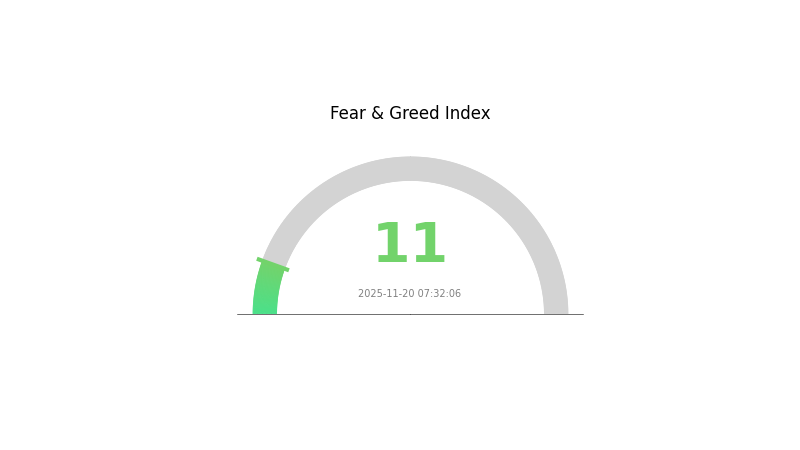
2025-11-20 Fear and Greed Index: 11 (Extreme Fear)
Click to view the current Fear & Greed Index
The crypto market is currently gripped by extreme fear, with the Fear and Greed Index plummeting to a mere 11. This level of pessimism often presents unique opportunities for savvy investors. While caution is warranted, historically, periods of extreme fear have preceded significant market rebounds. Traders on Gate.com are closely monitoring this sentiment, as it may signal a potential buying opportunity for those with a high risk tolerance and long-term perspective. Remember, market cycles are inevitable, and today's fear could be tomorrow's catalyst for growth.
C Holdings Distribution
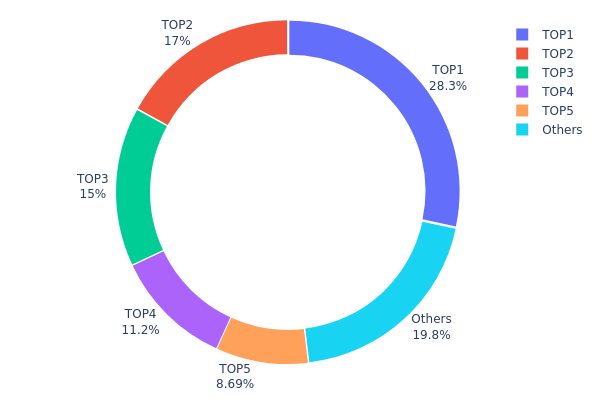
The address holdings distribution data reveals a highly concentrated ownership structure for C. The top address holds 28.34% of the total supply, with the top five addresses collectively controlling 80.23% of all tokens. This level of concentration indicates a significant centralization of power within the C network.
Such a concentrated distribution raises concerns about market stability and potential price manipulation. With a small number of addresses holding the majority of tokens, there is an increased risk of large sell-offs or coordinated actions that could dramatically impact C's market price. This concentration also suggests that the network's decision-making processes may be influenced by a select few, potentially compromising its decentralization ethos.
The current distribution reflects a market structure that is vulnerable to volatility and susceptible to the actions of major holders. While this concentration might provide some short-term stability, it poses long-term risks to the project's decentralization goals and overall ecosystem health. Investors and stakeholders should closely monitor any changes in these large holdings, as they could significantly affect C's market dynamics and governance.
Click to view the current C Holdings Distribution
| Top | Address | Holding Qty | Holding (%) |
|---|---|---|---|
| 1 | 0x81e7...fdb2b2 | 283428.57K | 28.34% |
| 2 | 0x2219...4fb170 | 170000.00K | 17.00% |
| 3 | 0xee91...a6504b | 150000.00K | 15.00% |
| 4 | 0xff5a...931888 | 112000.00K | 11.20% |
| 5 | 0x2d49...950ccd | 86939.01K | 8.69% |
| - | Others | 197632.42K | 19.77% |
II. Core Factors Affecting C's Future Price
Supply Mechanism
- Halving: The periodic reduction of block rewards, which decreases the rate of new coin creation.
- Historical Pattern: Previous halvings have been associated with significant price increases in the long term.
- Current Impact: The upcoming halving is expected to potentially drive price appreciation due to reduced supply inflation.
Institutional and Whale Dynamics
- Institutional Holdings: Major financial institutions and corporations have been increasing their C holdings as a treasury asset.
- Corporate Adoption: Several Fortune 500 companies have added C to their balance sheets or started accepting it as payment.
Macroeconomic Environment
- Monetary Policy Impact: Central banks' ongoing quantitative easing and low interest rates may continue to drive interest in alternative assets like C.
- Inflation Hedge Properties: C has shown potential as a store of value during periods of high inflation.
- Geopolitical Factors: Global economic uncertainty and geopolitical tensions have increased C's appeal as a borderless, censorship-resistant asset.
Technical Development and Ecosystem Building
- Taproot Upgrade: This upgrade enhances privacy and smart contract functionality, potentially expanding C's use cases.
- Lightning Network Growth: The continued development of the Lightning Network is improving C's scalability and transaction speed.
- Ecosystem Applications: Decentralized finance (DeFi) projects built on C's network are expanding, increasing utility and demand for the cryptocurrency.
III. C Price Prediction for 2025-2030
2025 Outlook
- Conservative prediction: $0.08293 - $0.09113
- Neutral prediction: $0.09113 - $0.11209
- Optimistic prediction: $0.11209 - $0.13305 (requires favorable market conditions)
2027-2028 Outlook
- Market stage expectation: Potential growth phase
- Price range forecast:
- 2027: $0.0646 - $0.17986
- 2028: $0.08429 - $0.20997
- Key catalysts: Increased adoption and technological advancements
2030 Long-term Outlook
- Base scenario: $0.15982 - $0.19523 (assuming steady market growth)
- Optimistic scenario: $0.19523 - $0.2909 (assuming strong market performance)
- Transformative scenario: Above $0.2909 (extremely favorable market conditions)
- 2030-12-31: C $0.2909 (potential peak price)
| 年份 | 预测最高价 | 预测平均价格 | 预测最低价 | 涨跌幅 |
|---|---|---|---|---|
| 2025 | 0.13305 | 0.09113 | 0.08293 | 0 |
| 2026 | 0.14123 | 0.11209 | 0.09191 | 22 |
| 2027 | 0.17986 | 0.12666 | 0.0646 | 38 |
| 2028 | 0.20997 | 0.15326 | 0.08429 | 67 |
| 2029 | 0.20886 | 0.18161 | 0.15982 | 98 |
| 2030 | 0.2909 | 0.19523 | 0.10543 | 113 |
IV. Professional Investment Strategies and Risk Management for C
C Investment Methodology
(1) Long-term Holding Strategy
- Suitable for: Long-term investors with high risk tolerance
- Operation suggestions:
- Accumulate C tokens during market dips
- Set price targets for partial profit-taking
- Store tokens in secure hardware wallets
(2) Active Trading Strategy
- Technical analysis tools:
- Moving Averages: Use to identify trends and potential reversals
- RSI (Relative Strength Index): Gauge overbought/oversold conditions
- Key points for swing trading:
- Monitor market sentiment and news catalysts
- Set strict stop-loss orders to manage risk
C Risk Management Framework
(1) Asset Allocation Principles
- Conservative investors: 1-3% of crypto portfolio
- Aggressive investors: 5-10% of crypto portfolio
- Professional investors: Up to 15% of crypto portfolio
(2) Risk Hedging Solutions
- Diversification: Spread investments across multiple crypto assets
- Stop-loss orders: Implement to limit potential losses
(3) Secure Storage Solutions
- Hot wallet recommendation: Gate Web3 wallet
- Cold storage solution: Hardware wallets for long-term holdings
- Security precautions: Enable two-factor authentication, use strong passwords
V. Potential Risks and Challenges for C
C Market Risks
- High volatility: Significant price fluctuations common in crypto markets
- Liquidity risk: Potential difficulty in trading large volumes
- Market sentiment: Susceptible to rapid shifts in investor sentiment
C Regulatory Risks
- Uncertain regulations: Potential for new laws affecting C's operations
- Cross-border compliance: Challenges in adhering to varying global regulations
- Tax implications: Evolving tax treatment of crypto assets
C Technical Risks
- Smart contract vulnerabilities: Potential for exploits or bugs
- Network congestion: Possible transaction delays during high activity periods
- Technological obsolescence: Risk of being outpaced by newer blockchain solutions
VI. Conclusion and Action Recommendations
C Investment Value Assessment
C shows potential as a foundational layer for the DataFi era, with strong backing and a growing ecosystem. However, it faces significant competition and regulatory uncertainties in the short term.
C Investment Recommendations
✅ Beginners: Consider small, regular investments to build a position over time ✅ Experienced investors: Implement a balanced approach with defined entry and exit points ✅ Institutional investors: Conduct thorough due diligence and consider C as part of a diversified crypto portfolio
C Trading Participation Methods
- Spot trading: Buy and sell C tokens on Gate.com
- Staking: Participate in staking programs if available to earn passive income
- DeFi integration: Explore decentralized finance opportunities using C tokens
Cryptocurrency investments carry extremely high risks, and this article does not constitute investment advice. Investors should make decisions based on their own risk tolerance and are advised to consult professional financial advisors. Never invest more than you can afford to lose.
FAQ
Is C stock a buy, sell, or hold?
Based on current market trends and analysis, C stock appears to be a buy. The company's strong fundamentals and potential for growth in the Web3 space make it an attractive investment option.
What is the price target for C in 2025?
Based on current market trends and expert predictions, the price target for C in 2025 is estimated to be around $150-$200, potentially reaching as high as $250 in optimistic scenarios.
How much will Costco stock be worth in 2030?
Based on current growth trends, Costco stock could potentially reach $800-$1000 per share by 2030, driven by continued expansion and strong consumer loyalty.
Is Celestica a good buy now?
Yes, Celestica looks promising. Its strong financials, growing market share, and innovative products make it an attractive investment option in the current market conditions.
Share
Content
Introduction: C's Market Position and Investment Value
I. Historical Review and Current Market Status of C
II. Core Factors Affecting C's Future Price
III. C Price Prediction for 2025-2030
IV. Professional Investment Strategies and Risk Management for C
V. Potential Risks and Challenges for C
VI. Conclusion and Action Recommendations
FAQ

