توقع سعر GEAR لعام 2025: دراسة اتجاهات السوق، المؤشرات الفنية وإمكانات النمو لرمز GEAR
مقدمة: موقع GEAR في السوق وقيمته الاستثمارية
يُعد Gearbox (GEAR) بروتوكول رافعة مالية شامل، وقد حقق تقدمًا ملحوظًا منذ انطلاقه. حتى عام 2025، بلغ رأس المال السوقي لـ GEAR نحو 34,000,000 دولار، مع عرض متداول يقارب 10,000,000,000 رمز، وسعر يقترب من 0.0034 دولار. وغالبًا ما يُطلق عليه "مُيسر الرافعة المالية"، حيث يلعب دورًا متزايد الأهمية في مجال التمويل اللامركزي (DeFi) وزراعة العوائد الرقمية.
يستعرض هذا المقال تحليلاً شاملاً لاتجاهات أسعار GEAR من 2025 حتى 2030، مع الأخذ في الاعتبار الأنماط التاريخية، والعرض والطلب في السوق، وتطور النظام البيئي، والعوامل الاقتصادية الكلية، لتقديم توقعات أسعار احترافية واستراتيجيات استثمار عملية للمستثمرين.
I. مراجعة تاريخ سعر GEAR والحالة السوقية الحالية
تطور سعر GEAR التاريخي
- 2021: انطلاق GEAR، وتذبذب السعر حول المستويات الأولية
- 2024: سجل أعلى قيمة تاريخية عند 0.03725561 دولار في 12 أبريل
- 2025: شهد انخفاضًا كبيرًا وبلغ أدنى مستوى تاريخي عند 0.00239484 دولار في 11 أبريل
الوضع الحالي لسوق GEAR
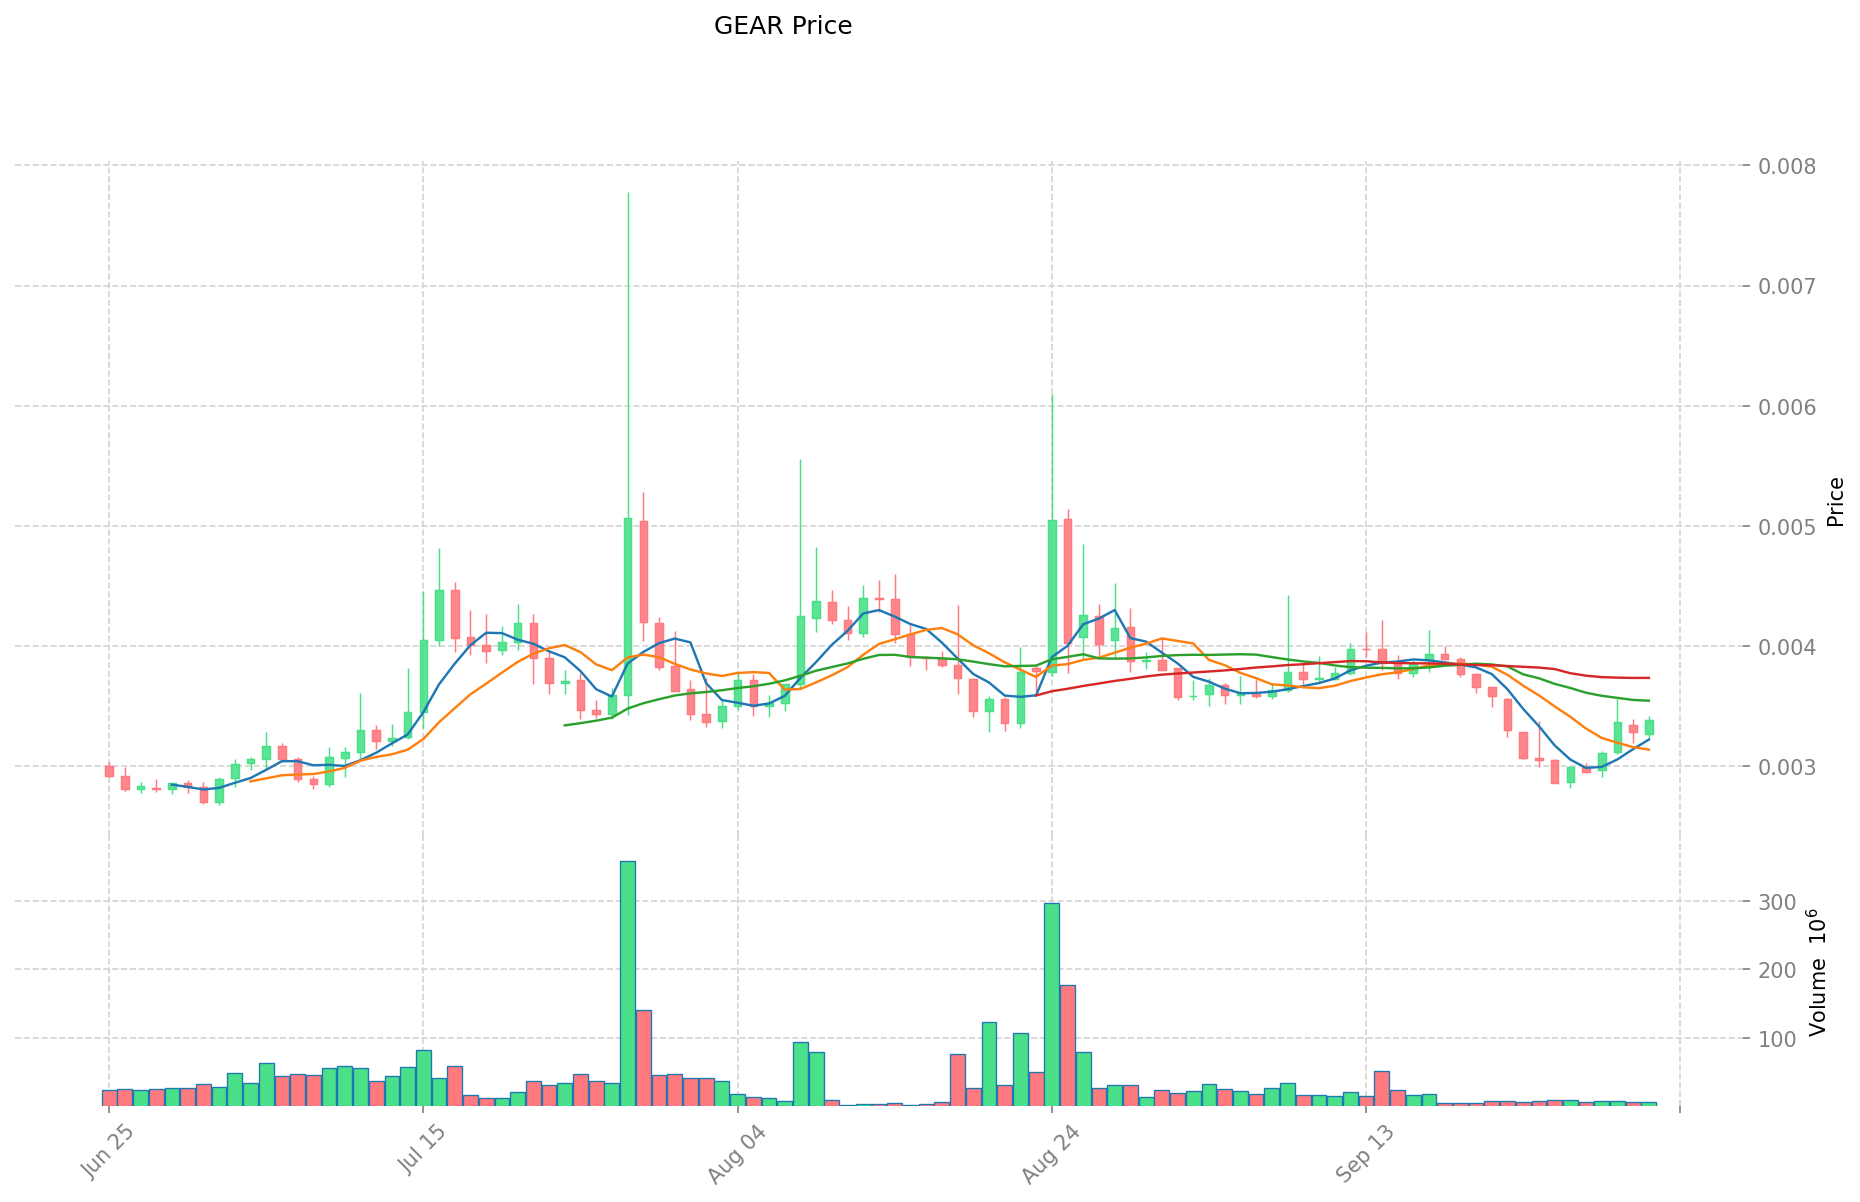
حتى 2 أكتوبر 2025، يتداول GEAR بسعر 0.0034 دولار، وحجم التداول خلال 24 ساعة بلغ 22,361.99 دولار. سجل الرمز زيادة بنسبة 4.23% في آخر 24 ساعة، ويبلغ رأس المال السوقي 34,000,000 دولار، ليحتل المرتبة 853 ضمن سوق العملات الرقمية.
يمثل السعر الحالي انخفاضًا بنسبة 90.88% عن أعلى مستوى، وزيادة بنسبة 41.97% عن أدنى مستوى تاريخي. خلال الأسبوع الماضي، حقق GEAR مكاسب قوية بنسبة 11.95%، بينما تراجع بنسبة 5.27% خلال الشهر الأخير. منذ بداية العام، تراجع أداء الرمز بنسبة 52.12%.
العرض المتداول يساوي العرض الكلي البالغ 10,000,000,000 رمز، وتبلغ القيمة السوقية المخففة بالكامل 34,000,000 دولار. وتصل هيمنة الرمز على السوق إلى 0.00079%.
يبدو أن شعور السوق تجاه GEAR متفائل بحذر، حيث تعوض المكاسب القصيرة بعض الخسائر الطويلة. إلا أن الرمز لا يزال بعيدًا عن ذروته التاريخية، مما يفتح المجال للتعافي إذا تحسنت ظروف السوق.
انقر لعرض السعر الحالي لـ GEAR
مؤشر شعور السوق لـ GEAR
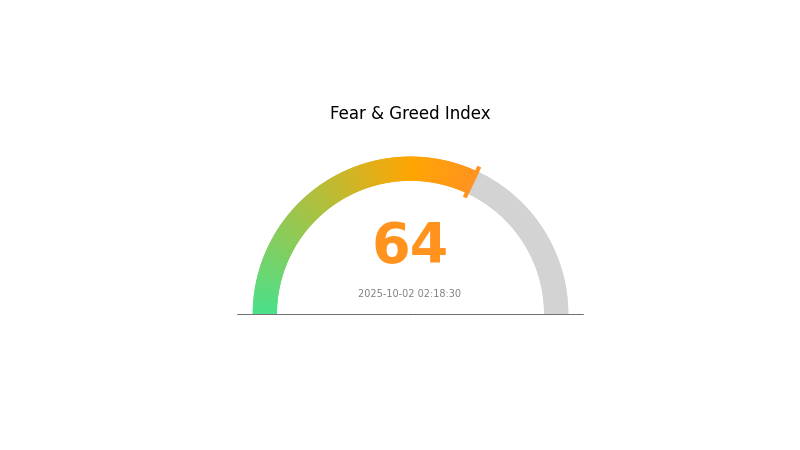
2025-10-02 مؤشر الخوف والجشع: 64 (جشع)
انقر لعرض مؤشر الخوف والجشع الحالي
تشير السوق الرقمية إلى حالة من التفاؤل المفرط، حيث سجل مؤشر الخوف والجشع 64، ما يدل على حالة جشع. هذا يعكس تفاؤل المستثمرين المتزايد، مما قد يدفع الأسعار إلى الأعلى. لكن من الضروري التحلي بالحذر، إذ أن الجشع المفرط غالبًا ما يقود إلى تصحيحات سوقية. ننصح المتداولين بتنويع محافظهم وتفعيل أوامر وقف الخسارة للحماية من التقلبات المفاجئة. وكما هو الحال دائمًا، يُعد البحث الدقيق وإدارة المخاطر محوريين للتعامل مع ديناميكيات السوق المتغيرة.
توزيع حيازات GEAR
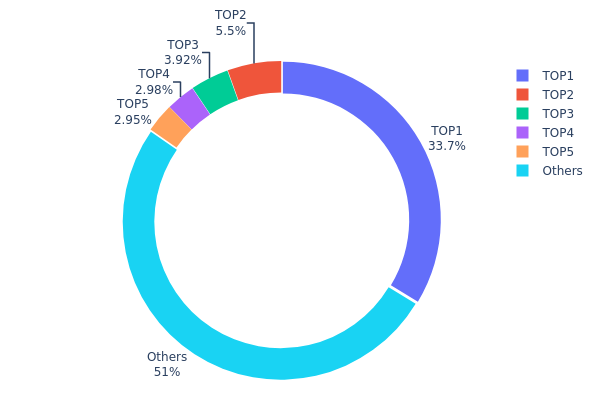
توفر بيانات توزيع الحيازات حسب العناوين نظرة معمقة على تركّز رموز GEAR بين مختلف العناوين. ويكشف التحليل عن تركّز كبير في عدد محدود من العناوين. يحتفظ العنوان الأعلى بنسبة 33.67% من إجمالي العرض، بينما تسيطر أعلى 5 عناوين على 49% من رموز GEAR.
هذا التركّز يثير مخاوف بشأن احتمالية التلاعب بالسوق وتقلب الأسعار. فامتلاك عنوان واحد لأكثر من ثلث العرض يحمل خطر ضغط بيع كبير إذا قرر هذا الحامل التصفية. كما أن سيطرة أعلى 5 عناوين على نصف العرض تعكس توزيعًا مركزيًا نسبيًا، ما قد يؤثر على بنية السوق واستقرار الأسعار.
مع ذلك، يُلاحظ أن 51% من رموز GEAR موزعة على "الآخرين"، مما يدل على بعض اللامركزية بين الحائزين الصغار. يعكس نمط التوزيع مزيجًا بين مستثمرين كبار ومؤسسات مع قاعدة أوسع من المشاركين، ما قد يدعم استقرارًا جزئيًا رغم استمرار مخاطر التركّز.
انقر لعرض توزيع حيازات GEAR الحالي
| الأعلى | العنوان | كمية الحيازة | نسبة الحيازة (%) |
|---|---|---|---|
| 1 | 0x7b06...ea73d1 | 3,367,785.22K | 33.67% |
| 2 | 0xe8d1...a17dae | 550,000.00K | 5.50% |
| 3 | 0x0e9b...95f1c2 | 392,350.80K | 3.92% |
| 4 | 0xa0b8...9e7089 | 297,749.75K | 2.97% |
| 5 | 0x91d4...c8debe | 294,637.60K | 2.94% |
| - | الآخرون | 5,097,476.63K | 51% |
II. العوامل الرئيسية المؤثرة على سعر GEAR المستقبلي
آلية العرض
- الطلب السوقي: يتحدد سعر GEAR المستقبلي أساسًا من خلال الطلب السوقي واتجاهات العملات الرقمية العامة.
- النمط التاريخي: تغييرات العرض السابقة أثرت على سعر GEAR بحسب تقبل السوق وتقدم المشروع.
- التأثير الحالي: التأثير المتوقع لتغييرات العرض الحالية يعتمد على ابتكارات المشروع وتبني السوق.
ديناميكيات المؤسسات والحيتان
- تبني المؤسسات: اعتماد GEAR من قبل مؤسسات بارزة قد يؤثر بقوة على مسار سعره.
- السياسات الحكومية: السياسات الوطنية بشأن العملات الرقمية قد تؤثر على سعر وتبني GEAR.
البيئة الاقتصادية الكلية
- خصائص التحوط ضد التضخم: أداء GEAR في البيئات التضخمية سيكون عاملًا في تقلبات سعره.
- العوامل الجيوسياسية: الأوضاع السياسية الدولية تؤثر على سعر GEAR كجزء من سوق العملات الرقمية.
التطوير التقني وبناء النظام البيئي
- تطبيقات النظام البيئي: مشاريع DApps الرئيسية والمبادرات المبنية على GEAR تؤثر في قيمته وسعره.
III. توقعات سعر GEAR للفترة 2025-2030
توقعات عام 2025
- توقع محافظ: 0.00323 - 0.00340 دولار
- توقع محايد: 0.00340 - 0.00391 دولار
- توقع متفائل: 0.00391 - 0.00442 دولار (يتطلب شعور سوق إيجابي وزيادة التبني)
توقعات 2027-2028
- توقعات المرحلة السوقية: نمو محتمل وزيادة الزخم
- نطاق السعر المتوقع:
- 2027: 0.00309 - 0.00503 دولار
- 2028: 0.00439 - 0.00618 دولار
- العوامل المحفزة: التقدم التقني، التبني الأوسع، الشراكات المحتملة
توقعات المدى الطويل 2029-2030
- السيناريو الأساسي: 0.00538 - 0.00619 دولار (مع نمو وتبني ثابت)
- السيناريو المتفائل: 0.00619 - 0.00699 دولار (مع تسارع التبني وظروف سوق مواتية)
- السيناريو التحولي: 0.00699 - 0.00750 دولار (مع ابتكارات ثورية وتبني واسع النطاق)
- 2030-12-31: GEAR بسعر 0.00693 دولار (ذروة محتملة قبل التصحيح السنوي)
| السنة | أعلى سعر متوقع | متوسط السعر المتوقع | أدنى سعر متوقع | نسبة التغير |
|---|---|---|---|---|
| 2025 | 0.00442 | 0.0034 | 0.00323 | 0 |
| 2026 | 0.00434 | 0.00391 | 0.00321 | 14 |
| 2027 | 0.00503 | 0.00412 | 0.00309 | 21 |
| 2028 | 0.00618 | 0.00458 | 0.00439 | 34 |
| 2029 | 0.00699 | 0.00538 | 0.00457 | 58 |
| 2030 | 0.00693 | 0.00619 | 0.0055 | 81 |
IV. استراتيجيات الاستثمار الاحترافية وإدارة المخاطر لـ GEAR
منهجية الاستثمار في GEAR
(1) استراتيجية الاحتفاظ طويل الأجل
- مناسبة لـ: المستثمرين ذوي الرؤية الطويلة وقبول المخاطر
- اقتراحات عملية:
- تجميع رموز GEAR خلال فترات الهبوط
- تكديس الرموز للحصول على دخل سلبي
- تخزين الرموز في محافظ أجهزة آمنة
(2) استراتيجية التداول النشط
- أدوات التحليل الفني:
- المتوسطات المتحركة: لتحديد الاتجاهات ونقاط الدخول والخروج
- مؤشر القوة النسبية (RSI): لمراقبة حالات التشبع الشرائي أو البيعي
- نقاط مهمة لتداول الأطر المتوسطة:
- وضع مستويات وقف الخسارة وجني الأرباح بشكل واضح
- متابعة تحديثات Gearbox وشعور السوق
إطار إدارة المخاطر لـ GEAR
(1) مبادئ تخصيص الأصول
- المستثمرون المحافظون: 1-3% من محفظة العملات الرقمية
- المستثمرون النشطون: 5-10%
- المستثمرون المحترفون: حتى 15%
(2) حلول التحوط من المخاطر
- تنويع الاستثمارات عبر بروتوكولات DeFi
- استخدام أوامر وقف الخسارة للحد من الخسائر
(3) حلول التخزين الآمن
- محفظة ساخنة موصى بها: Gate Web3 محفظة
- تخزين بارد: محافظ أجهزة للحيازة طويلة الأجل
- احتياطات أمنية: تفعيل المصادقة الثنائية، واستخدام كلمات مرور قوية
V. المخاطر والتحديات المحتملة لـ GEAR
مخاطر سوق GEAR
- تقلبات مرتفعة: تذبذب كبير في سعر GEAR
- المنافسة: تأثير بروتوكولات الرافعة الأخرى على حصة Gearbox السوقية
- مخاطر السيولة: انخفاض حجم التداول يؤثر على سهولة الدخول والخروج
المخاطر التنظيمية لـ GEAR
- تنظيمات DeFi: احتمال فرض قيود على بروتوكولات الرافعة المالية
- قيود عبر الحدود: وضع قانوني مختلف حسب الدولة
- الآثار الضريبية: معالجة ضريبية غير واضحة للمعاملات في بعض الدول
المخاطر التقنية لـ GEAR
- ثغرات العقود الذكية: احتمال استغلال بروتوكول Gearbox
- فشل أوراكل: تغذية أسعار غير دقيقة قد تسبب عدم استقرار النظام
- ازدحام الشبكة: رسوم الغاز المرتفعة على Ethereum تؤثر على تجربة المستخدم
VI. الخلاصة والتوصيات العملية
تقييم القيمة الاستثمارية لـ GEAR
يمثل GEAR فرصة عالية المخاطر وعالية العائد في قطاع DeFi. الإمكانات الطويلة الأجل ترتكز على بروتوكول Gearbox المبتكر، إلا أن التقلبات القصيرة وعدم الوضوح التنظيمي يظلان من أهم المخاطر.
توصيات الاستثمار في GEAR
✅ للمبتدئين: خصص نسبة صغيرة فقط من المحفظة، وركّز على التعلم ✅ للمستثمرين ذوي الخبرة: اعتمد استراتيجية متوسط التكلفة وشارك بنشاط في نظام Gearbox ✅ للمؤسسات: أجرِ دراسة جدوى دقيقة وفكر في التداول خارج السوق (OTC) للصفقات الكبيرة
طرق المشاركة في تداول GEAR
- التداول الفوري: شراء وبيع GEAR عبر Gate.com
- التكديس: المشاركة في مجمعات السيولة لـ Gearbox للحصول على دخل سلبي
- تداول الرافعة المالية: استخدام بروتوكول Gearbox للمراكز ذات الرافعة (مخاطر مرتفعة)
الاستثمار في العملات الرقمية ينطوي على مخاطر مرتفعة جدًا، وهذا المقال لا يشكل نصيحة استثمارية. على المستثمرين اتخاذ القرارات بحذر وفقًا لقدرتهم على تحمل المخاطر، وينصح بالاستعانة بمستشارين ماليين محترفين. لا تستثمر أكثر مما يمكنك تحمل خسارته.
الأسئلة الشائعة
ما هو توقع سعر سهم Gear Energy؟
من المتوقع أن يكون متوسط سعر سهم Gear Energy 0.6271 دولار في 2025، مع إمكانية بلوغ أعلى سعر 1.0165 دولار وأدنى سعر 0.2376 دولار.
كم سيبلغ سعر 1 بيتكوين في 2030؟
وفقًا للاتجاهات الحالية، قد يصل سعر 1 بيتكوين إلى مليون دولار بحلول 2030، لكن التنبؤ الدقيق يظل صعبًا بسبب تقلب السوق.
كم سيبلغ سعر Hex في 2025؟
وفقًا للتوقعات الحالية، يمكن أن يصل HEX إلى 115,594.8 دولار في السيناريو المتفائل، أو ينخفض إلى 0.004094 دولار في السيناريو المتشائم. جميع هذه التقديرات تخمينية.
هل سيصل Ethereum إلى 50,000 دولار؟
من غير المتوقع أن يبلغ Ethereum مستوى 50,000 دولار قبل عام 2030، حيث يتطلب ذلك رأس مال سوقي يتجاوز 6 تريليون دولار، وهو ما لا تدعمه التوقعات الحالية.
مشاركة
المحتوى
مقدمة: موقع GEAR في السوق وقيمته الاستثمارية
I. مراجعة تاريخ سعر GEAR والحالة السوقية الحالية
II. العوامل الرئيسية المؤثرة على سعر GEAR المستقبلي
III. توقعات سعر GEAR للفترة 2025-2030
IV. استراتيجيات الاستثمار الاحترافية وإدارة المخاطر لـ GEAR
V. المخاطر والتحديات المحتملة لـ GEAR
VI. الخلاصة والتوصيات العملية
الأسئلة الشائعة

