2025 年 RAD 價格預測:深入解析 Radicle Token 的市場趨勢與未來成長潛力
透過我們專家團隊對 2025 年 RAD 價格的精準預測,深入剖析 Radicle 的未來發展。內容包括歷史趨勢、市場動態與投資策略分析,全面滿足新手及資深投資人的需求。深入解析各項影響因素,助您掌握最佳投資時機。簡介:RAD 的市場地位與投資價值
Radicle(RAD)是專為軟體協作打造的Web3 原生網路治理通證,自 2021 年問世以來展現強勁成長動能。截至 2025 年,Radicle 市值達 32,015,203 美元,流通量約 49,829,110 枚,價格維持在 0.6425 美元上下。此資產素有「Web3 版 GitHub」之稱,在去中心化軟體開發與協作領域扮演日益關鍵角色。
本文將從歷史趨勢、市場供需、生態建設及總體經濟等多元面向,深入解析 2025-2030 年 Radicle 價格走勢,為投資人提供專業且具實用性的價格預測與投資策略。
一、RAD 價格歷史回顧與當前市場現況
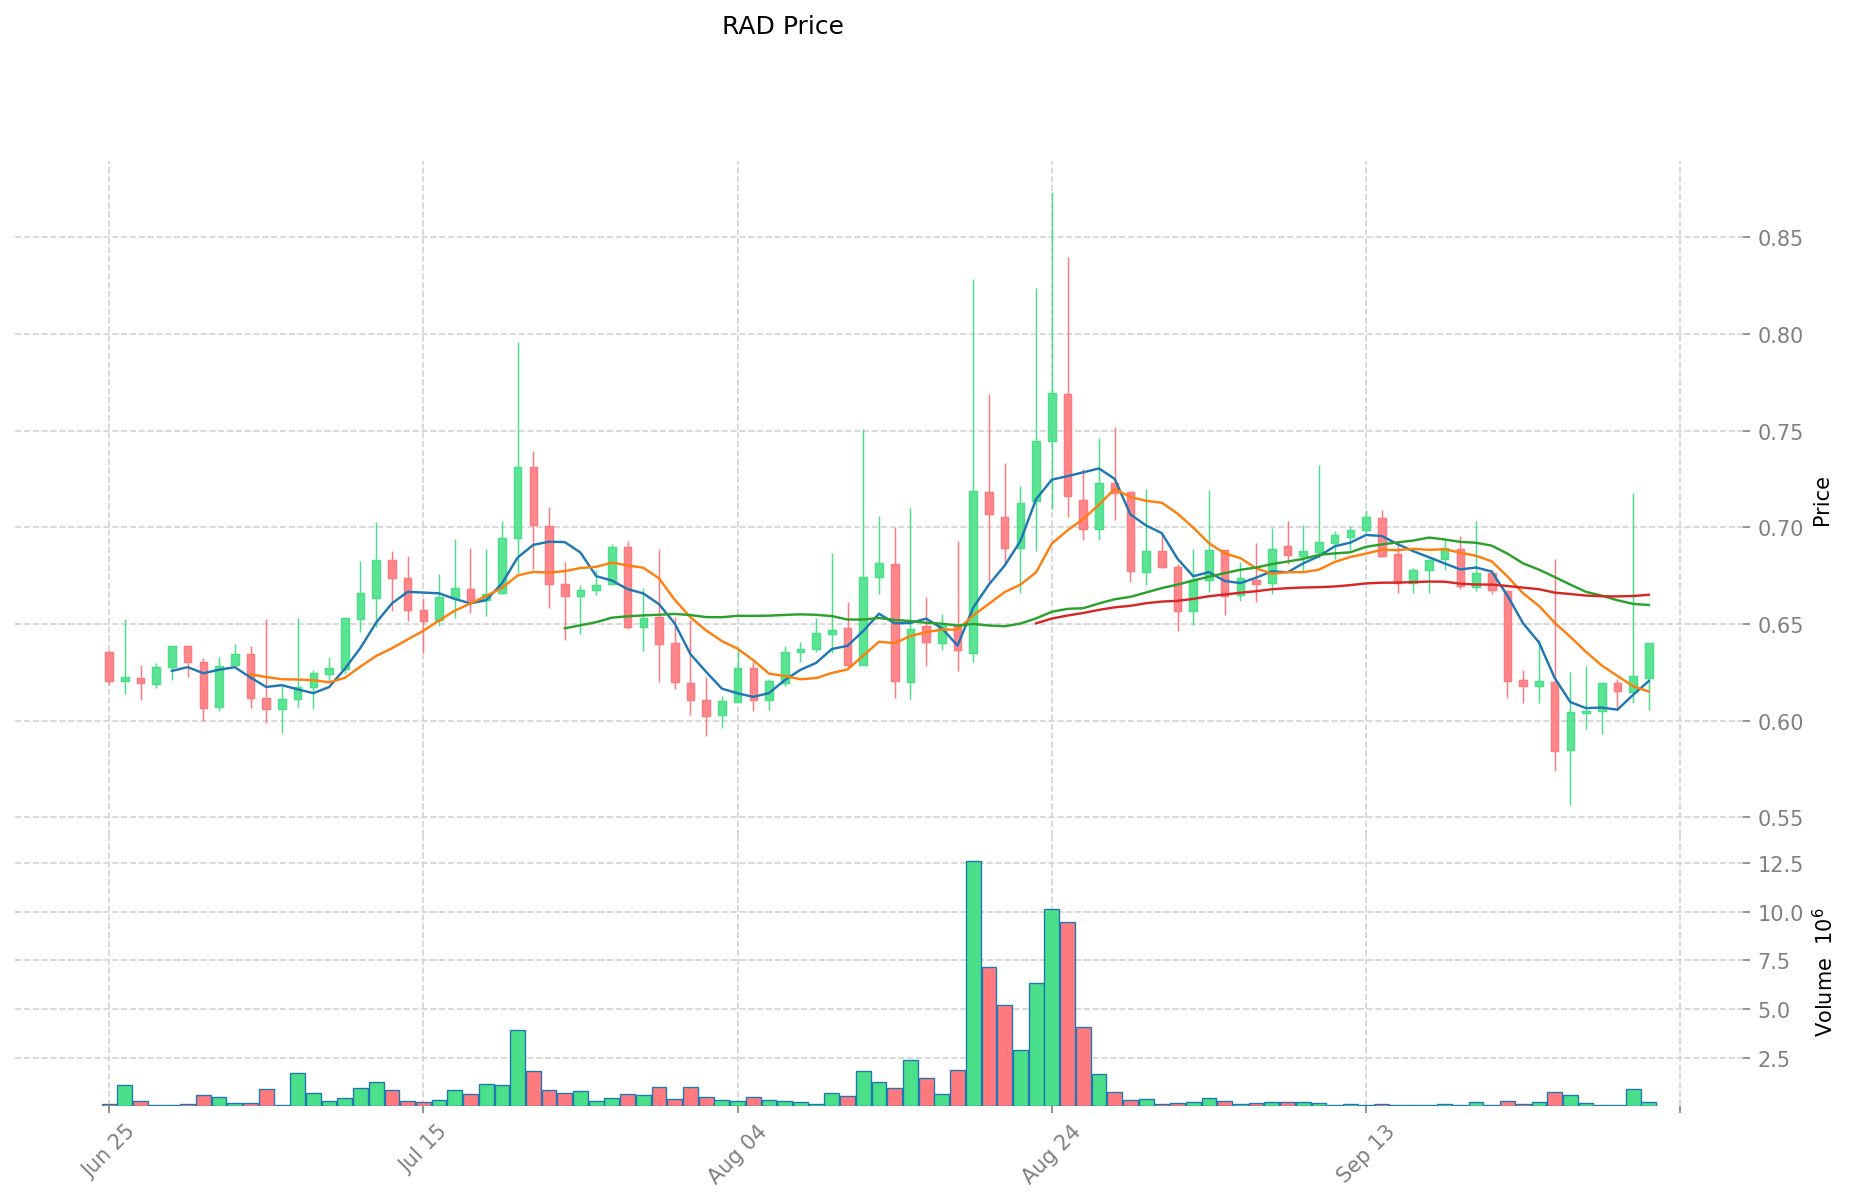
RAD 歷史價格演變軌跡
- 2021 年:首次發行,4 月 16 日價格創歷史高點 27.61 美元
- 2023 年:市場下行,價格明顯回落
- 2025 年:逐步回穩,價格於 0.56-0.64 美元區間波動
RAD 當前市場現況
截至 2025 年 10 月 2 日,RAD 價格為 0.6425 美元,24 小時成交量 124,327 美元,近 24 小時漲幅為 3.81%。市值達 32,015,203 美元,在加密貨幣市場排名第 878 位。現價較 2021 年 4 月 16 日的歷史高點 27.61 美元下跌 97.67%。流通供應量為 49,829,110 枚 RAD,佔總供應量 99,998,580 枚的 49.83%。
點擊查看最新 RAD 即時行情
RAD 市場情緒指標
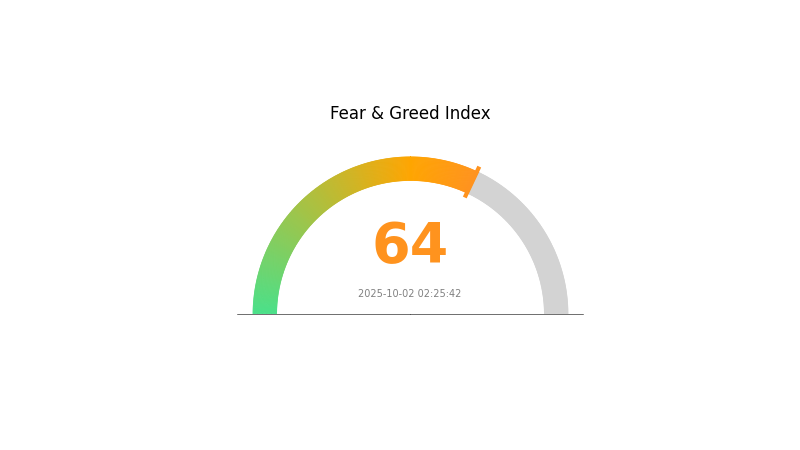
2025-10-02 恐懼與貪婪指數:64(貪婪)
點擊查看最新 恐懼與貪婪指數
目前加密市場呈現貪婪情緒,恐懼與貪婪指數達 64,顯示投資人偏向樂觀,資產可能高估。雖然多頭氛圍有利於行情上行,仍建議投資人保持警覺,分散資產並設置停損,鎖定獲利。市場情緒變化快速,必須密切關注資訊動向,及時調整投資策略。Gate.com 提供多元工具,協助投資人因應市場波動。
RAD 持倉分布
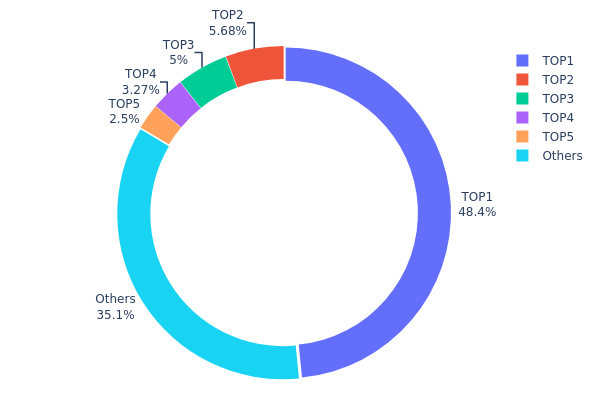
RAD 持幣分布顯示持倉高度集中。最大地址持有總供應量 48.42%,即 48,422.60K 枚 RAD,集中度極高,易造成市場操控與價格劇烈波動。
除最大地址外,第 2-5 名地址合計持有 16.44%。第二、第三大地址分別占 5.67% 和 5.00%,第四、第五大地址分別為 3.27% 和 2.50%。剩餘 35.14% 分散於其他地址。此「頭重腳輕」結構降低去中心化程度,可能影響代幣流動性與治理。
持倉高度集中易引發價格劇烈波動,若大戶集中拋售,市場風險急升;同時,去中心化進展及少數地址對生態影響力亦值得關注。
點擊查看最新 RAD 持倉分布
| 排名 | 地址 | 持有數量 | 持有比例 |
|---|---|---|---|
| 1 | 0x8da8...6130ba | 48422.60K | 48.42% |
| 2 | 0xf977...41acec | 5678.43K | 5.67% |
| 3 | 0x5a52...70efcb | 5000.00K | 5.00% |
| 4 | 0x2887...cd1992 | 3274.37K | 3.27% |
| 5 | 0xdacf...eb32e7 | 2500.00K | 2.50% |
| - | 其他 | 35123.19K | 35.14% |
二、影響 RAD 未來價格的核心因素
供應機制
- 流通供給:流通量直接影響價格波動。RAD 流通增加,價格承壓;流通減少有助推升價格。
總體經濟環境
-
貨幣政策影響:美元指數與匯率是影響 RAD 未來價格的關鍵變數。
-
抗通膨屬性:在通膨環境下,RAD 的抗通膨能力可能成為價格支撐要素。
技術發展與生態建構
-
區塊鏈技術趨勢:區塊鏈技術升級將為 RAD 未來成長與價格表現奠定基礎。
-
生態應用:RAD 網路上的 DApp 及生態項目發展速度將顯著影響其價值定位與價格表現。
三、2025-2030 年 RAD 價格預測
2025 年展望
- 保守預測:0.56-0.64 美元
- 中性預測:0.64-0.74 美元
- 樂觀預測:0.74-0.84 美元(須市場環境配合)
2027-2028 年展望
- 市場週期:有機會進入成長期
- 價格區間預測:
- 2027 年:0.71-0.96 美元
- 2028 年:0.54-1.28 美元
- 主要推動力:技術進步與應用落地
2029-2030 年長期展望
- 基本情境:1.09-1.27 美元(假設市場穩健成長)
- 樂觀情境:1.27-1.77 美元(假設市場表現優異)
- 突破情境:1.77 美元以上(若應用大規模落地、極度繁榮)
- 2030-12-31:RAD 1.77 美元(潛在高點)
| 年份 | 預測最高價 | 預測平均價格 | 預測最低價 | 漲跌幅 |
|---|---|---|---|---|
| 2025 | 0.83932 | 0.6407 | 0.56382 | 0 |
| 2026 | 0.96201 | 0.74001 | 0.56241 | 15 |
| 2027 | 0.96164 | 0.85101 | 0.71485 | 32 |
| 2028 | 1.27792 | 0.90633 | 0.5438 | 41 |
| 2029 | 1.4416 | 1.09212 | 0.63343 | 69 |
| 2030 | 1.77361 | 1.26686 | 1.01349 | 97 |
四、RAD 專業投資策略與風險管理
RAD 投資方法論
(1) 長期持有策略
- 適合對象:具備風險承受力且看好長期成長者
- 操作建議:
- 市場回檔時分批布局 RAD
- 設置價格提醒,及時反應市場波動
- 將代幣安全存放於硬體錢包
(2) 主動交易策略
- 技術分析工具:
- 均線指標:輔助判斷趨勢與反轉點
- RSI:衡量超買超賣程度
- 波段交易要點:
- 結合成交量變化確認走勢
- 設置停損,有效控制下跌風險
RAD 風險管理架構
(1) 資產配置原則
- 保守型:加密投資組合 1%-3%
- 積極型:加密投資組合 5%-10%
- 專業型:最高可達 15%
(2) 風險對沖方案
- 資產分散:多幣種投資分散風險
- 停損策略:利用停損單限制虧損
(3) 安全存放方案
- 熱錢包推薦:Gate Web3 錢包
- 冷存放:硬體錢包適合長期持有
- 安全措施:啟用雙重認證並設置強密碼
五、RAD 可能面臨的風險與挑戰
RAD 市場風險
- 高波動性:價格劇烈波動
- 流動性有限:大額交易可能成交困難
- 與加密市場連動:受大盤影響明顯
RAD 合規風險
- 監管不確定性:新規可能影響代幣治理
- 跨境合規挑戰:需因應多國法規
- 稅務複雜度:稅法變動可能影響持有人利益
RAD 技術風險
- 智能合約漏洞:存有被攻擊風險
- 網路擁塞:基於 Ethereum 的交易可能延遲、手續費高
- 技術迭代風險:有遭新技術取代的可能
六、結論與行動建議
RAD 投資價值評估
作為去中心化軟體開發領域的治理通證,RAD 具備長期潛力,但短期波動與監管不確定性風險需特別留意。
RAD 投資建議
✅ 新手:建議小額、定期分批布局 ✅ 有經驗者:採用定期定額策略,加強風險控管 ✅ 機構投資人:深入盡職調查,將 RAD 納入多元加密投資組合
RAD 交易參與方式
- 現貨交易:可於 Gate.com 直接交易 RAD/USDT
- 限價委託:依預設價格買賣
- 定期定額(DCA):定時定額買入,平滑波動
加密貨幣投資風險極高,本文不構成投資建議。投資人應以自身風險承受能力審慎決策,並建議諮詢專業財務顧問。請勿投資超過個人承受能力的資金。
常見問題
RAD 2025 年價格預測是多少?
依現行市場趨勢,預估 Radicle(RAD)2025 年價格區間為 0.87-3.78 美元,反映 Web3 生態潛在成長空間。
RAD 2030 年價格預測是多少?
根據歷史數據分析,預測 2030 年 Radicle(RAD)價格將達 53.37 美元,較現價上漲 86.02 倍。
NVIDIA 2025 年股價預測是多少?
依現有預測,NVIDIA 股價預計 2025 年 10 月 30 日達 200.52 美元,較現價上漲 7.47%。
XRP 2025 年價格預測是多少?
根據市場分析,預估 XRP 到 2025 年底價格落在 1.50-2.00 美元區間,具備強勁成長動能。
分享
目錄

