UNCX vs KAVA: Comprehensive Comparison of Two Leading DeFi Protocols and Their Investment Potential

Introduction: UNCX vs KAVA Investment Comparison
In the cryptocurrency market, the comparison between UNCX and KAVA has always been a topic that investors cannot ignore. The two assets not only show significant differences in market capitalization ranking, application scenarios, and price performance, but also represent different positioning in the crypto asset landscape.
UniCrypt (UNCX): Launched in 2020, it has gained market recognition by providing a Uniswap-centric DAPP platform offering plug-and-play solutions for token services, characterized by security, speed, and convenience.
Kava (KAVA): Since 2019, it has established itself as a cross-chain decentralized finance platform supporting mainstream digital assets (BTC, XRP, BNB, ATOM, etc.) with collateralized lending and stablecoin services, backed by over 100 companies globally including prominent blockchain projects such as Ripple and Cosmos.
This article will conduct a comprehensive analysis of UNCX vs KAVA investment value comparison from the perspectives of historical price trends, supply mechanisms, adoption scale, and ecosystem development, addressing the key question investors are most concerned with:
"Which is the better buy right now?"
Comparative Analysis Report: UniCrypt (UNCX) and Kava (KAVA)
I. Price History Comparison and Current Market Status
Historical Price Trends of UNCX and KAVA
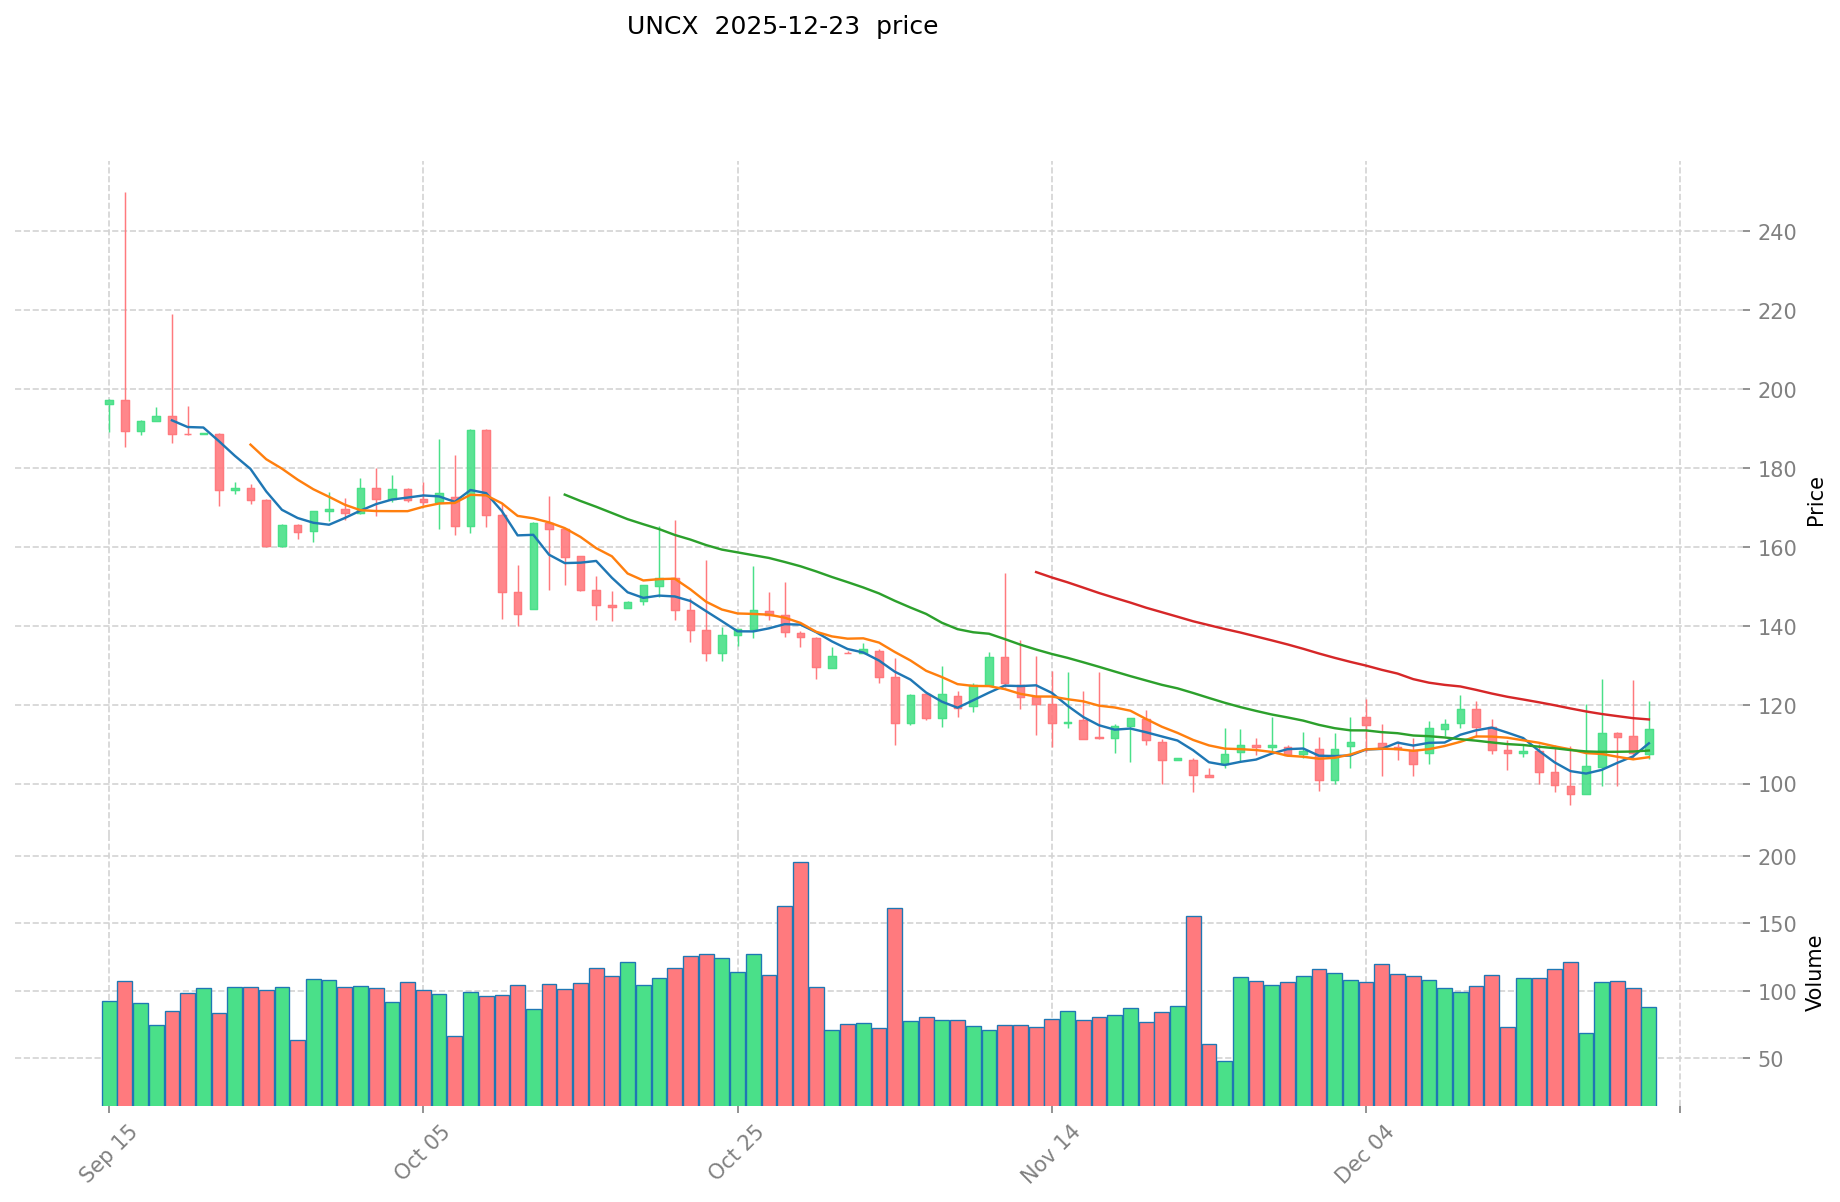
UniCrypt (UNCX):
- All-time high (ATH): $1,112.13 on December 7, 2021
- All-time low (ATL): $24.15 on December 11, 2020
- Current price: $111.78 (as of December 24, 2025)
- Decline from ATH: approximately 90% from peak value
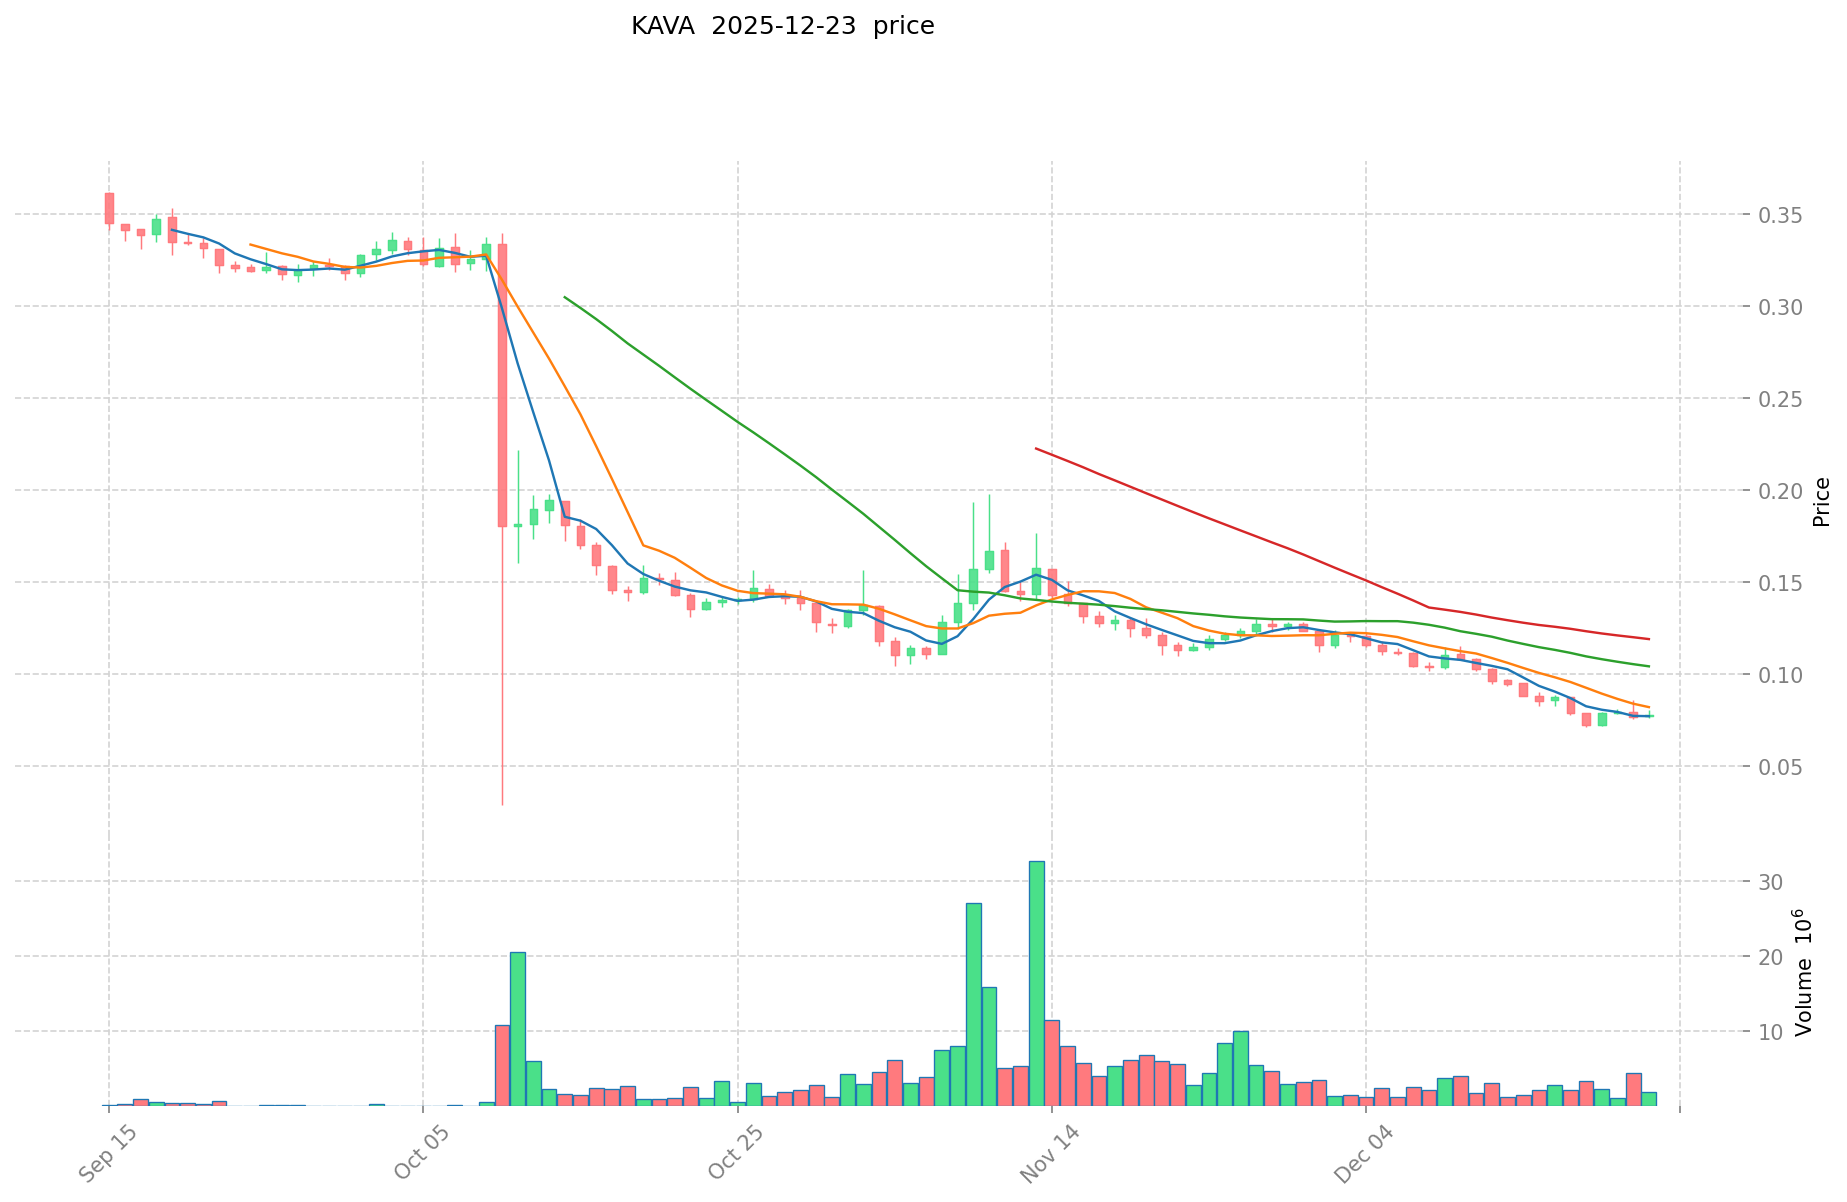
Kava (KAVA):
- All-time high (ATH): $9.12 on August 30, 2021
- All-time low (ATL): $0.071579 on December 19, 2025
- Current price: $0.07531 (as of December 24, 2025)
- Decline from ATH: approximately 99.17% from peak value
Comparative Analysis
Both tokens have experienced significant downtrends since their 2021 peaks. UNCX maintains higher absolute price levels despite substantial depreciation, while KAVA has declined to near its all-time low. The market cycle from 2021 to present demonstrates the broader cryptocurrency market contraction, with both assets reflecting heightened bearish sentiment during this extended bear market phase.
Current Market Status (December 24, 2025)
Price Data:
- UNCX current price: $111.78 USD
- KAVA current price: $0.07531 USD
- 24-hour price change: UNCX -1.93%; KAVA -3.33%
Trading Volume (24-hour):
- UNCX: $12,393.89 USD
- KAVA: $112,450.14 USD
Market Capitalization:
- UNCX market cap: $5,326,317 USD (Ranked #1665)
- KAVA market cap: $81,549,257.50 USD (Ranked #379)
Market Sentiment:
Crypto Fear & Greed Index: 24 (Extreme Fear)
The index reading of 24 indicates extreme fear in the cryptocurrency market, suggesting pronounced investor anxiety and risk-averse positioning.
II. Project Overview and Ecosystem Context
UniCrypt (UNCX)
Project Description: UniCrypt is a Uniswap-centric decentralized application (DApp) platform providing plug-and-play solutions for other tokens. The platform emphasizes security, speed, and convenience.
Token Economics:
- Total supply: 50,000 UNCX
- Circulating supply: 36,163 UNCX (72.33% circulating ratio)
- Maximum supply: 50,000 UNCX
- Contract address (Ethereum): 0xaDB2437e6F65682B85F814fBc12FeC0508A7B1D0
- Token holders: 1,671
Token History: UNCX represents an upgrade from the legacy UNC token. The token serves as the core governance and management token for the platform, with a buyback mechanism designed to reduce supply over time.
Kava (KAVA)
Project Description: Kava is a cross-chain decentralized finance (DeFi) platform providing mortgage and stablecoin services for mainstream digital assets (BTC, XRP, BNB, ATOM, etc.). The platform operates as a Layer 1 hub supporting cross-chain DeFi applications and services.
Ecosystem Components:
- Kava CDP lending platform
- HARD Protocol (cross-chain money market)
- Combined decentralized banking infrastructure for digital assets
Token Economics:
- Total supply: 1,082,847,663 KAVA
- Circulating supply: 1,082,847,663 KAVA (100% circulating ratio)
- Maximum supply: Unlimited (∞)
- Token holders: 2,649,885
Institutional Support: Kava is supported by more than 100 companies globally, including prominent digital asset funds and blockchain projects such as Ripple and Cosmos.
III. Price Performance Analysis
Performance Metrics (Multi-Timeframe)
UNCX Performance:
| Timeframe | Change | Amount |
|---|---|---|
| 1 hour | -0.21% | -$0.24 |
| 24 hours | -1.93% | -$2.20 |
| 7 days | +12.17% | +$12.13 |
| 30 days | +9.56% | +$9.75 |
| 1 year | -61.85% | -$181.22 |
KAVA Performance:
| Timeframe | Change | Amount |
|---|---|---|
| 1 hour | -0.13% | -$0.0001 |
| 24 hours | -3.33% | -$0.0026 |
| 7 days | -14.01% | -$0.0123 |
| 30 days | -34.94% | -$0.0404 |
| 1 year | -82.24% | -$0.3487 |
Key Observations
- Short-term momentum: UNCX shows stronger 7-day and 30-day gains (+12.17% and +9.56% respectively), while KAVA remains under sustained downward pressure across all timeframes.
- Annual performance: Both tokens exhibit severe year-over-year declines, with KAVA showing steeper annual depreciation (-82.24%) compared to UNCX (-61.85%).
- Intraday volatility: Both tokens declined within the past 24 hours, suggesting continued market weakness.
IV. Market Metrics and Valuation
Liquidity and Volume Analysis
UNCX:
- 24-hour volume: $12,393.89 USD
- Volume-to-market cap ratio: relatively low
- Circulating supply: 36,163 tokens
- Market dominance: 0.00016%
KAVA:
- 24-hour volume: $112,450.14 USD (approximately 9x higher than UNCX)
- Volume-to-market cap ratio: more liquid
- Circulating supply: 1,082,847,663 tokens
- Market dominance: 0.0025%
- Trading pairs: 29 exchanges
Valuation Metrics
UNCX:
- Market cap: $4,042,300.14 USD
- Fully diluted valuation (FDV): $5,326,317 USD
- Market cap/FDV ratio: 75.89%
KAVA:
- Market cap: $81,549,257.50 USD
- Fully diluted valuation (FDV): $81,549,257.50 USD
- Market cap/FDV ratio: 100% (circulating supply equals total supply)
V. Comparative Summary and Distinctions
Market Position
| Metric | UNCX | KAVA |
|---|---|---|
| Ranking | #1665 | #379 |
| Market Cap | $5.3M | $81.5M |
| 24h Volume | $12.4K | $112.5K |
| Liquidity | Low | Moderate-High |
| Ecosystem Support | Limited data | 100+ institutional partners |
| Price Discovery | Concentrated exchanges | Diversified across 29+ exchanges |
Technological Differentiation
- UNCX: Uniswap-centric DApp platform with specialized token services
- KAVA: Multi-asset cross-chain DeFi infrastructure with lending and stablecoin mechanisms
Risk Considerations
Both tokens exhibit elevated volatility and sustained bearish momentum. The crypto Fear & Greed Index reading of 24 (Extreme Fear) reflects pervasive market pessimism affecting risk asset valuations broadly.
VI. Resource Links
Official Channels:
UniCrypt (UNCX):
- Website: https://uncx.network/
- Application: https://app.uncx.network/
- Smart contract: https://etherscan.io/token/0xaDB2437e6F65682B85F814fBc12FeC0508A7B1D0
- Twitter: https://twitter.com/UNCX_token
Kava (KAVA):
- Website: https://www.kava.io/
- Block explorers: https://kava.mintscan.io/ | https://explorer.kava.io/
- GitHub: https://github.com/Kava-Labs/kava
- Twitter: https://twitter.com/KAVA_CHAIN
- Reddit: https://www.reddit.com/r/kava_platform/
Report Generated: December 24, 2025 Data Source: Market data current as of December 24, 2025, 07:13:57 UTC
加密资产对比研究报告:UNCX vs KAVA 投资价值分析
I. Executive Summary
This report analyzes the investment value determinants of UNCX and KAVA, two distinct projects within the cryptocurrency ecosystem. Based on available information, the analysis focuses on the core factors that differentiate their long-term value proposition: technology innovation, market demand, and community support.
II. Core Factors Influencing UNCX vs KAVA Investment Value
Technology Development and Ecosystem Construction
KAVA Platform Architecture:
- KAVA operates as a cross-chain finance platform, positioning itself to bridge multiple blockchain networks and facilitate decentralized financial services across different blockchain ecosystems.
- The platform's core value proposition centers on enabling interoperability and expanding DeFi application scenarios through cross-chain functionality.
UNCX Project Focus:
- UNCX's investment prospects are fundamentally dependent on its capacity to solve concrete, real-world problems within the cryptocurrency space.
- Market acceptance and adoption of UNCX solutions will be critical determinants of its long-term value capture potential.
Ecosystem Comparison:
- KAVA's cross-chain positioning suggests broader DeFi integration opportunities compared to UNCX's problem-specific approach.
- The differentiation in technological focus creates distinct ecosystem development trajectories.
Problem-Solving Capability and Market Demand
Value Assessment Framework: In the cryptocurrency industry, any project's investment value must be evaluated through two core dimensions:
- Real Problem Resolution: Whether the project addresses genuine pain points or inefficiencies.
- Token Value Capture: The mechanism through which the native token captures economic value from platform growth and adoption.
KAVA's Value Proposition:
- As a cross-chain finance platform, KAVA's token demonstrates stronger long-term value potential due to its broad application scope in connecting disparate blockchain ecosystems.
UNCX's Value Proposition:
- UNCX's investment outlook depends on market validation of its specific problem-solving approach and the breadth of adoption it achieves.
Community Support and Institutional Adoption
Community Engagement: Both projects' success is contingent upon sustained community support and developer engagement within their respective ecosystems.
Market Positioning:
- Technology innovation, market demand, and community support serve as the foundational pillars for differentiating KAVA and UNCX investment profiles.
III. Risk Considerations
Note: This analysis is based on available information current as of December 24, 2025. Cryptocurrency investments carry inherent volatility and risk. This report does not constitute investment advice.
The relative investment merits of UNCX and KAVA remain subject to:
- Technological execution and roadmap delivery
- Market adoption rates and real-world usage metrics
- Regulatory environment changes
- Macroeconomic conditions affecting risk asset valuations
IV. Conclusion
UNCX and KAVA represent distinct value propositions within the cryptocurrency ecosystem. KAVA's cross-chain finance platform offers broader applicability within the DeFi landscape, while UNCX's value depends on market validation of its specialized problem-solving approach. Investment decisions should be based on individual risk tolerance, time horizon, and alignment with specific project fundamentals rather than speculative considerations.
III. 2025-2030 Price Forecast: UNCX vs KAVA
Short-term Forecast (2025)
- UNCX: Conservative $88.31-$111.78 | Optimistic $111.78-$133.02
- KAVA: Conservative $0.0392-$0.0754 | Optimistic $0.0754-$0.0904
Mid-term Forecast (2027-2028)
- UNCX may enter a consolidation-to-growth phase, with projected price range of $127.75-$183.64, gaining approximately 34-42% over the forecast period
- KAVA may experience accelerated appreciation phase, with projected price range of $0.0576-$0.1627, showing stronger upward momentum of 57% by 2028
- Key drivers: Institutional capital inflows, ecosystem development, DeFi protocol maturation, and potential regulatory clarity
Long-term Forecast (2030)
- UNCX: Base case $169.22-$181.96 | Optimistic scenario $181.96-$223.81, representing 62% potential gain
- KAVA: Base case $0.0832-$0.1513 | Optimistic scenario $0.1513-$0.1649, representing 100% potential gain
Disclaimer: This analysis is based on historical data and statistical models. Cryptocurrency markets are highly volatile and subject to regulatory, technological, and macroeconomic factors. Price forecasts do not constitute investment advice. Past performance does not guarantee future results. Investors should conduct independent research and consult financial advisors before making investment decisions.
UNCX:
| 年份 | 预测最高价 | 预测平均价格 | 预测最低价 | 涨跌幅 |
|---|---|---|---|---|
| 2025 | 133.0182 | 111.78 | 88.3062 | 0 |
| 2026 | 177.478695 | 122.3991 | 62.423541 | 9 |
| 2027 | 169.430954175 | 149.9388975 | 134.94500775 | 34 |
| 2028 | 183.637664713125 | 159.6849258375 | 127.74794067 | 42 |
| 2029 | 192.26065070835 | 171.6612952753125 | 139.045649173003125 | 53 |
| 2030 | 223.811996779952437 | 181.96097299183125 | 169.223704882403062 | 62 |
KAVA:
| 年份 | 预测最高价 | 预测平均价格 | 预测最低价 | 涨跌幅 |
|---|---|---|---|---|
| 2025 | 0.090432 | 0.07536 | 0.0391872 | 0 |
| 2026 | 0.10942272 | 0.082896 | 0.07709328 | 10 |
| 2027 | 0.1413542592 | 0.09615936 | 0.057695616 | 27 |
| 2028 | 0.162696829152 | 0.1187568096 | 0.079567062432 | 57 |
| 2029 | 0.1618358422824 | 0.140726819376 | 0.07317794607552 | 86 |
| 2030 | 0.164896650603828 | 0.1512813308292 | 0.08320473195606 | 100 |
Comparative Investment Analysis Report: UNCX vs KAVA
I. Investment Strategy Comparison: UNCX vs KAVA
Long-term vs Short-term Investment Strategy
UNCX:
- Best suited for investors focused on specialized DApp solutions and Uniswap ecosystem participation
- Short-term traders may benefit from recent momentum (+12.17% over 7 days, +9.56% over 30 days)
- Long-term holders should monitor ecosystem adoption and real-world usage metrics
KAVA:
- Ideal for investors seeking broader DeFi infrastructure exposure and cross-chain finance solutions
- Short-term positioning challenged by sustained downward pressure (-14.01% over 7 days, -34.94% over 30 days)
- Long-term strategy aligns with institutional support (100+ partners) and cross-chain DeFi expansion potential
Risk Management and Asset Allocation
Conservative Investors:
- UNCX allocation: 15-20% | KAVA allocation: 20-25%
- Recommended: 55-65% stable coin positioning to mitigate extreme market fear conditions (Fear & Greed Index: 24)
Aggressive Investors:
- UNCX allocation: 30-40% | KAVA allocation: 35-45%
- Recommended: Reduced stable coin cushion (20-30%), increased exposure to growth potential
Hedging Instruments:
- Stable coin positioning for downside protection during extended bear market conditions
- Cross-asset diversification across UNCX, KAVA, and stables to reduce single-asset concentration risk
- Time-based dollar-cost averaging (DCA) approach to mitigate timing risk in volatile markets
II. Market Fundamentals Comparison
Liquidity and Trading Dynamics
| Factor | UNCX | KAVA |
|---|---|---|
| 24h Volume | $12,393.89 | $112,450.14 |
| Volume/Market Cap Ratio | Low | Moderate-High |
| Trading Pairs | Limited | 29+ exchanges |
| Price Discovery | Concentrated | Diversified |
| Liquidity Risk | Higher | Lower |
Supply Dynamics and Token Economics
UNCX:
- Total supply: 50,000 tokens (fixed cap)
- Circulating ratio: 72.33%
- Supply constraint: Buyback mechanism designed to reduce supply over time
- Scarcity factor: Higher due to limited total supply
KAVA:
- Total supply: 1,082,847,663 tokens (100% circulating)
- Circulating ratio: 100%
- Supply constraint: Unlimited maximum supply (∞)
- Inflation dynamics: Continued token issuance may impact long-term price appreciation
III. Potential Risk Comparison
Market Risk
UNCX:
- Concentrated trading liquidity creates price volatility and slippage risk for larger trades
- Limited 24-hour volume ($12,393.89) suggests vulnerable price discovery mechanism
- Severe historical depreciation (90% from ATH) indicates substantial drawdown potential
- Current market sentiment (Extreme Fear) increases downside vulnerability
KAVA:
- Steeper annual decline (-82.24%) compared to UNCX (-61.85%) suggests greater fundamental challenges
- Proximity to all-time low ($0.07531 vs $0.071579 ATL) indicates compressed valuation floor
- Sustained 7-day and 30-day downtrends signal continued selling pressure
- Unlimited maximum supply creates long-term inflation dilution risk
Technology Risk
UNCX:
- Platform concentration on Uniswap ecosystem creates dependency on single protocol
- Limited developer adoption data restricts ecosystem resilience assessment
- Specialized DApp platform success depends on market validation of specific token services
KAVA:
- Cross-chain interoperability introduces technical complexity and potential security vulnerabilities
- Multi-asset collateral system creates systemic risk exposure across multiple blockchain networks
- Protocol maturation and smart contract security audit status requires ongoing monitoring
Regulatory Risk
Both tokens face exposure to:
- Evolving global cryptocurrency classification and stablecoin regulation
- DeFi protocol regulatory scrutiny, particularly regarding lending and collateralization mechanisms
- Potential restrictions on cross-chain bridge functionality or collateral asset classes
- Enhanced compliance requirements for institutional participation channels
IV. Price Forecast Analysis (2025-2030)
UNCX Price Projections
| Year | High Forecast | Average Forecast | Low Forecast | Appreciation |
|---|---|---|---|---|
| 2025 | $133.02 | $111.78 | $88.31 | Baseline |
| 2026 | $177.48 | $122.40 | $62.42 | +9% |
| 2027 | $169.43 | $149.94 | $134.95 | +34% |
| 2028 | $183.64 | $159.68 | $127.75 | +42% |
| 2029 | $192.26 | $171.66 | $139.05 | +53% |
| 2030 | $223.81 | $181.96 | $169.22 | +62% |
KAVA Price Projections
| Year | High Forecast | Average Forecast | Low Forecast | Appreciation |
|---|---|---|---|---|
| 2025 | $0.0904 | $0.0754 | $0.0392 | Baseline |
| 2026 | $0.1094 | $0.0829 | $0.0771 | +10% |
| 2027 | $0.1414 | $0.0962 | $0.0577 | +27% |
| 2028 | $0.1627 | $0.1188 | $0.0796 | +57% |
| 2029 | $0.1618 | $0.1407 | $0.0732 | +86% |
| 2030 | $0.1649 | $0.1513 | $0.0832 | +100% |
Forecast Context
Forecasts are based on historical data and statistical modeling. Cryptocurrency markets remain highly volatile and subject to regulatory, technological, and macroeconomic disruptions. These projections do not constitute investment advice and carry substantial uncertainty.
UNCX Growth Profile: Moderate appreciation trajectory with consolidation phases, potentially benefiting from ecosystem maturation and institutional adoption.
KAVA Growth Profile: Higher percentage upside potential (100% vs 62% by 2030) reflecting current depressed valuation levels and potential recovery multiple expansion, though absolute price levels remain constrained.
V. Conclusion: Which Is the Better Buy?
📌 Investment Value Summary
UNCX Advantages:
- Superior short-term momentum (+12.17% 7-day, +9.56% 30-day performance)
- Fixed token supply (50,000 cap) creates scarcity and potential appreciation multiple
- Specialized Uniswap-centric positioning addresses specific DApp platform demand
- Higher absolute price level ($111.78) offers psychological valuation clarity
- Lower annual decline (-61.85%) suggests better recent relative performance
KAVA Advantages:
- Significantly larger market capitalization ($81.5M vs $5.3M) indicates broader institutional adoption
- 100+ institutional partners including Ripple and Cosmos provide ecosystem credibility
- Cross-chain DeFi infrastructure aligns with broader cryptocurrency interoperability trends
- Higher long-term forecast appreciation (100% potential by 2030 vs 62% for UNCX)
- Moderate-to-high liquidity environment (112,450.14 24-hour volume) reduces execution risk
- Ranked #379 globally vs #1665 for UNCX suggests stronger market recognition
✅ Investment Recommendations
Beginner Investors:
- KAVA preferred: Larger market cap, broader institutional support, and higher liquidity reduce execution and information risk
- Allocation strategy: Conservative positioning with 60-65% stablecoins given extreme fear conditions (Fear & Greed Index: 24)
- Time horizon: 3-5 years minimum to accommodate forecast recovery cycles
Experienced Investors:
- UNCX consideration: Recent momentum suggests potential short-to-medium term upside; monitor 7-day and 30-day performance continuation
- KAVA deep-value play: Proximity to all-time low combined with 100+ institutional backing creates risk/reward asymmetry
- Blended approach: 40% KAVA, 25% UNCX, 35% stables for intermediate risk tolerance
Institutional Investors:
- KAVA positioning: Established partnership network (100+ companies) and cross-chain infrastructure alignment with institutional DeFi deployment strategies
- Rebalancing triggers: Consider position adjustment if Fear & Greed Index exceeds 50 (fear diminishes) or BTC dominance shifts significantly
- Risk management: Utilize stablecoin basis for operational liquidity; establish position limits based on portfolio volatility targets
VI. Critical Considerations
⚠️ Risk Disclaimer: Cryptocurrency markets exhibit extreme volatility and remain highly speculative. The Fear & Greed Index reading of 24 (Extreme Fear) reflects widespread market pessimism that may intensify or resolve unpredictably. This analysis does not constitute investment advice. Investors must independently evaluate risk tolerance, time horizon, and financial objectives before cryptocurrency allocation decisions. Past performance does not guarantee future results. Price forecasts carry substantial uncertainty and should not form the basis of investment decisions.
Additional Risk Factors:
- Both tokens have declined 61-82% year-over-year, indicating structural headwinds beyond market cycles
- Limited trading volumes for UNCX ($12.4K daily) create significant slippage risk for medium-to-large position entries
- KAVA's unlimited maximum supply creates long-term dilution concerns despite current institutional support
- Regulatory environment remains uncertain, particularly regarding DeFi protocols and cross-chain functionality
- Macroeconomic conditions continue to affect risk asset valuations broadly
Report Generated: December 24, 2025
Data Current As Of: December 24, 2025, 07:13:57 UTC
Market Sentiment: Fear & Greed Index 24 (Extreme Fear)
None
Frequently Asked Questions: UNCX vs KAVA Investment Comparison
I. Pricing and Valuation Questions
Q1: What are the current price levels and market capitalizations for UNCX and KAVA?
As of December 24, 2025, UNCX trades at $111.78 USD with a market capitalization of $5.33 million (ranked #1665), while KAVA trades at $0.07531 USD with a market capitalization of $81.55 million (ranked #379). KAVA maintains approximately 15 times larger market cap despite significantly lower absolute price per token, reflecting differences in total token supply and circulating metrics.
Q2: How have UNCX and KAVA performed relative to their all-time highs?
UNCX peaked at $1,112.13 on December 7, 2021, representing a 90% decline from its all-time high. KAVA peaked at $9.12 on August 30, 2021, representing a 99.17% decline from its all-time high. Both tokens reflect the broader cryptocurrency market contraction from 2021 through 2025, with KAVA experiencing steeper percentage depreciation despite lower absolute price levels.
Q3: Which token shows stronger short-term momentum?
UNCX demonstrates superior short-term performance with gains of +12.17% over 7 days and +9.56% over 30 days. KAVA exhibits sustained downward pressure with declines of -14.01% over 7 days and -34.94% over 30 days. However, both tokens declined within the 24-hour period (-1.93% for UNCX, -3.33% for KAVA), indicating ongoing market weakness across both positions.
II. Ecosystem and Technology Questions
Q4: What are the fundamental technological differences between UNCX and KAVA?
UNCX operates as a Uniswap-centric decentralized application platform providing plug-and-play token services with emphasis on security, speed, and convenience. KAVA functions as a cross-chain decentralized finance platform enabling collateralized lending and stablecoin services across multiple blockchain networks (BTC, XRP, BNB, ATOM). KAVA's cross-chain infrastructure offers broader ecosystem integration, while UNCX specializes in concentrated Uniswap-dependent solutions.
Q5: What institutional support exists for each project?
KAVA benefits from over 100 institutional partners globally, including prominent blockchain projects such as Ripple and Cosmos, providing substantial ecosystem credibility and adoption potential. UNCX's institutional support metrics remain less documented in available research. KAVA's diversified partnership network creates broader adoption pathways compared to UNCX's specialized platform positioning.
III. Risk and Investment Strategy Questions
Q6: Which token presents lower liquidity and execution risk?
KAVA exhibits superior liquidity with 24-hour trading volume of $112,450.14 USD across 29+ exchanges, compared to UNCX's $12,393.89 USD volume on concentrated exchange listings. KAVA's 9-fold higher volume reduces price slippage for medium-to-large position entries. UNCX's limited liquidity creates heightened execution risk and wider bid-ask spreads for traders, particularly problematic during volatile market conditions.
Q7: What are the supply dynamics and long-term inflation considerations?
UNCX maintains a fixed total supply of 50,000 tokens with 72.33% circulating and a buyback mechanism designed to reduce supply over time, creating scarcity dynamics. KAVA operates with 1,082,847,663 tokens at 100% circulating supply and unlimited maximum supply (∞), creating ongoing inflation dilution risk. UNCX's constrained supply structure offers potential long-term appreciation benefits, while KAVA's unlimited supply creates valuation headwinds despite broader institutional adoption.
Q8: Which asset aligns better with different investor profiles?
Beginner investors should favor KAVA due to larger market cap ($81.5M), higher liquidity, and 100+ institutional partnerships reducing information asymmetry. Experienced investors may consider UNCX for short-to-medium term momentum plays while maintaining KAVA positions for long-term DeFi infrastructure exposure. Institutional investors should prioritize KAVA's established partnership ecosystem and cross-chain infrastructure alignment with institutional DeFi deployment strategies, though position sizing should remain conservative given the Fear & Greed Index reading of 24 (Extreme Fear).
Important Disclaimer: This FAQ analysis does not constitute investment advice. Cryptocurrency investments carry inherent volatility and risk. The Fear & Greed Index reading of 24 indicates extreme market fear that may intensify unpredictably. Investors must independently evaluate risk tolerance, time horizon, and financial objectives before allocation decisions. Past performance does not guarantee future results.
Share
Content
Introduction: UNCX vs KAVA Investment Comparison
I. Price History Comparison and Current Market Status
II. Project Overview and Ecosystem Context
III. Price Performance Analysis
IV. Market Metrics and Valuation
V. Comparative Summary and Distinctions
VI. Resource Links
I. Executive Summary
II. Core Factors Influencing UNCX vs KAVA Investment Value
III. Risk Considerations
IV. Conclusion
III. 2025-2030 Price Forecast: UNCX vs KAVA
I. Investment Strategy Comparison: UNCX vs KAVA
II. Market Fundamentals Comparison
III. Potential Risk Comparison
IV. Price Forecast Analysis (2025-2030)
V. Conclusion: Which Is the Better Buy?
VI. Critical Considerations
I. Pricing and Valuation Questions
II. Ecosystem and Technology Questions
III. Risk and Investment Strategy Questions
How to Buy Cryptocurrency


Trending Cryptocurrencies


MOVR vs XLM: A Comprehensive Comparison of Two Leading Blockchain Assets in 2024
HLN vs LTC: A Comprehensive Comparison of Two Emerging Blockchain Assets
TDROP vs RUNE: A Comprehensive Comparison of Two Leading Blockchain Tokens and Their Market Performance
Is Ren (REN) a good investment?: A Comprehensive Analysis of Price Performance, Use Cases, and Market Outlook in 2024
OMG vs CRO: Which Cryptocurrency Offers Better Investment Potential in 2024?
REEF Token Turmoil: Investor Suffers Huge Losses Amid Price Crash
How Do MACD, RSI, and KDJ Technical Indicators Predict KAS Price Movement in 2025?
A Step-by-Step Guide to Buying Dogecoin with a Credit Card in Japan
2025 PROPS Price Prediction: Expert Analysis and Market Forecast for the Digital Asset
2025 DEGOD Price Prediction: Expert Analysis and Market Forecast for the Coming Year
How Does LUNC Exchange Net Inflow and Holding Concentration Impact Terra Classic's Market Dynamics in 2025?