Gate Research: DRIP Ignites the Arbitrum Ecosystem, Plasma Becomes a Capital Magnet|Web3 On-Chain Data Insights for September 2025
Abstract
- On-chain transactions and user structures continue to diverge. Solana and Base maintain dominance in high-frequency interactions, while Ethereum remains the core hub for high-value activity, forming a “high-frequency × high-value” dual-track ecosystem.
- Capital flows are undergoing sharp rotations. Arbitrum, boosted by the DRIP incentive program, has attracted substantial liquidity, whereas Ethereum and Base have seen significant outflows. Funds are increasingly concentrating on ecosystems with growth potential and strong incentive mechanisms.
- Bitcoin’s on-chain structure at high levels is showing signs of fatigue, with short-term capital enthusiasm fading and long-term holders reducing positions. Market momentum is weakening; without new inflows, the price may remain in a high-level consolidation phase and face short-term correction pressure.
- Plasma achieved explosive growth in both capital and users during its first week after mainnet launch, supported by its integrated stablecoin architecture and aggressive market strategy. Its TVL surpassed USD 5.4 billion, demonstrating the strong carrying capacity of emerging stablecoin ecosystems.
- MYX Finance, leveraging innovation in perpetual contract mechanisms and high-frequency incentive strategies, has become one of the fastest-rising stars in the derivatives sector. Its token surged more than 60% in a single week, with market attention and capital inflows continuing to climb.
On-Chain Insights Overview
Overview of On-Chain Activity and Capital Flow
In addition to analyzing overall on-chain capital flows, we further selected several key on-chain activity metrics to assess the actual usage and engagement levels across blockchain ecosystems. These indicators include daily transaction volume, daily gas fees, daily active addresses, and net cross-chain bridge flows—capturing user behavior, network utilization intensity, and asset mobility. Compared to observing capital inflows and outflows alone, these native on-chain data points provide a more comprehensive reflection of fundamental shifts in blockchain ecosystems. They help determine whether capital flows are accompanied by genuine user demand and growth, enabling identification of networks with sustainable development potential.
Transaction Analysis: Solana and Base Maintain Growth, Ethereum Slightly Retreats
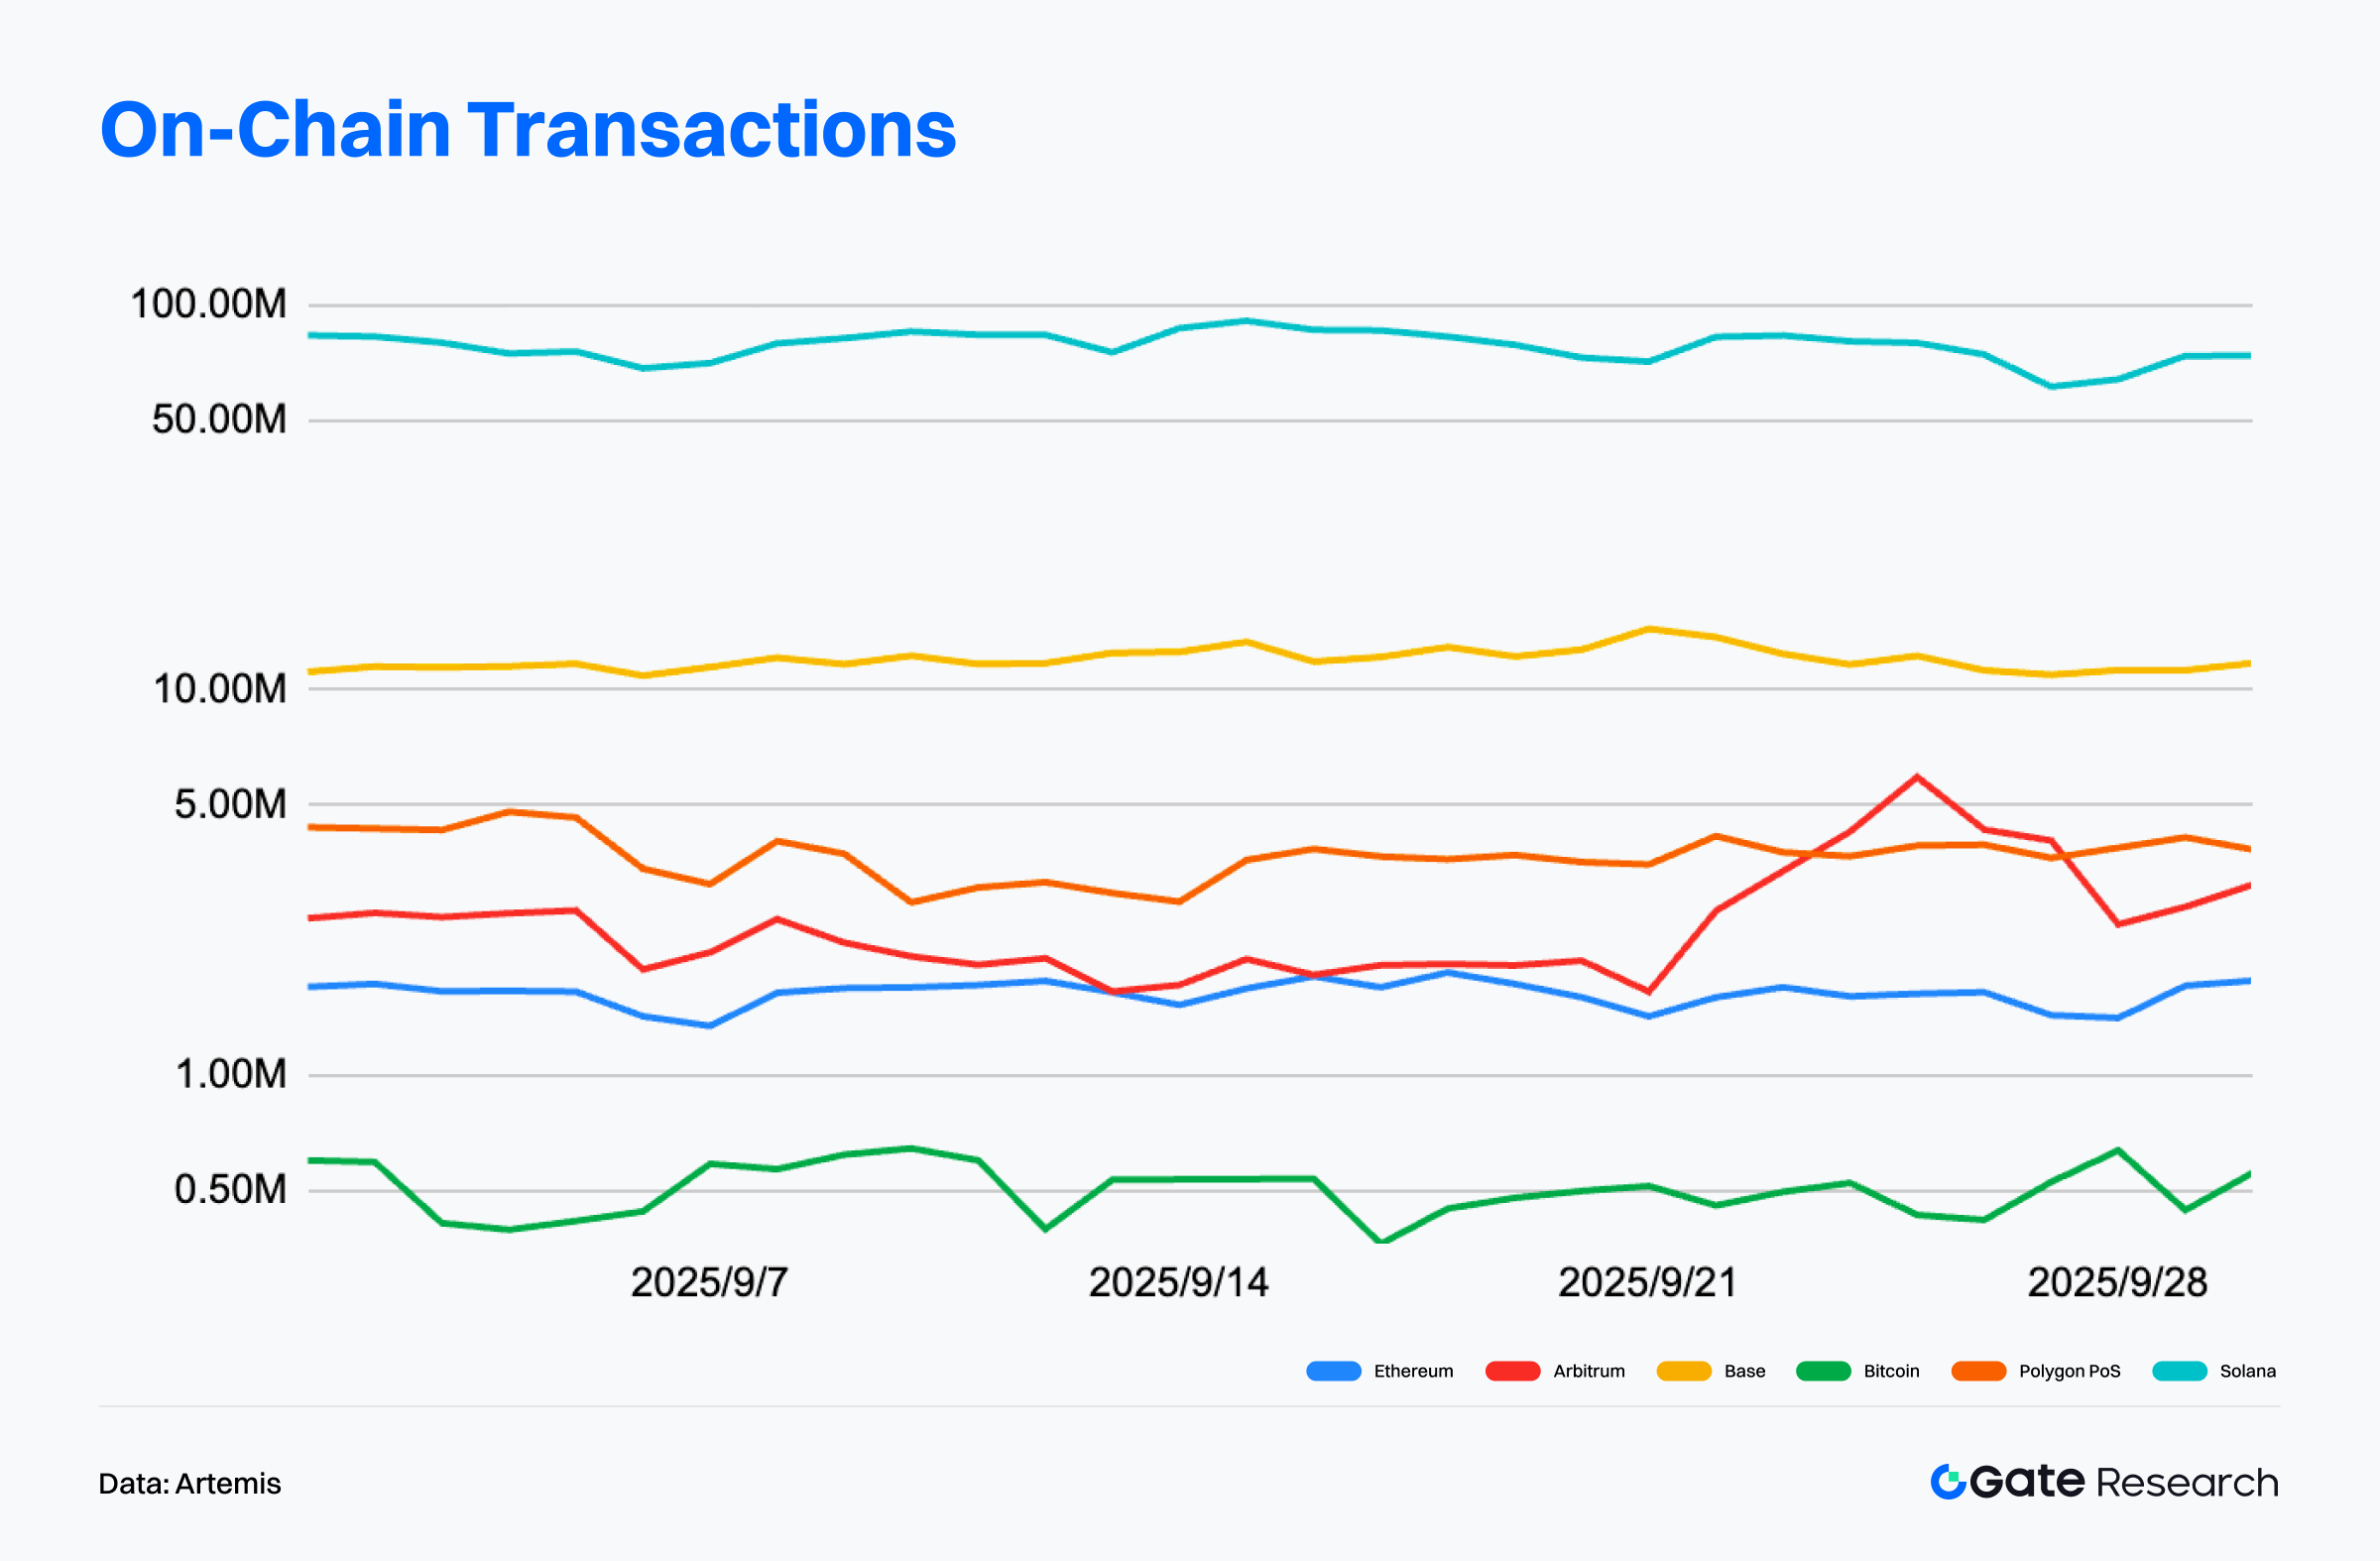
According to Artemis data, transactions across major blockchains in September showed structural divergence. Solana remained at the top, with a monthly transaction count of 2.3 billion, down slightly from 2.8 billion in August but still at a remarkably high level, reflecting strong user stickiness and ecosystem vitality.【1】
Base recorded the strongest growth, with monthly transactions increasing from 285 million to 361 million, a 26.6% rise, further expanding its leadership within the Layer2 landscape. Its stable low-fee environment and rich ecosystem of applications have been key drivers of this growth.
Ethereum mainnet experienced a minor decline of 5.55% in transaction volume, though it continues to play a central structural role as the hub for high-value assets and protocol interactions.
Arbitrum saw a drop of 11.5% in transactions but recorded a sharp rebound in late September, boosted by the DRIP incentive program, which may restore momentum in the short term.
Overall, the on-chain transaction landscape continues to follow a “high-frequency × high-value” dual-track structure. Solana and Base lead in high-frequency transactions, reflecting strong user activity and ecosystem penetration, while Ethereum and Arbitrum remain stable within DeFi use cases. This indicates that inter-chain functional specialization is becoming more defined, with blockchain ecosystems evolving toward structural differentiation and professionalization.
Active Address Analysis: Solana Leads, Arbitrum Rebounds
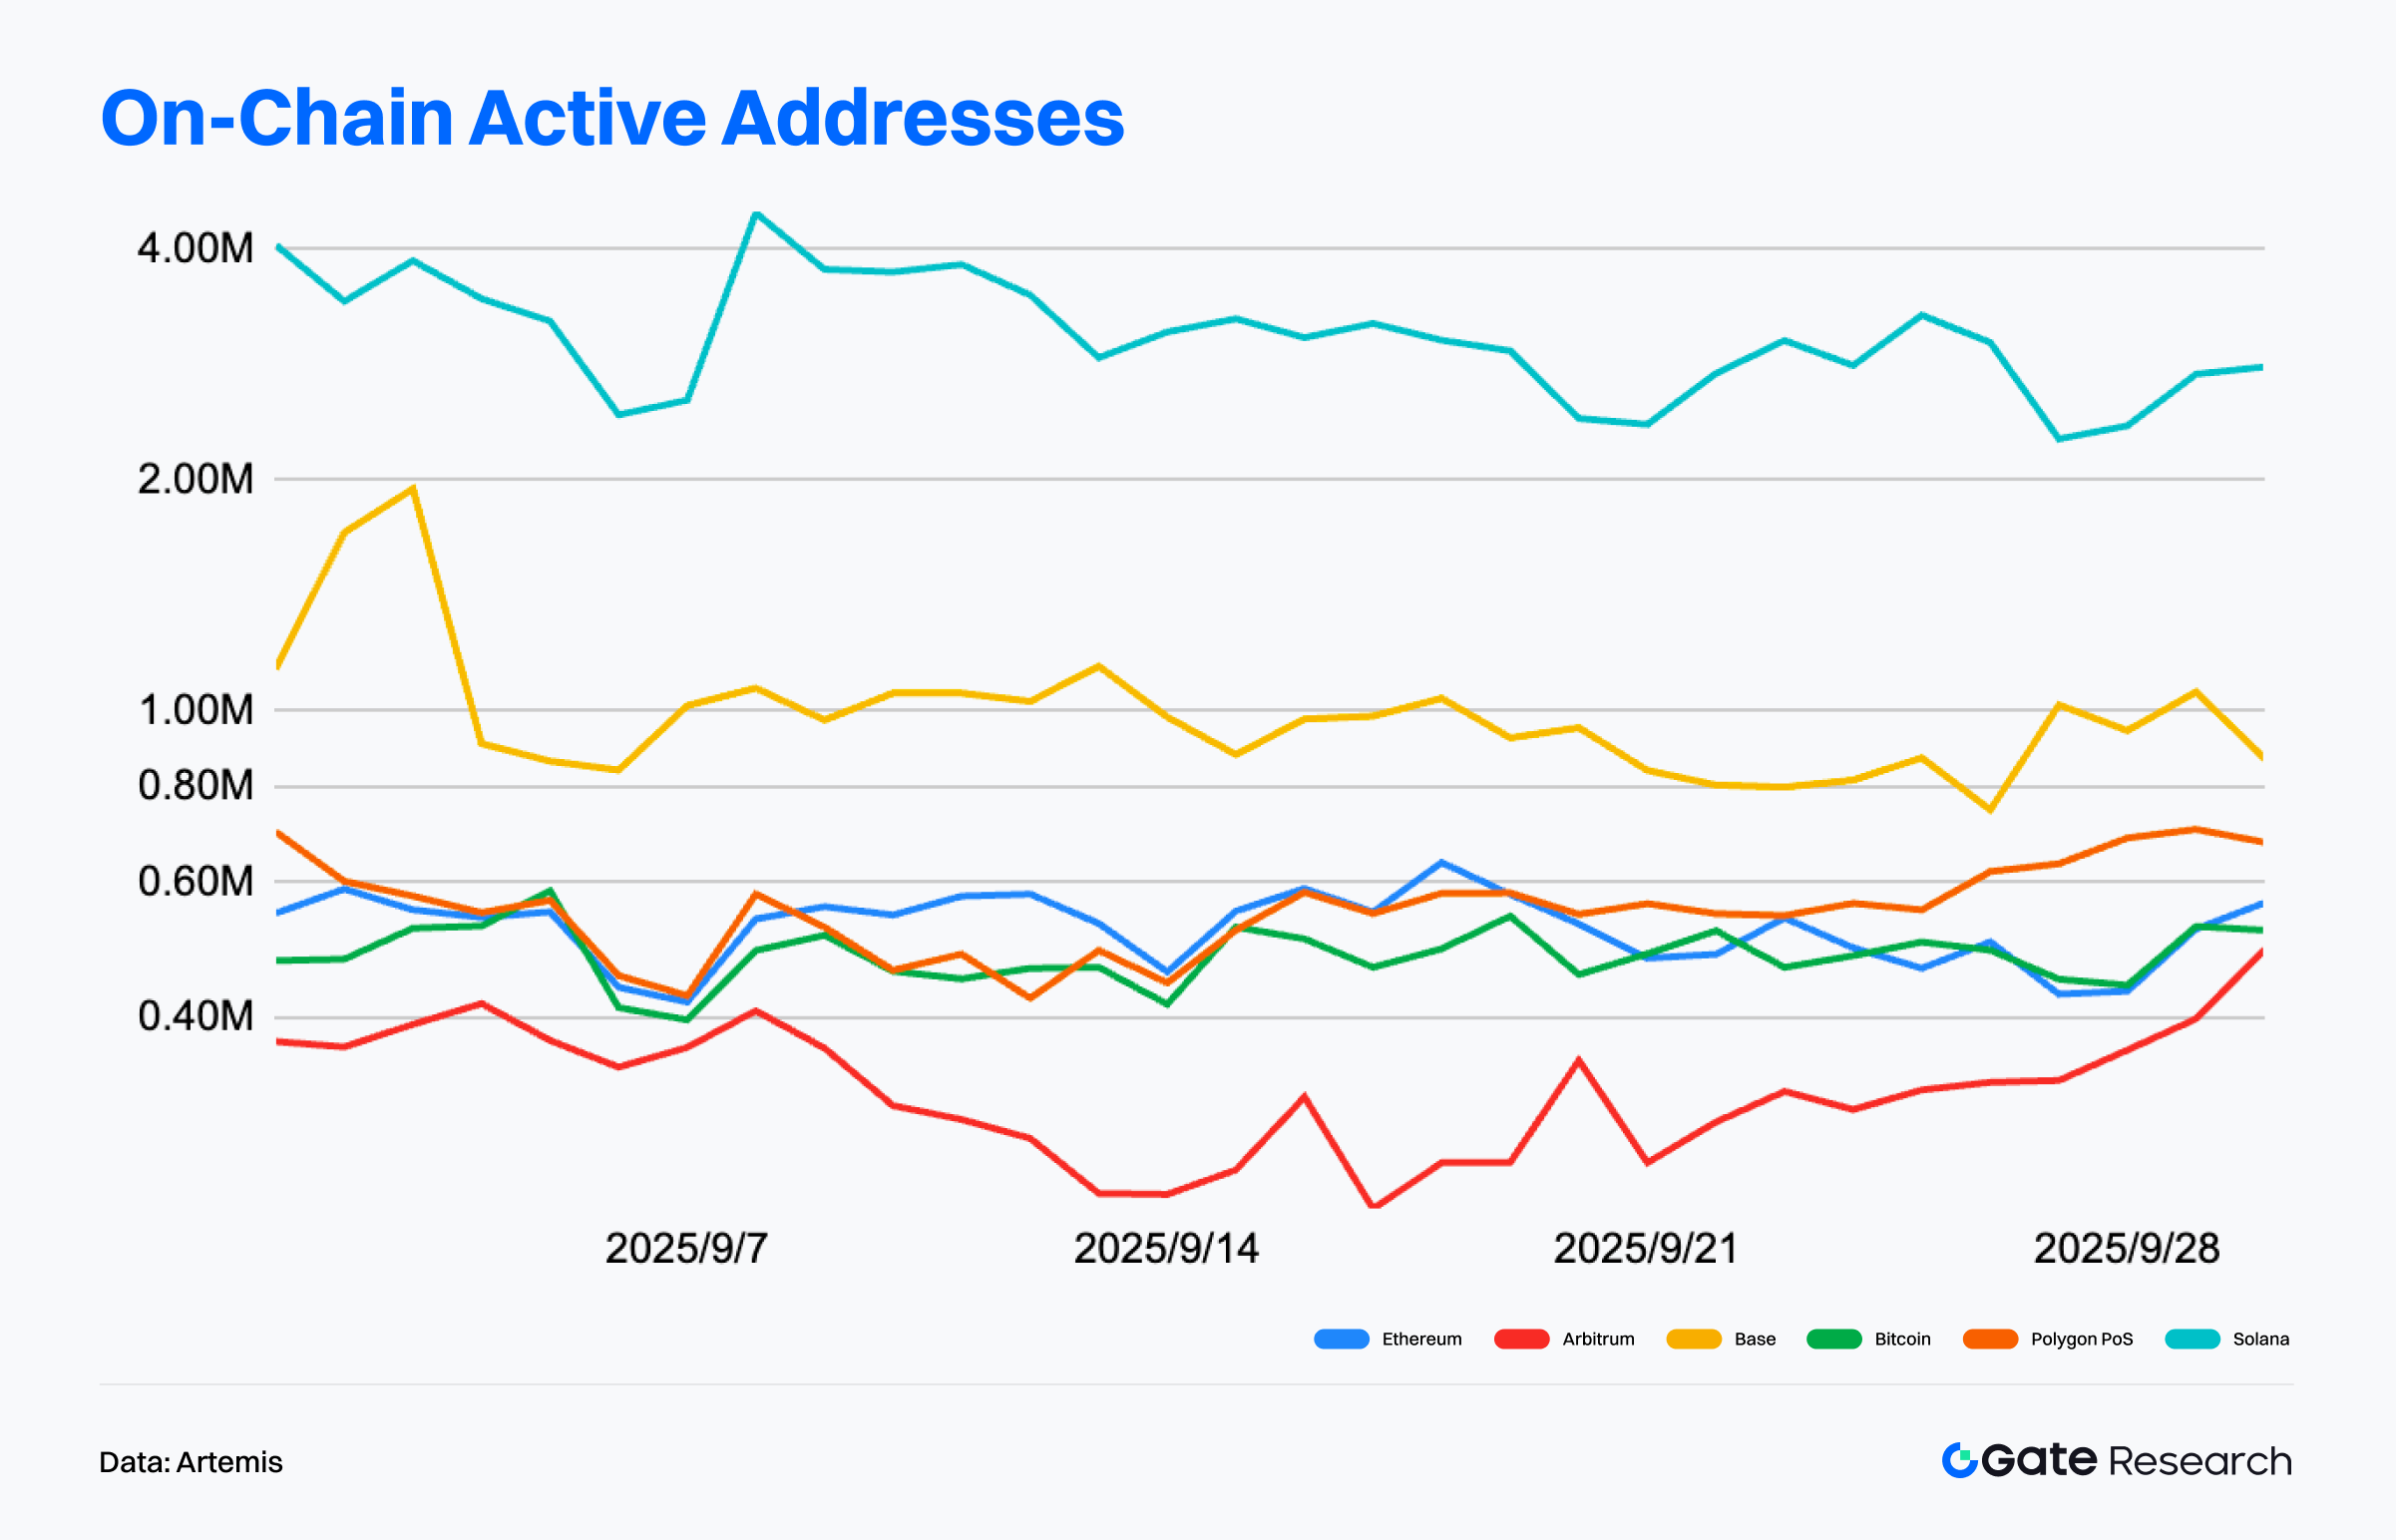
According to Artemis data, during September 2025, Solana maintained its lead in active addresses, averaging 3 to 4 million daily, demonstrating exceptionally high user engagement and frequent interactions. Despite some volatility, Solana remains far ahead of its peers, firmly positioned as the “high-frequency user chain.”【2】
Base also performed impressively, with daily active addresses ranging between 800,000 and 1.2 million, showing a clear uptrend toward the end of the month—evidence of its expanding ecosystem and strong user acquisition capability, securing its second-place position.
Ethereum mainnet maintained 500,000 to 600,000 daily active addresses, showing a steady trend without new highs, indicating a stabilization in its mainnet activity. The “Mainnet + L2” structure remains central to Ethereum’s ecosystem expansion.
Arbitrum, after a weak start to the month, showed a clear rebound from mid-September, with active addresses climbing to around 700,000 by month-end. The DeFi Renaissance (DRIP) incentive plan is widely credited as a key driver of this recovery.
Overall, the user structure across chains is increasingly differentiated: Solana and Base dominate high-frequency interactions and everyday use cases, while Ethereum retains its role as the primary value carrier, complemented by L2 networks like Arbitrum, together forming a multilayered, functionally distinct ecosystem.
On-Chain Fee Revenue Analysis: Ethereum Leads, Polygon PoS Defies the Trend
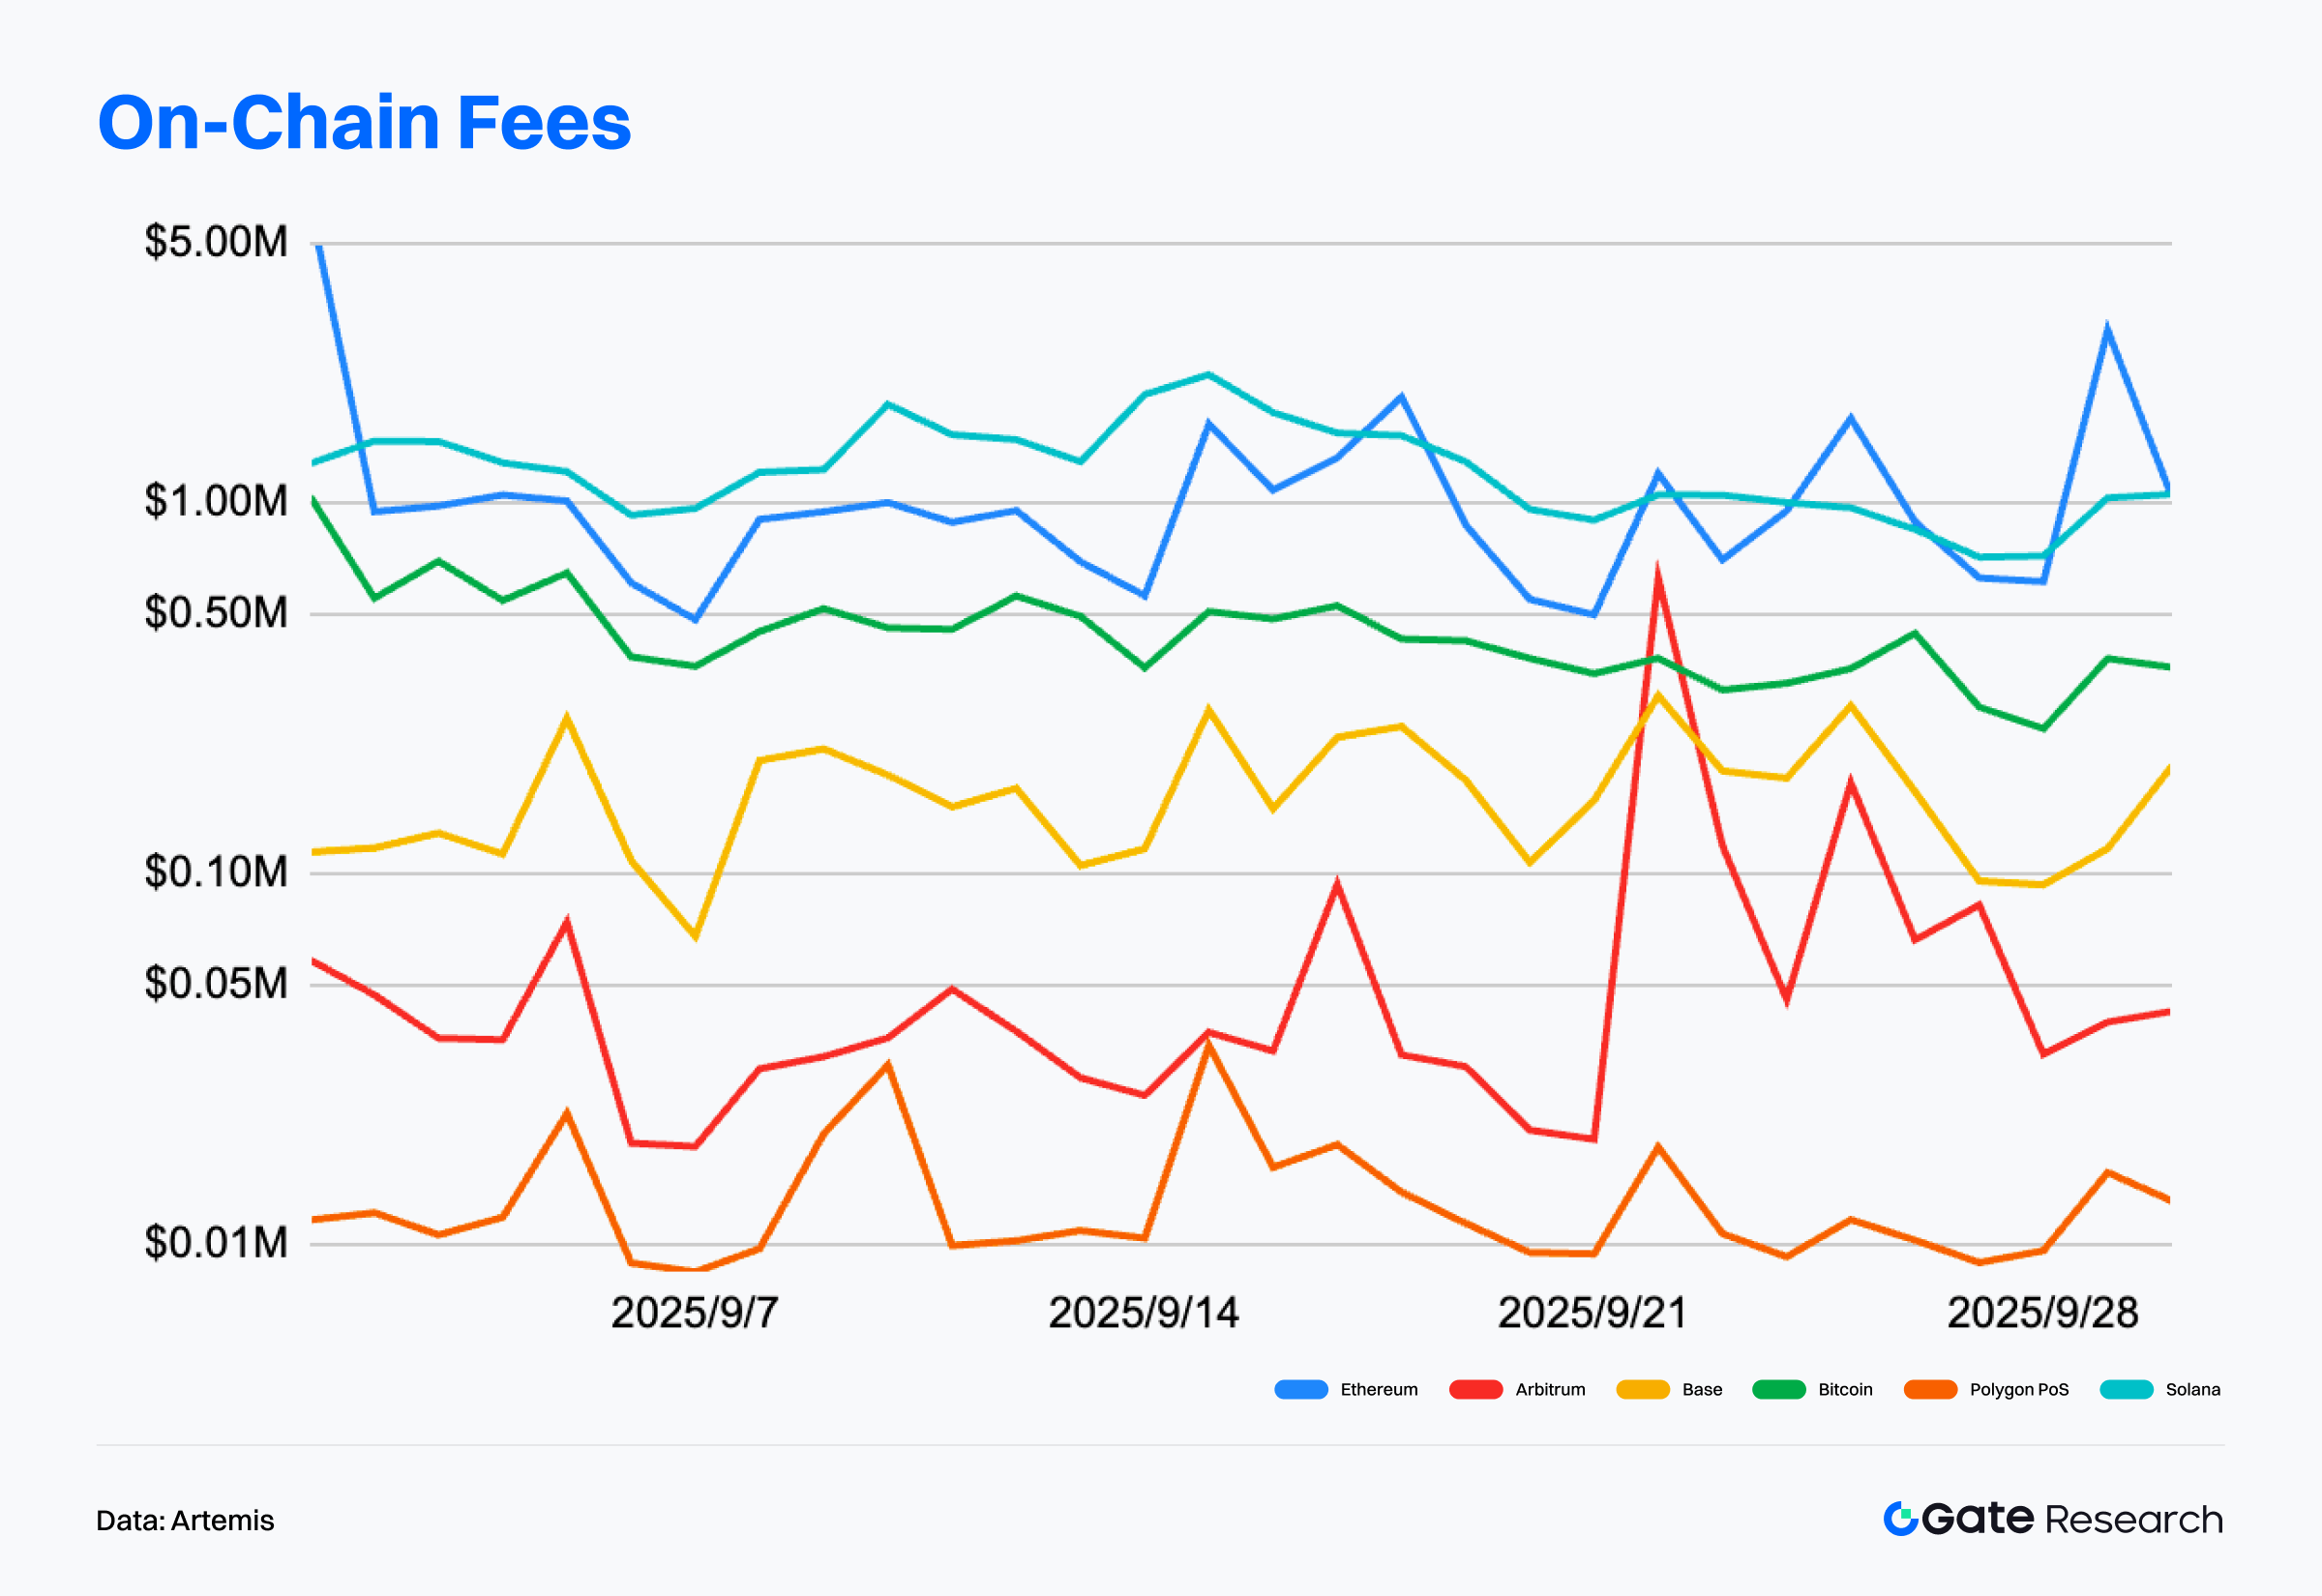
According to Artemis data, September’s on-chain fee revenue among major blockchains showed a clear structure of “high-value chains leading, high-frequency chains stable.”【3】
Ethereum remained firmly in the lead despite a 9.75% decline in revenue from August, underscoring its dominant role in DeFi through high-value transactions and active DEX usage.
Solana’s fee revenue fell 9.64%, a slight correction but still supported by its high-frequency transaction model. Base saw the largest drop, down over 15%, possibly reflecting a temporary cooling of ecosystem activity.
Arbitrum recorded an 8.88% decline but experienced a temporary surge in mid-to-late September, suggesting that short-term incentives brought higher volatility. Polygon PoS was the only major blockchain to post strong fee growth—up over 40% month-over-month—likely linked to its hard fork upgrade on September 11, which also coincided with key ecosystem updates.
Overall, while on-chain fee revenues trended downward, the underlying story reveals a deeper evolution in on-chain interaction structures. Solana and Base are expanding engagement through a “high-frequency, low-fee” model that builds stickiness among users and developers, while Ethereum continues to dominate “high-value, high-yield” use cases. This divergence highlights a dual-track dynamic between scale-oriented and value-oriented chains, where fee trends depend increasingly on network design and incentive mechanisms rather than pure transaction volume.
Capital Flow Divergence: Arbitrum Leads Inflows, Ethereum and Base See Large Outflows
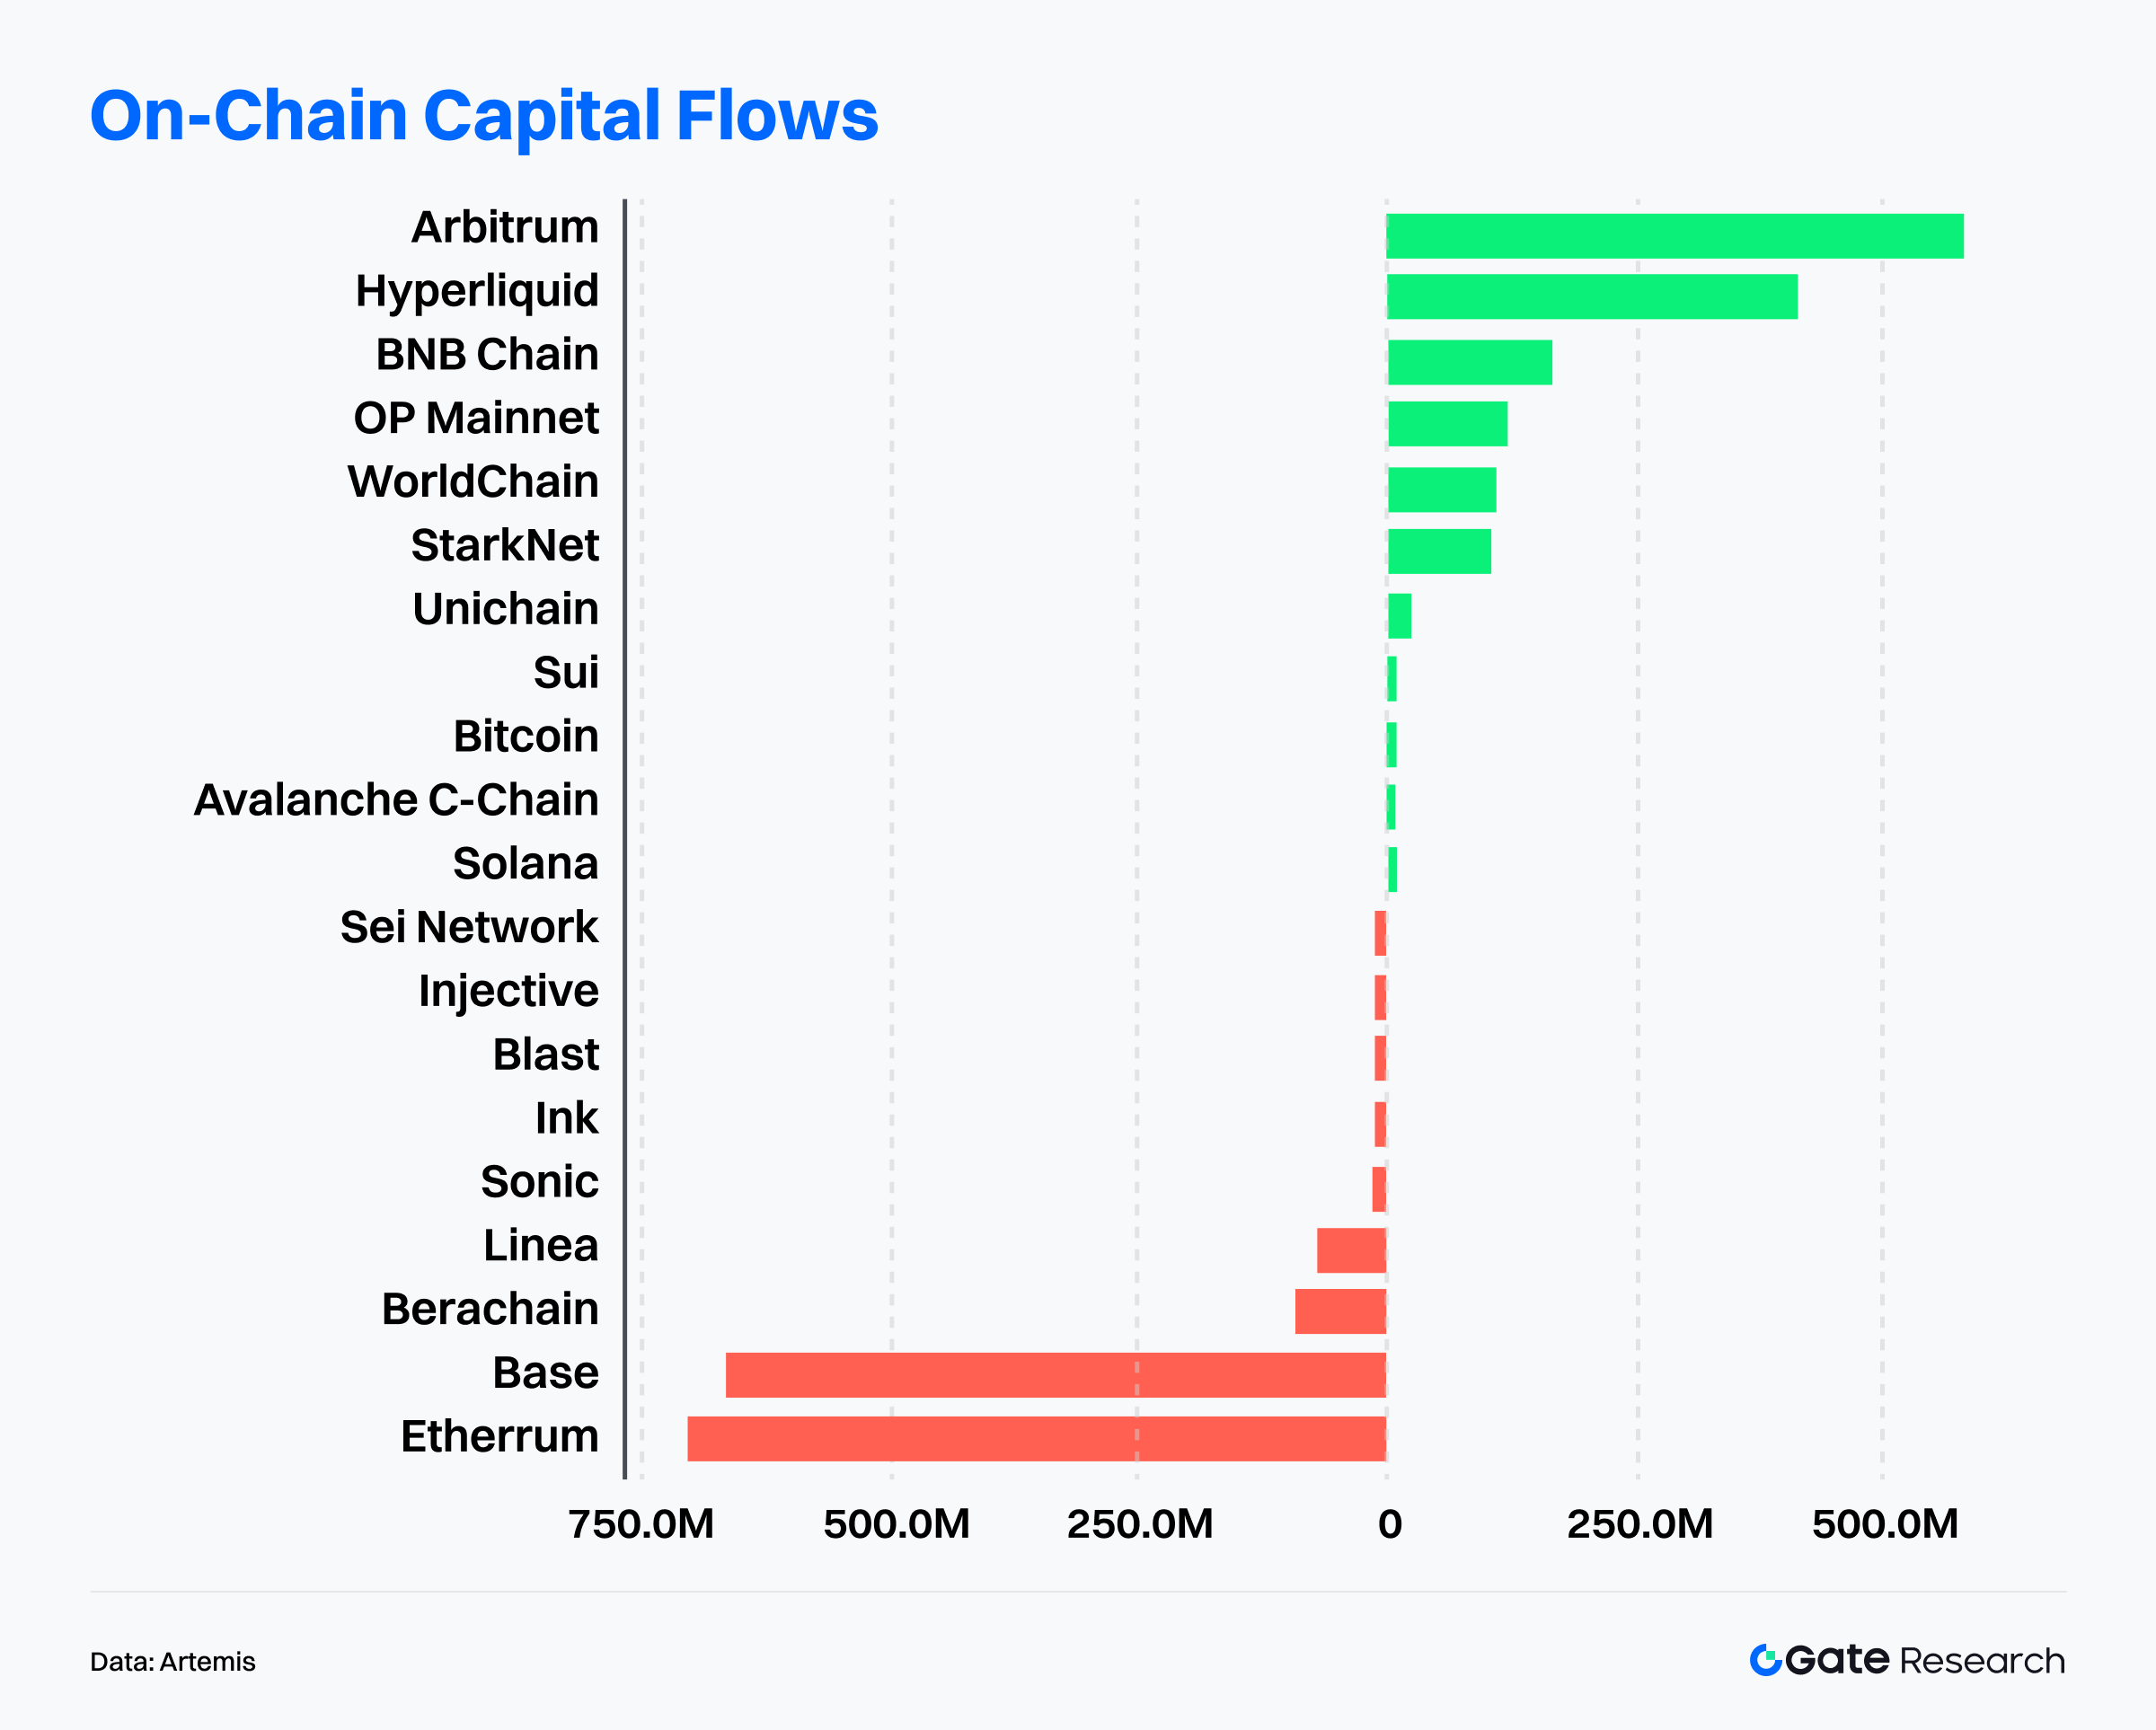
According to Artemis data, Arbitrum ranked first in net capital inflows over the past month, attracting over USD 500 million, reversing earlier outflow trends and becoming the most favored chain for capital. The key driver was the DeFi Renaissance (DRIP) incentive plan launched by ArbitrumDAO, which allocated 24 million ARB tokens in its first season to incentivize protocols such as Aave, Morpho, and Euler, encouraging users to adopt leveraged lending strategies with additional rewards. Within a week of launch, Arbitrum’s TVL increased by over USD 360 million, DEX liquidity rose 23%, and Morpho’s market size nearly tripled. Stablecoins also saw record-level inflows, with assets such as USDe and syrupUSDC expanding rapidly—underscoring DRIP’s strong catalytic effect on both liquidity and application growth.【4】
Following closely, Hyperliquid attracted over USD 400 million in inflows thanks to its optimized trading experience and high-frequency user engagement. BNB Chain, OP Mainnet, and WorldChain also recorded significant inflows, showing that certain L2s and trading-focused chains maintain robust capital attraction, reinforcing the concentration of liquidity toward ecosystems with real user bases and application depth.
In contrast, Ethereum recorded nearly USD 750 million in outflows for the month, while Base saw withdrawals exceeding USD 600 million, topping the list of ecosystems with the largest outflows. Emerging chains such as Berachain, Linea, and Sonic also faced varying degrees of capital withdrawal. This trend reflects a market-wide reallocation, where liquidity rotates toward projects with stronger growth potential while valuations of earlier popular chains undergo short-term corrections. As Layer2 competition intensifies, the market is reassessing the sustainability and real adoption of each ecosystem. Projects lacking continuous innovation or user traction now risk persistent liquidity outflows.
In summary, on-chain capital flows are rotating rapidly. Arbitrum’s ecosystem growth, driven by targeted incentives and protocol collaboration, has solidified its position as a leading Layer2 network. Meanwhile, ecosystems experiencing capital outflows must identify new sources of growth and innovation to regain market attention and liquidity momentum.
Bitcoin Key Metrics Analysis
In September, Bitcoin experienced a notable correction, dipping to a low of USD 107,261 and breaking below multiple moving averages, leading to a more cautious market sentiment. Toward the end of the month, however, bullish momentum began to return as short-term moving averages formed a golden cross, pushing the price back into an upward channel and breaking through key resistance levels at USD 116,000 and USD 120,000. Despite this rebound, both trading volume and MACD momentum have yet to expand in tandem, suggesting that the sustainability of the recovery remains uncertain.
With capital inflows slowing and demand momentum weakening, on-chain supply–demand dynamics and holder behavior have become key indicators for assessing future trends. This section focuses on three major on-chain metrics—realized cost basis and risk zones, Short-Term Holder Realized Value Ratio (STH RVT), and Long-Term Holder Net Position Change—to analyze Bitcoin’s current distribution structure, capital absorption capacity, and potential risks from an on-chain perspective.
Heavy Supply Zone Above BTC Price — Further Upside Requires Absorption
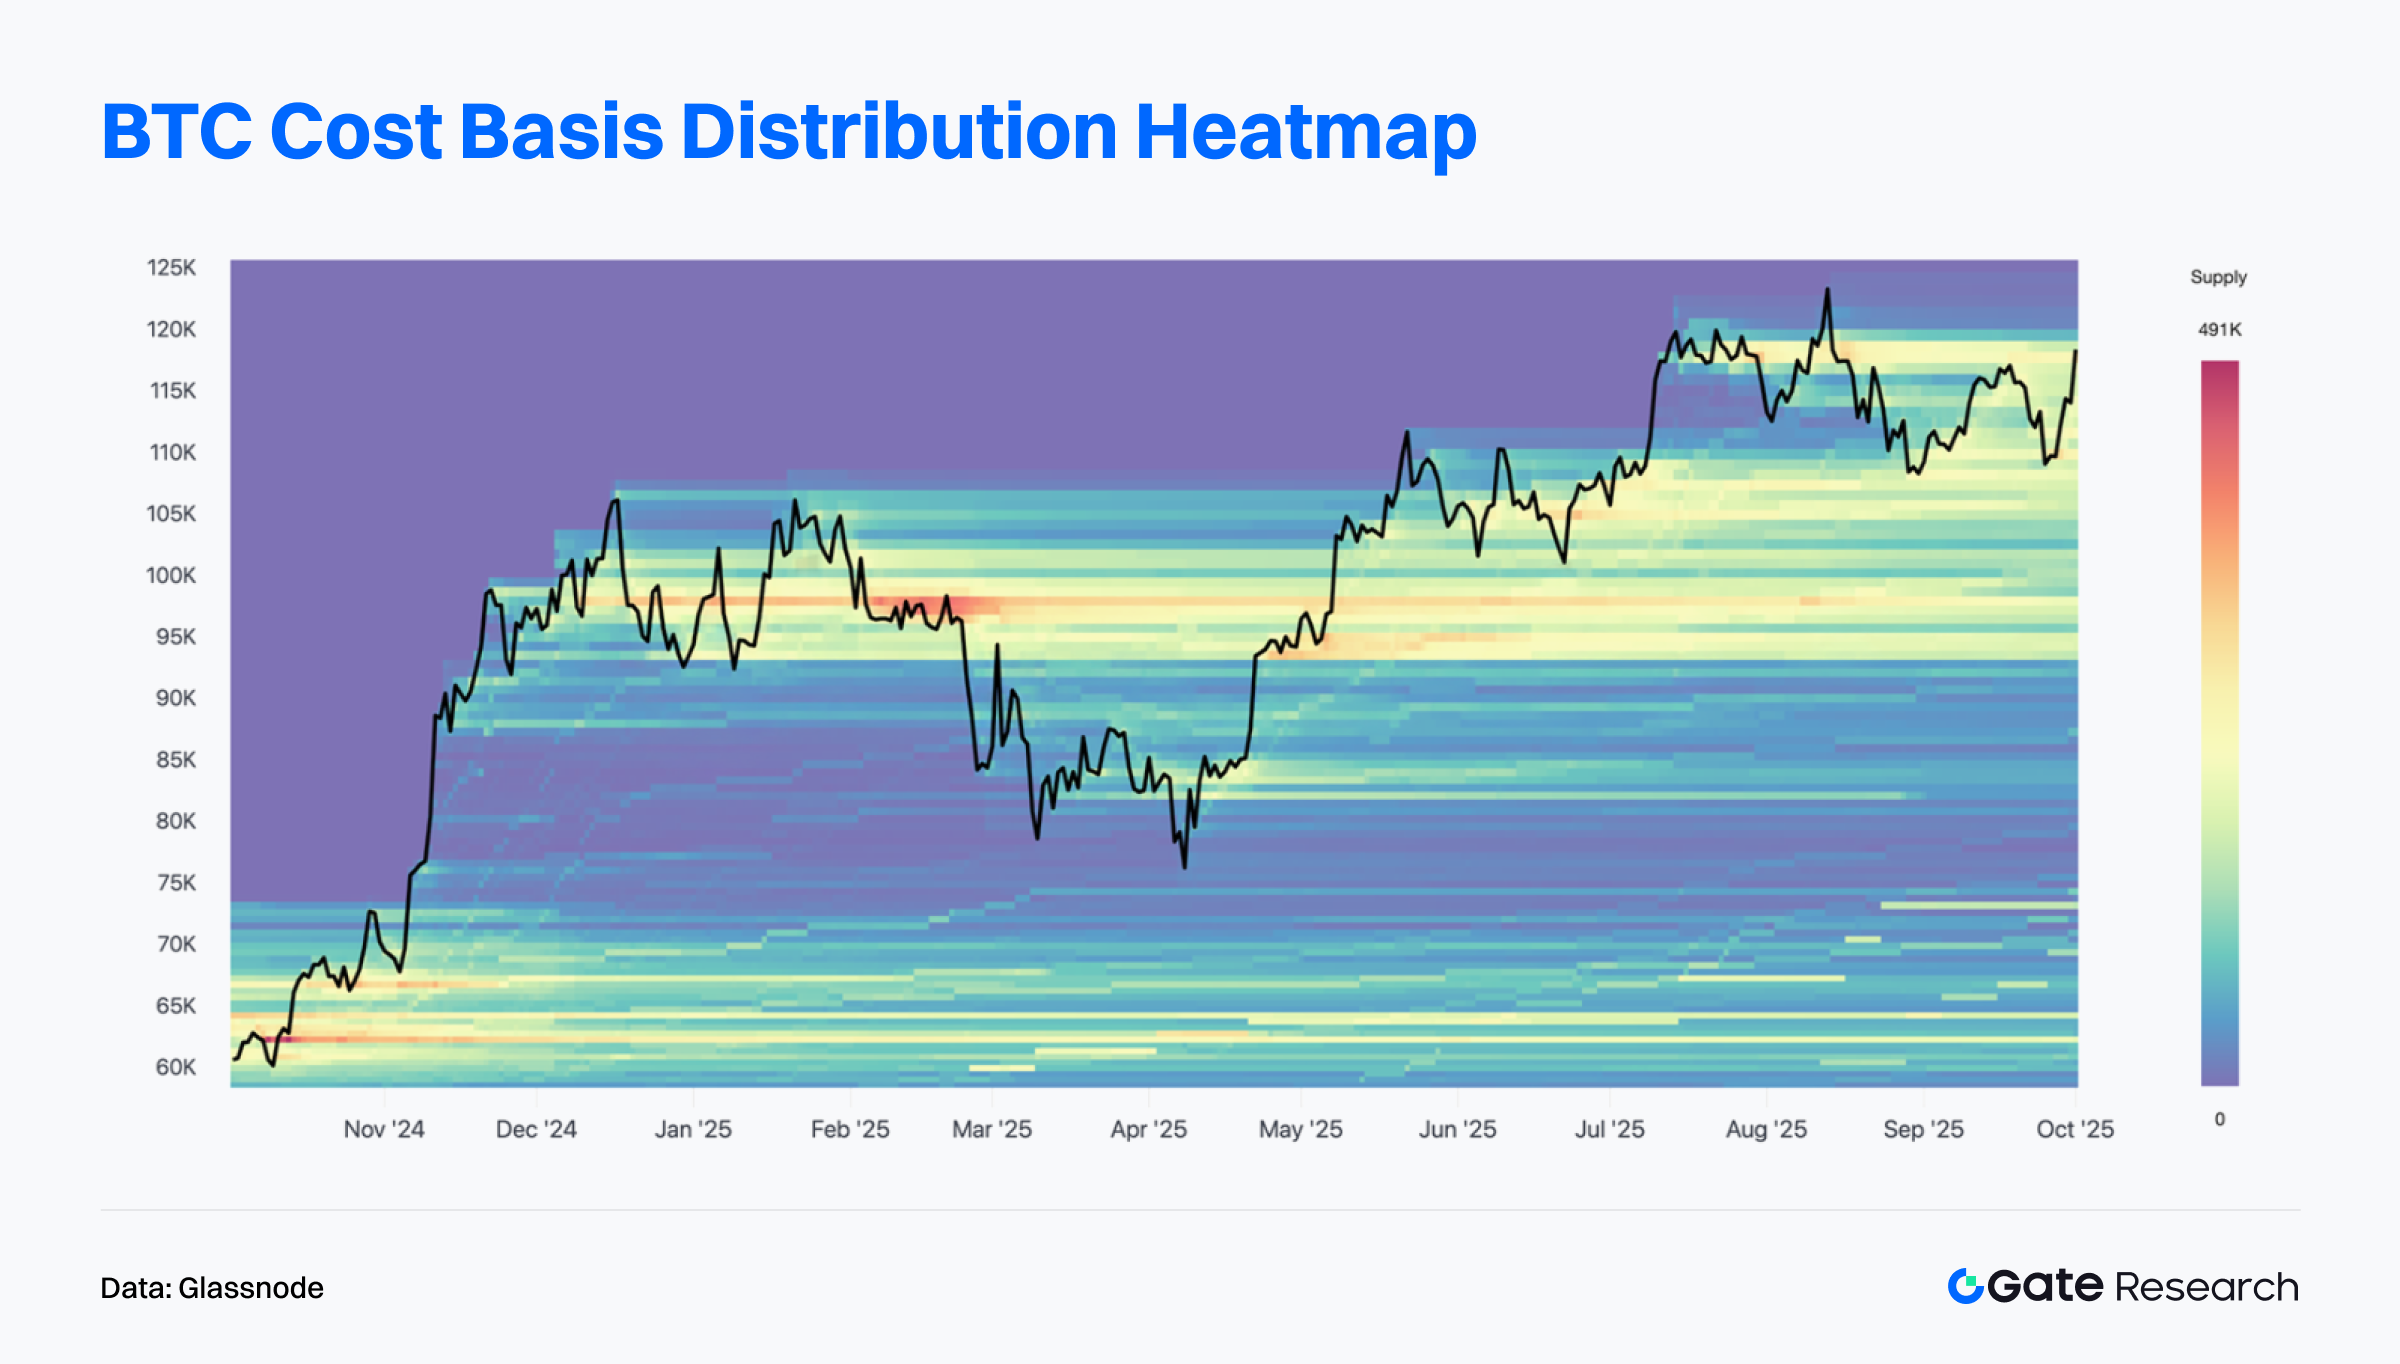
According to Glassnode data, Bitcoin is currently facing dense supply resistance in the USD 114,000–118,000 range. This area contains a large cluster of coins purchased between late August and early September, representing historical high-cost holdings.【6】
Once the price rebounds into this zone, previous buyers may choose to sell to break even or take small profits, creating significant selling pressure. To continue advancing toward new highs, the market must effectively absorb and rotate this supply, allowing for healthy consolidation before another leg upward.
Short-Term Holder Activity Remains Weak — Capital Momentum Cooling
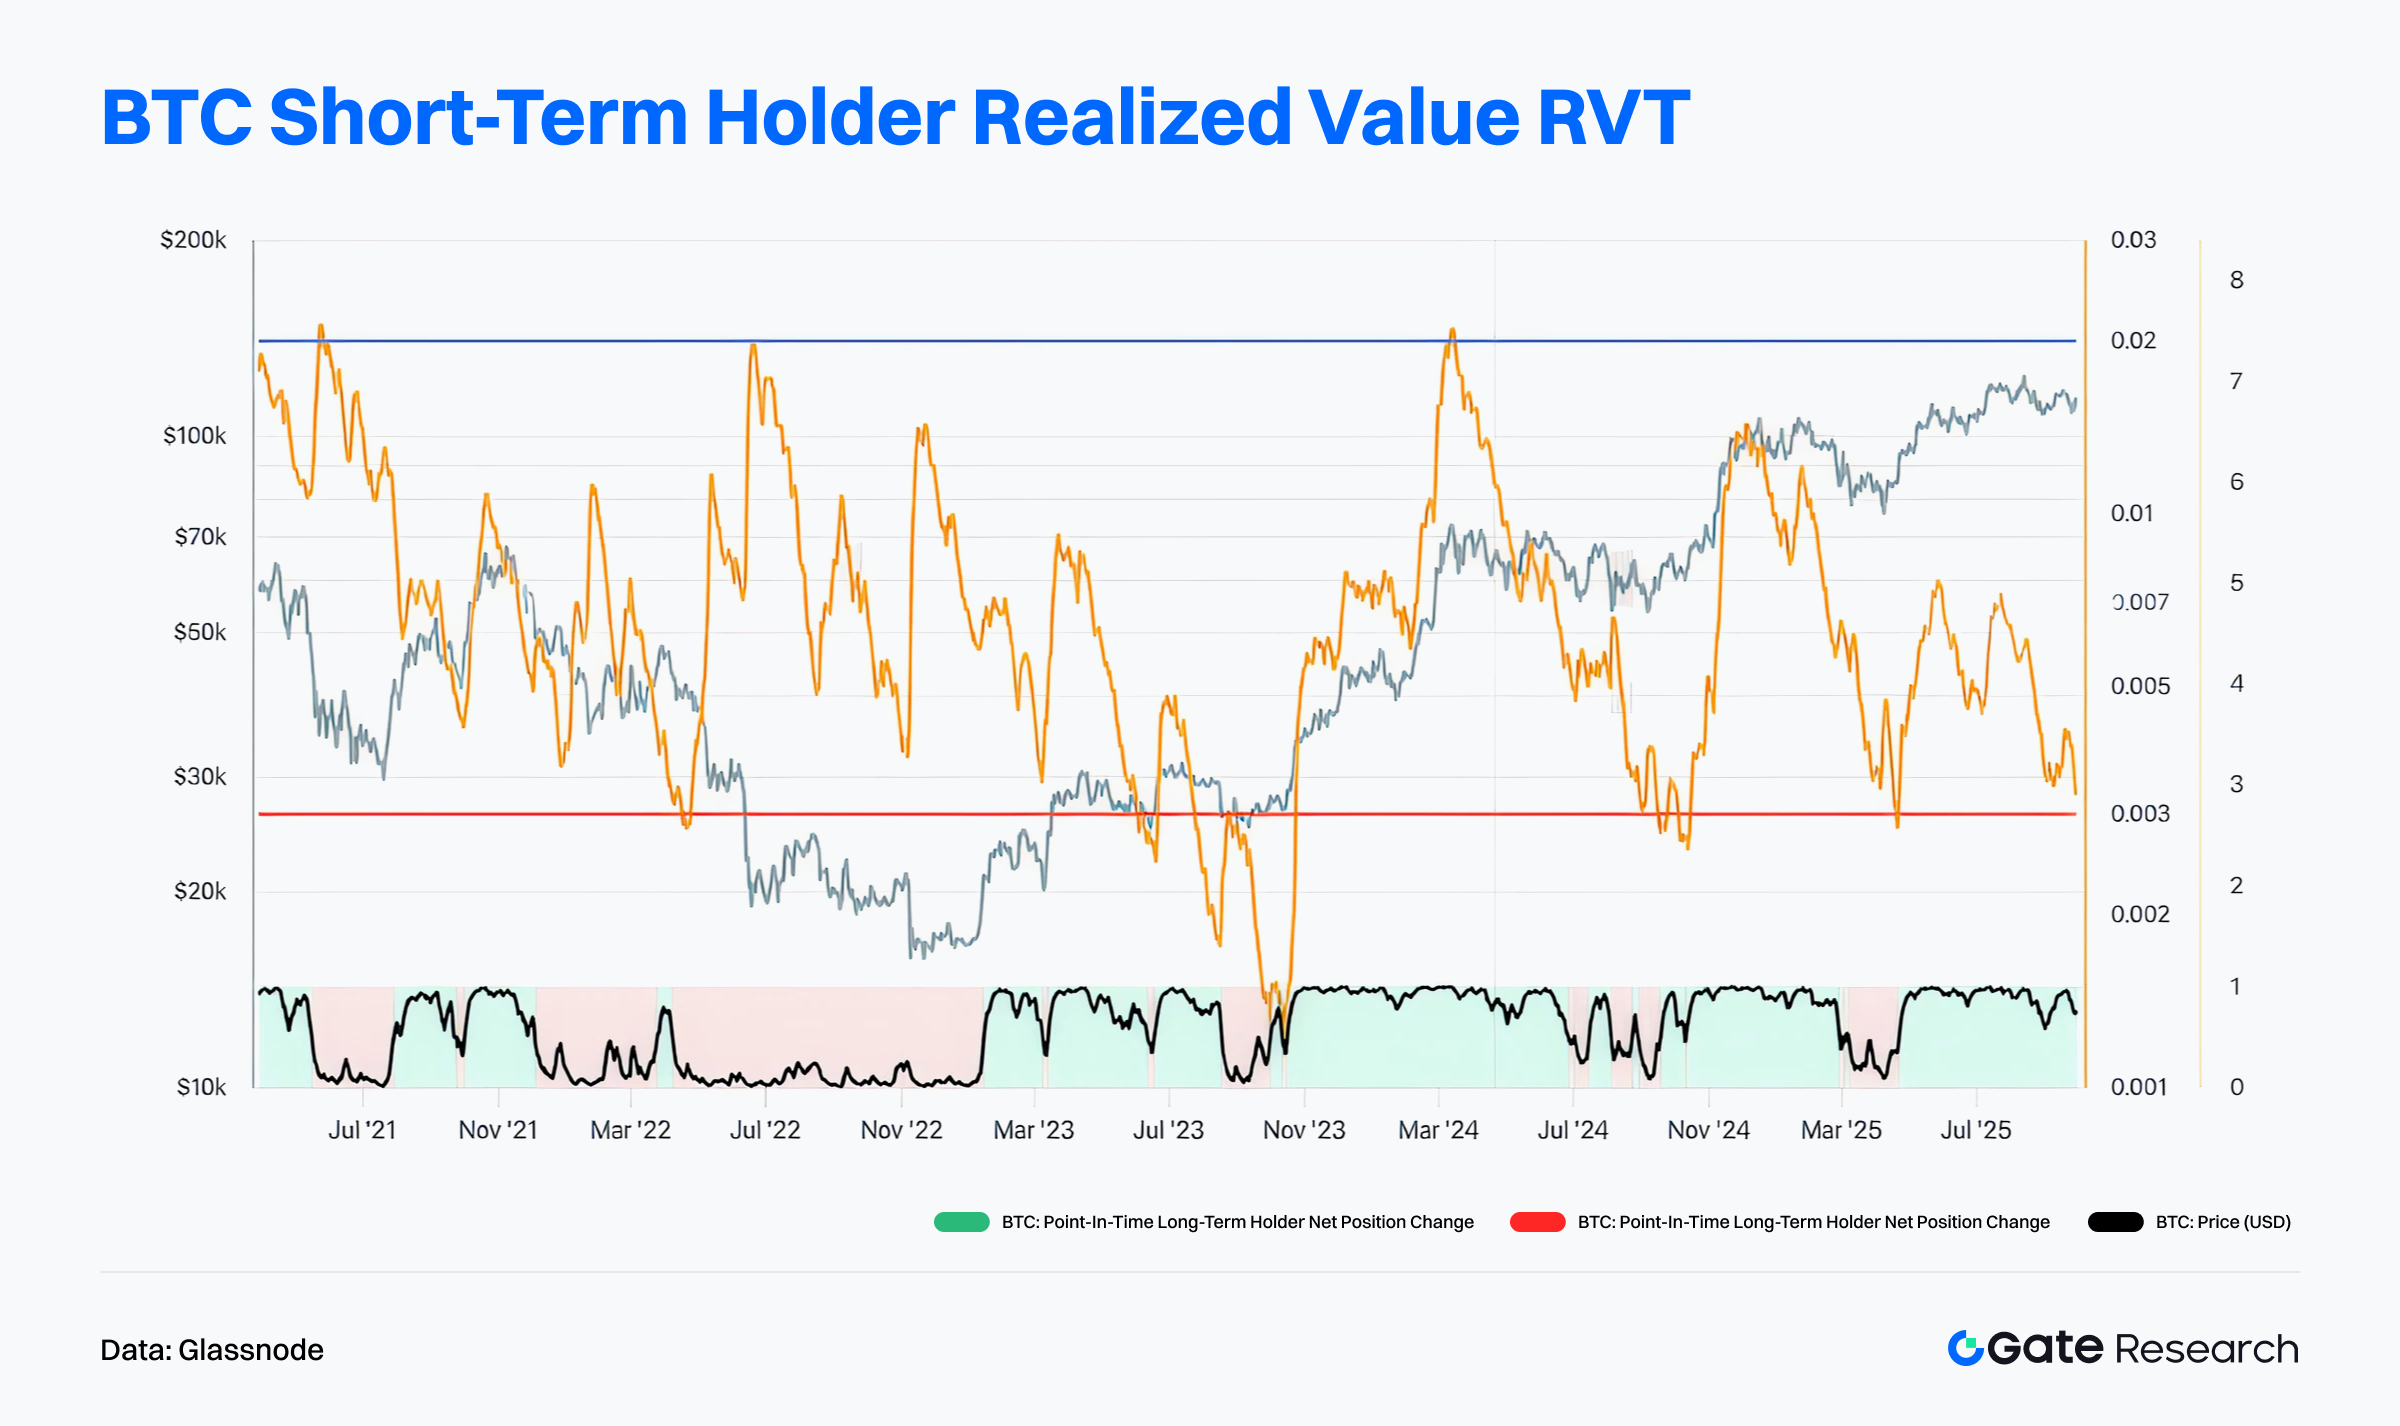
Data from Glassnode shows that the Short-Term Holder Realized Value Ratio (STH RVT) has continued to decline, approaching the 0.003 “market cooling threshold,” indicating that on-chain capital activity is at a very low level. A lower RVT value means transaction volume is small relative to realized market capitalization, implying a lack of new capital entering the market.【7】
Currently, RVT remains near historical lows, suggesting that trading enthusiasm has cooled significantly and short-term speculative participation is subdued. Although Bitcoin’s price has maintained an upward trend since late 2024, the persistently low RVT indicates that this rally lacks the on-chain activity support seen in the 2021 or early 2024 bull phases. Without improved liquidity and capital inflows, the price may struggle to break historical highs and could face structural cooling risks ahead.
Long-Term Holders Continue to Reduce Positions — Price Faces Pressure
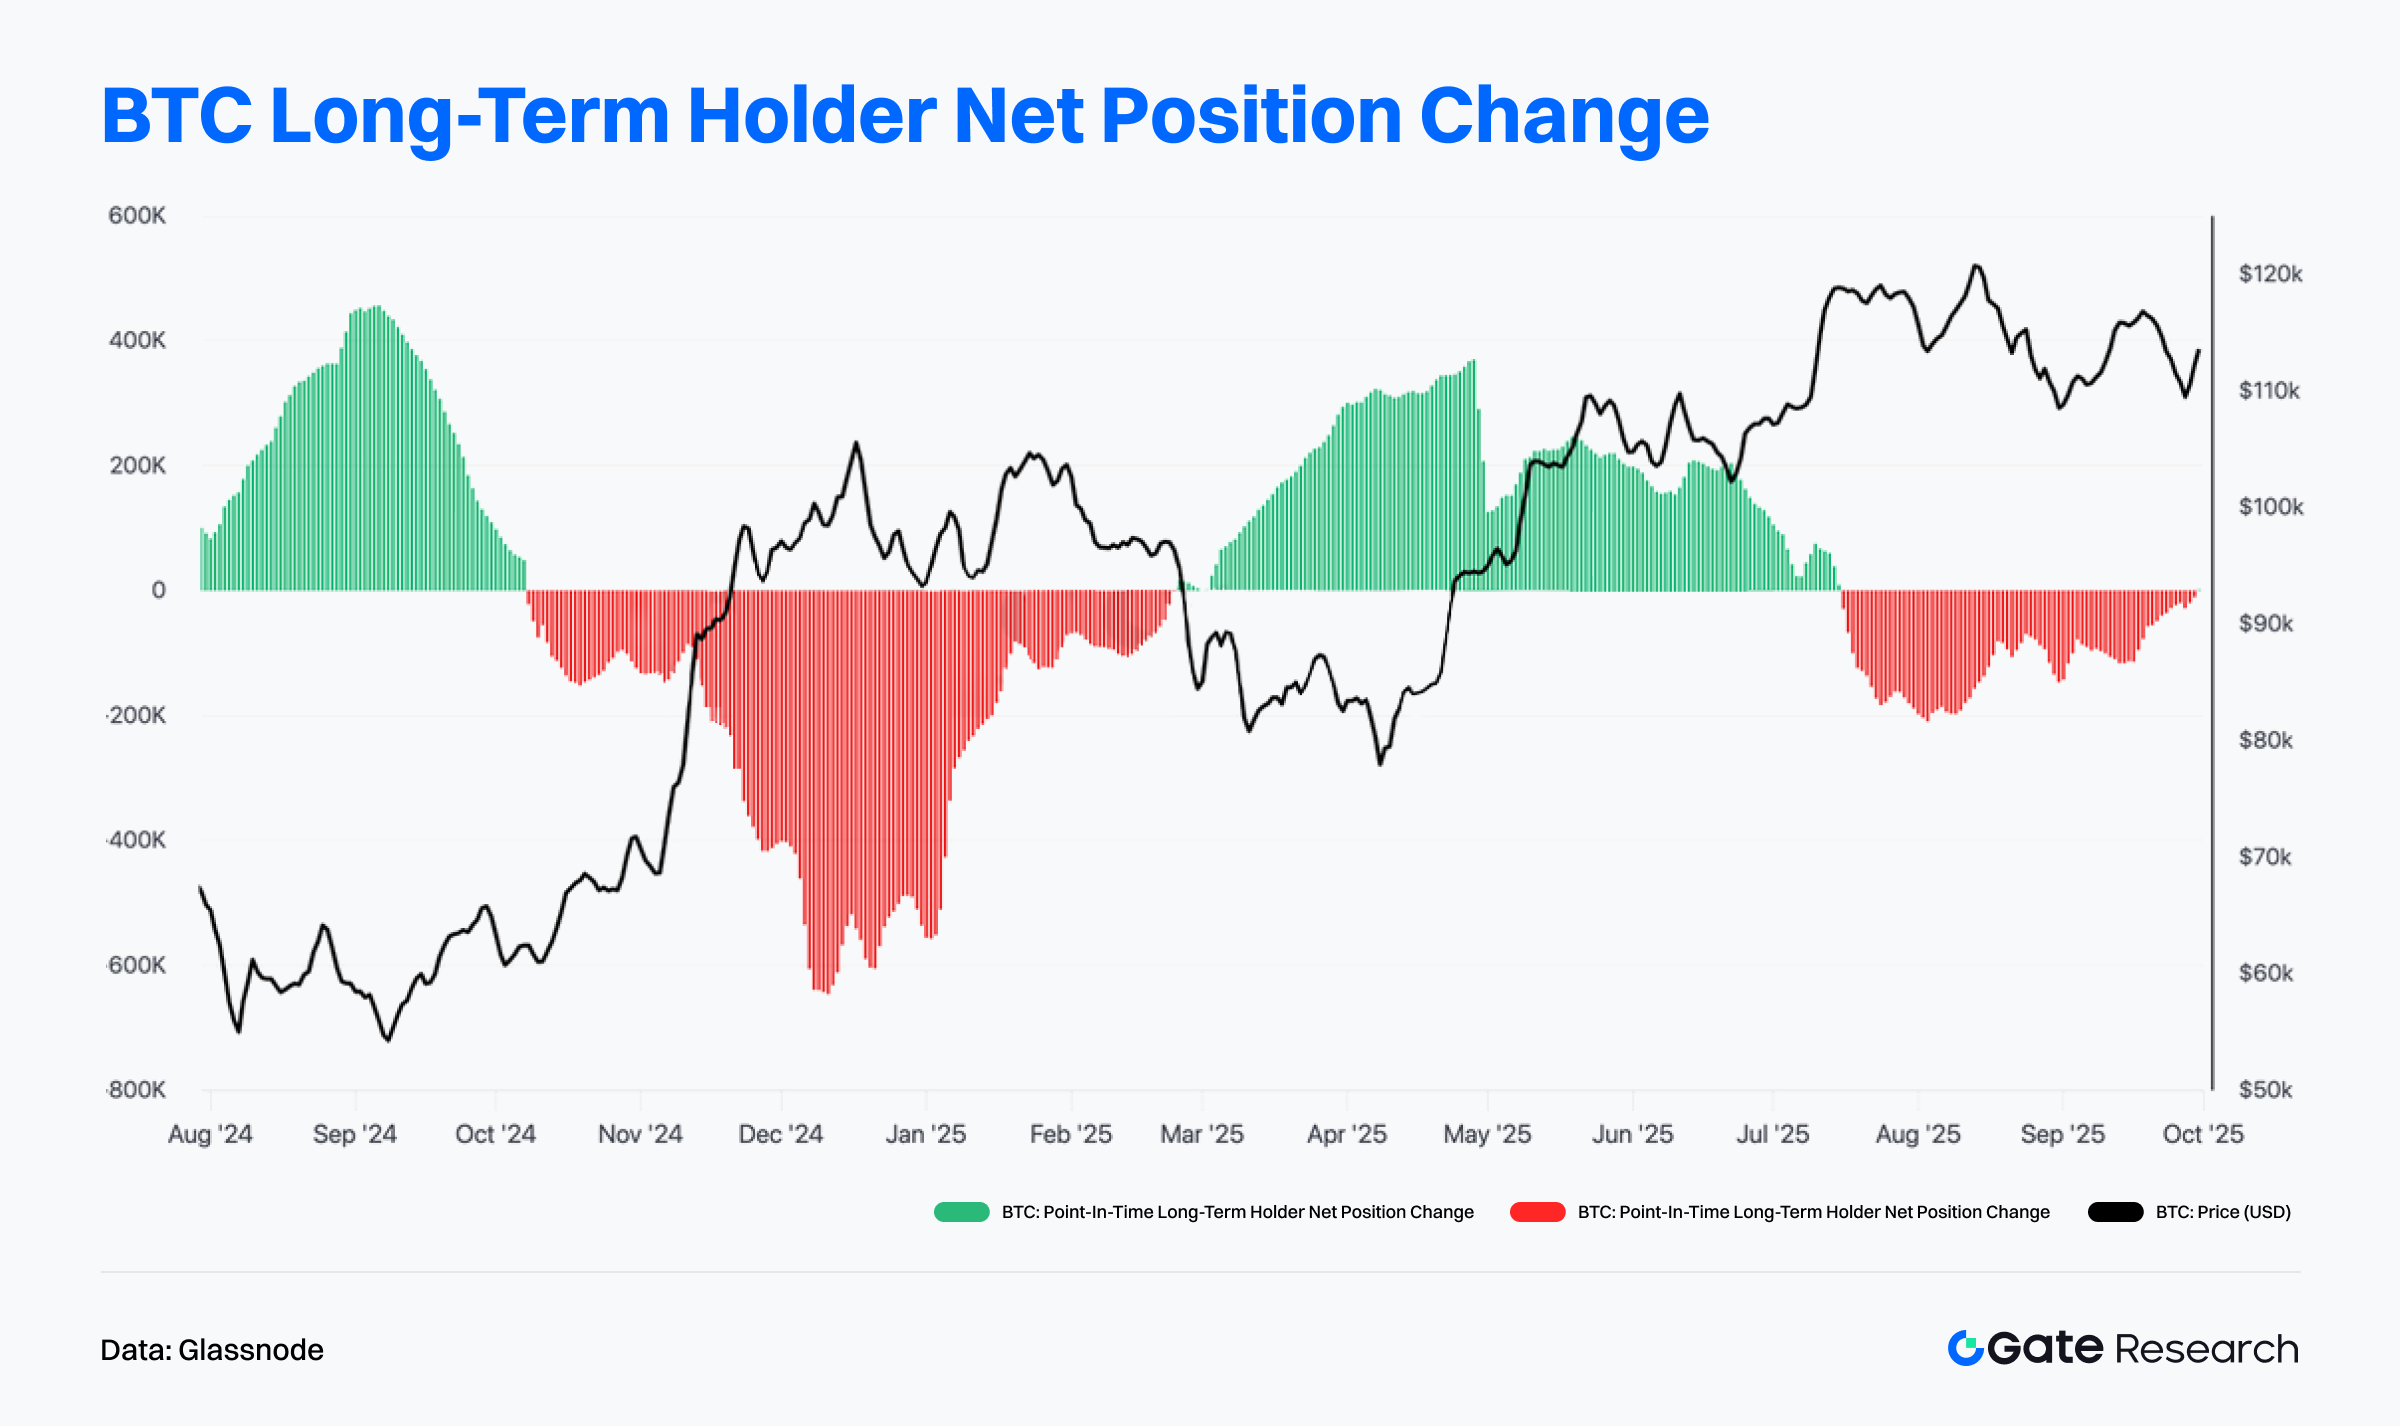
According to Glassnode, the Long-Term Holder Net Position Change has remained negative for several consecutive weeks, indicating that long-term holders have been reducing their balances, moving coins out of cold storage and possibly selling them. The red bars in the chart represent net outflows from long-term holders, with total outflows in the past two months estimated in the hundreds of thousands of BTC. This suggests that experienced investors are gradually taking profits or de-risking at elevated price levels.【8】
Such long-term holder distribution behavior is often associated with cyclical tops. When the price consolidates near highs while long-term holders continue to sell, supply–demand imbalances can develop, making further upside difficult. Although Bitcoin remains above USD 110,000, the absence of long-term capital support could limit momentum. Without renewed buying from new entrants, the price may face downward correction pressure, and investors should closely monitor long-term holder behavior as a key structural signal for the market’s next phase.
Trending Project & Token Activity
On-chain data indicates that capital and users are increasingly concentrating in ecosystems with solid interaction foundations and strong application depth. Meanwhile, projects with strong narratives and technological innovation are becoming the new focal points for investors. This section highlights the most prominent projects and tokens of recent weeks, analyzing the logic behind their growth and potential market impact.
Overview of Trending Projects
Plasma
Plasma is a blockchain project focused on stablecoin applications, featuring a low-entry, high-privacy, and high-throughput payment architecture designed to provide efficient and stable financial infrastructure for emerging markets. By integrating stablecoin issuance, lending modules, liquidity mining, and application distribution under one network, Plasma creates a unified stablecoin ecosystem. Its native token XPL serves as a governance, staking, and transaction-fee token, with user growth fueled by aggressive strategies such as airdrops, public sales, and credit-card cashback programs.
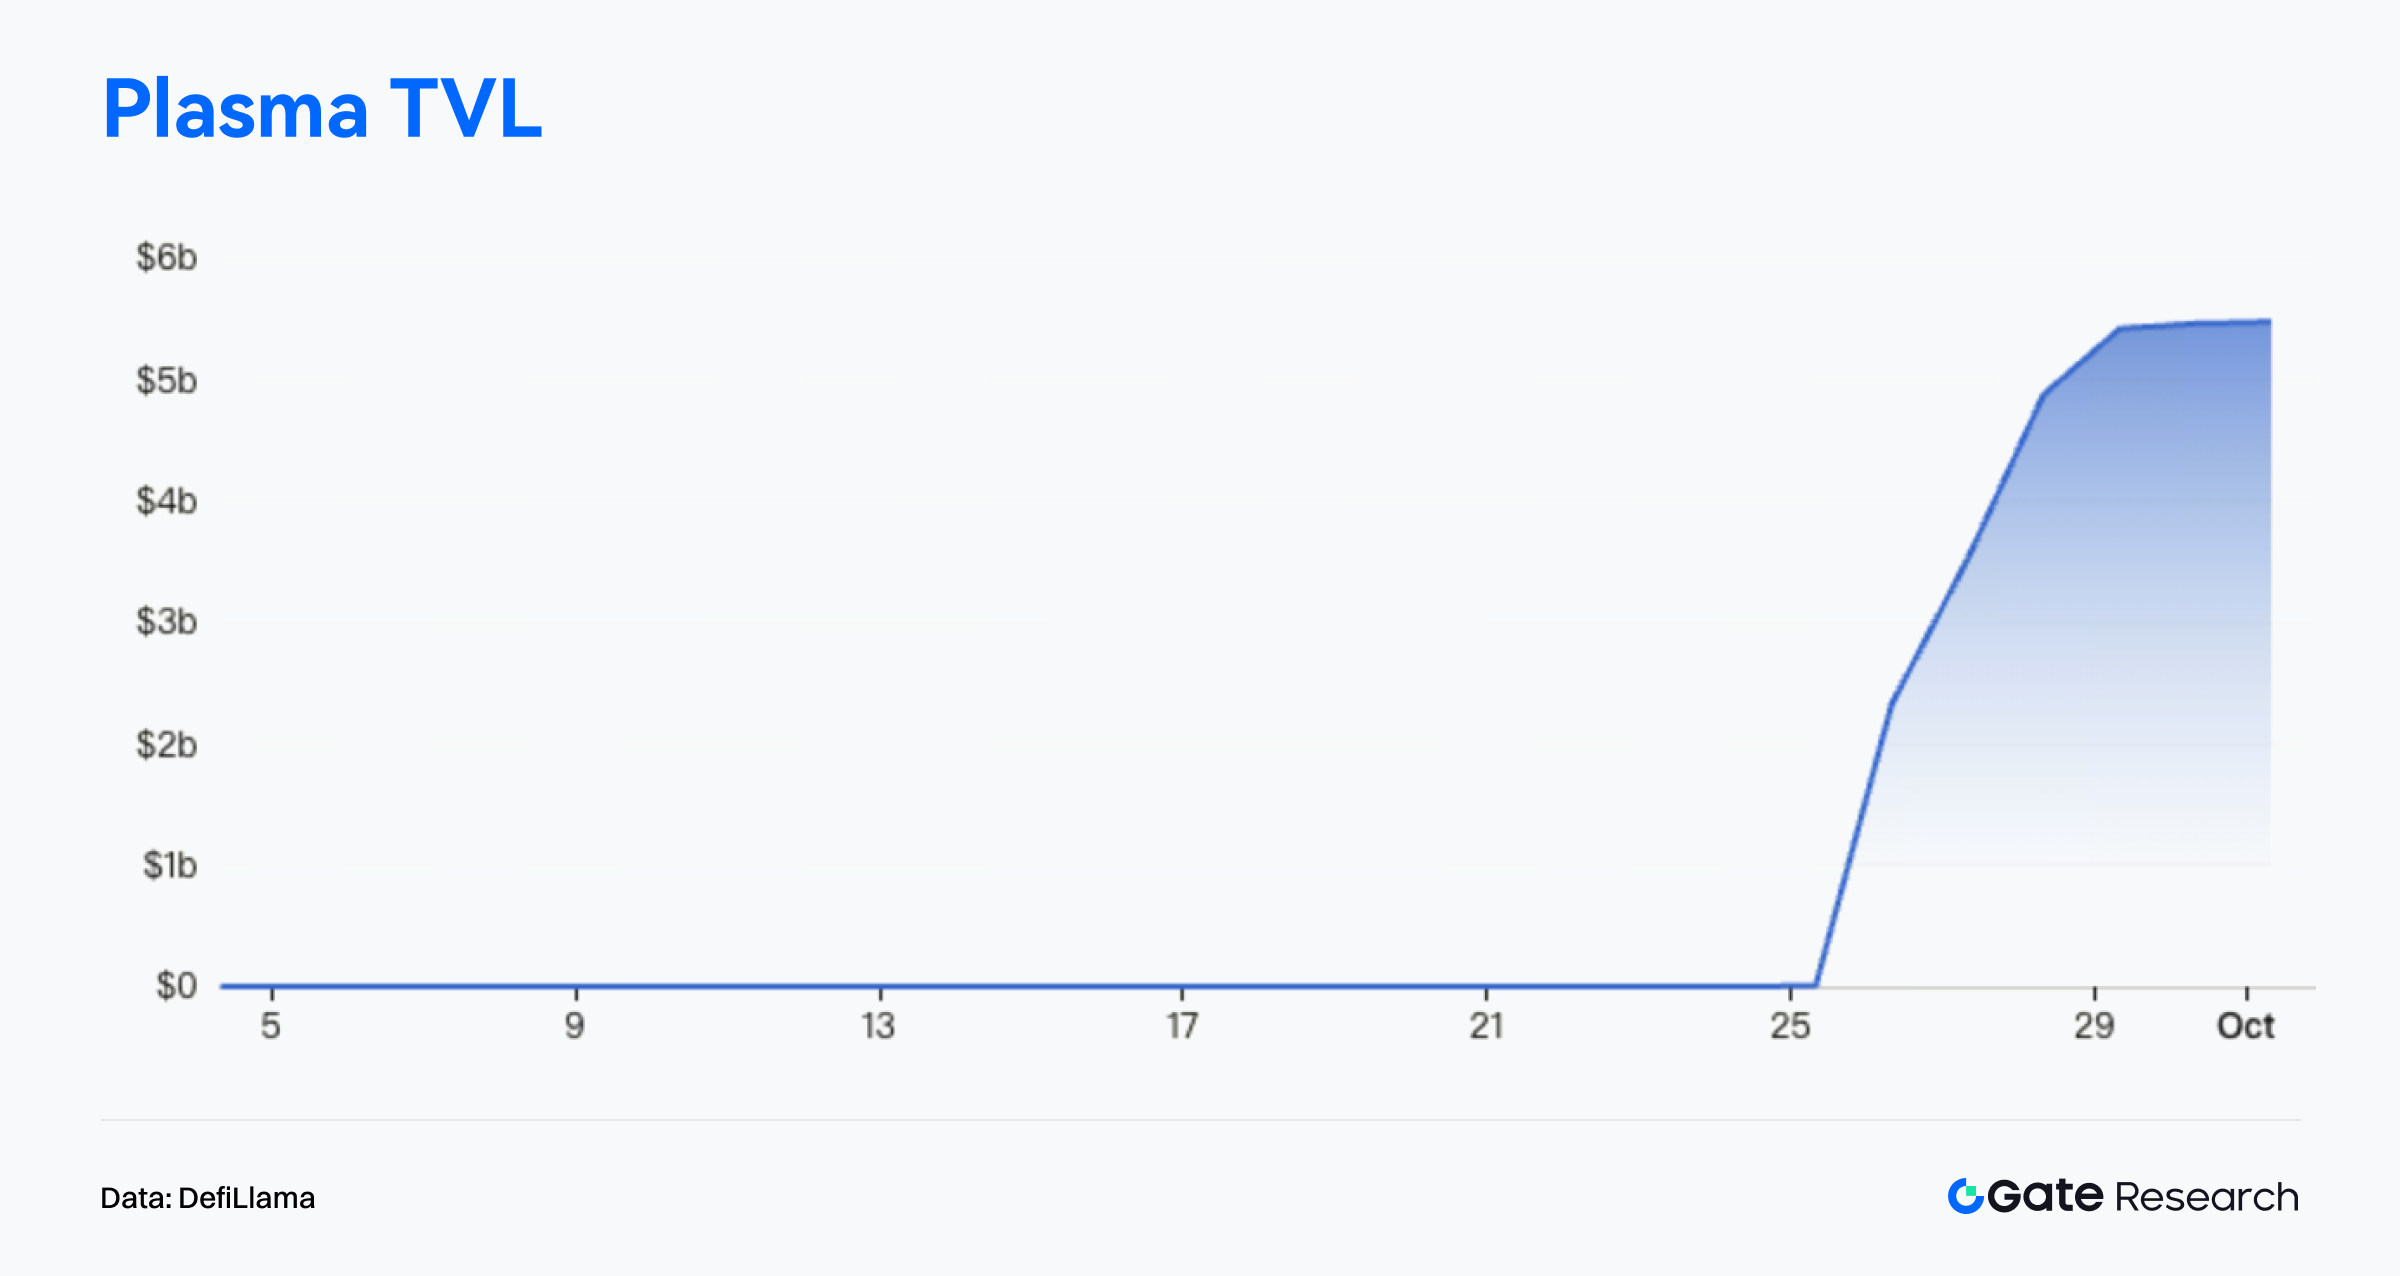
According to DefiLlama, within just days of mainnet launch, Plasma’s total value locked (TVL) surpassed USD 5.46 billion as of September 30, marking a weekly increase of over 40%, briefly overtaking Base. Stablecoin supply on-chain exceeded USD 7 billion within two days, showing strong capital-carrying capacity. The Lending Vault reached USD 1.4 billion in deposits with an annual yield near 40%. The ecosystem’s meme coin trillions saw its market cap surge 936% in a single day, topping USD 50 million, reflecting rapidly rising liquidity activity within the network. The XPL token peaked at USD 1.67, pushing its fully diluted valuation (FDV) above USD 14 billion.【9】
Plasma’s explosive growth stems not only from its technical performance but also its aggressive go-to-market strategy. Across multiple presale rounds before launch, the project attracted nearly USD 1.6 billion, with early whale investors achieving up to 19× returns. Every participant in the pre-deposit campaign received an additional airdrop, with individual rewards reaching up to USD 13,000. Its Launchpad raised USD 251 million in total, with an oversubscription rate of 23,847%, making it one of the most discussed launches of the month.
Strategically, Plasma focuses on emerging markets with active stablecoin usage, such as Southeast Asia and Turkey, and plans to release its prepaid credit card product Plasma One, offering cashback and on-chain yield distribution—directly competing with TRON’s stablecoin ecosystem. Plasma has partnered with over 100 DeFi projects, launched liquidity incentive programs, and maintains a treasury balance exceeding USD 1.5 billion. Overall, Plasma achieved a “launch-week grand slam,” rapidly driving user activity, liquidity inflows, and ecosystem participation. However, its long-term success will depend on sustaining user retention, ensuring real-world stablecoin adoption, and navigating compliance challenges in various jurisdictions.
Overview of Trending Token
$MYX
MYX is the native token of MYX Finance, a decentralized derivatives protocol focused on on-chain perpetual futures trading. The platform emphasizes permissionless access, zero slippage, and community-driven governance, aiming to redefine the on-chain trading experience. Through a unique mechanism design, MYX eliminates reliance on order books and intermediaries, enabling users to trade perpetual contracts efficiently at minimal cost. The MYX token powers governance, staking rewards, and fee distribution within the protocol.
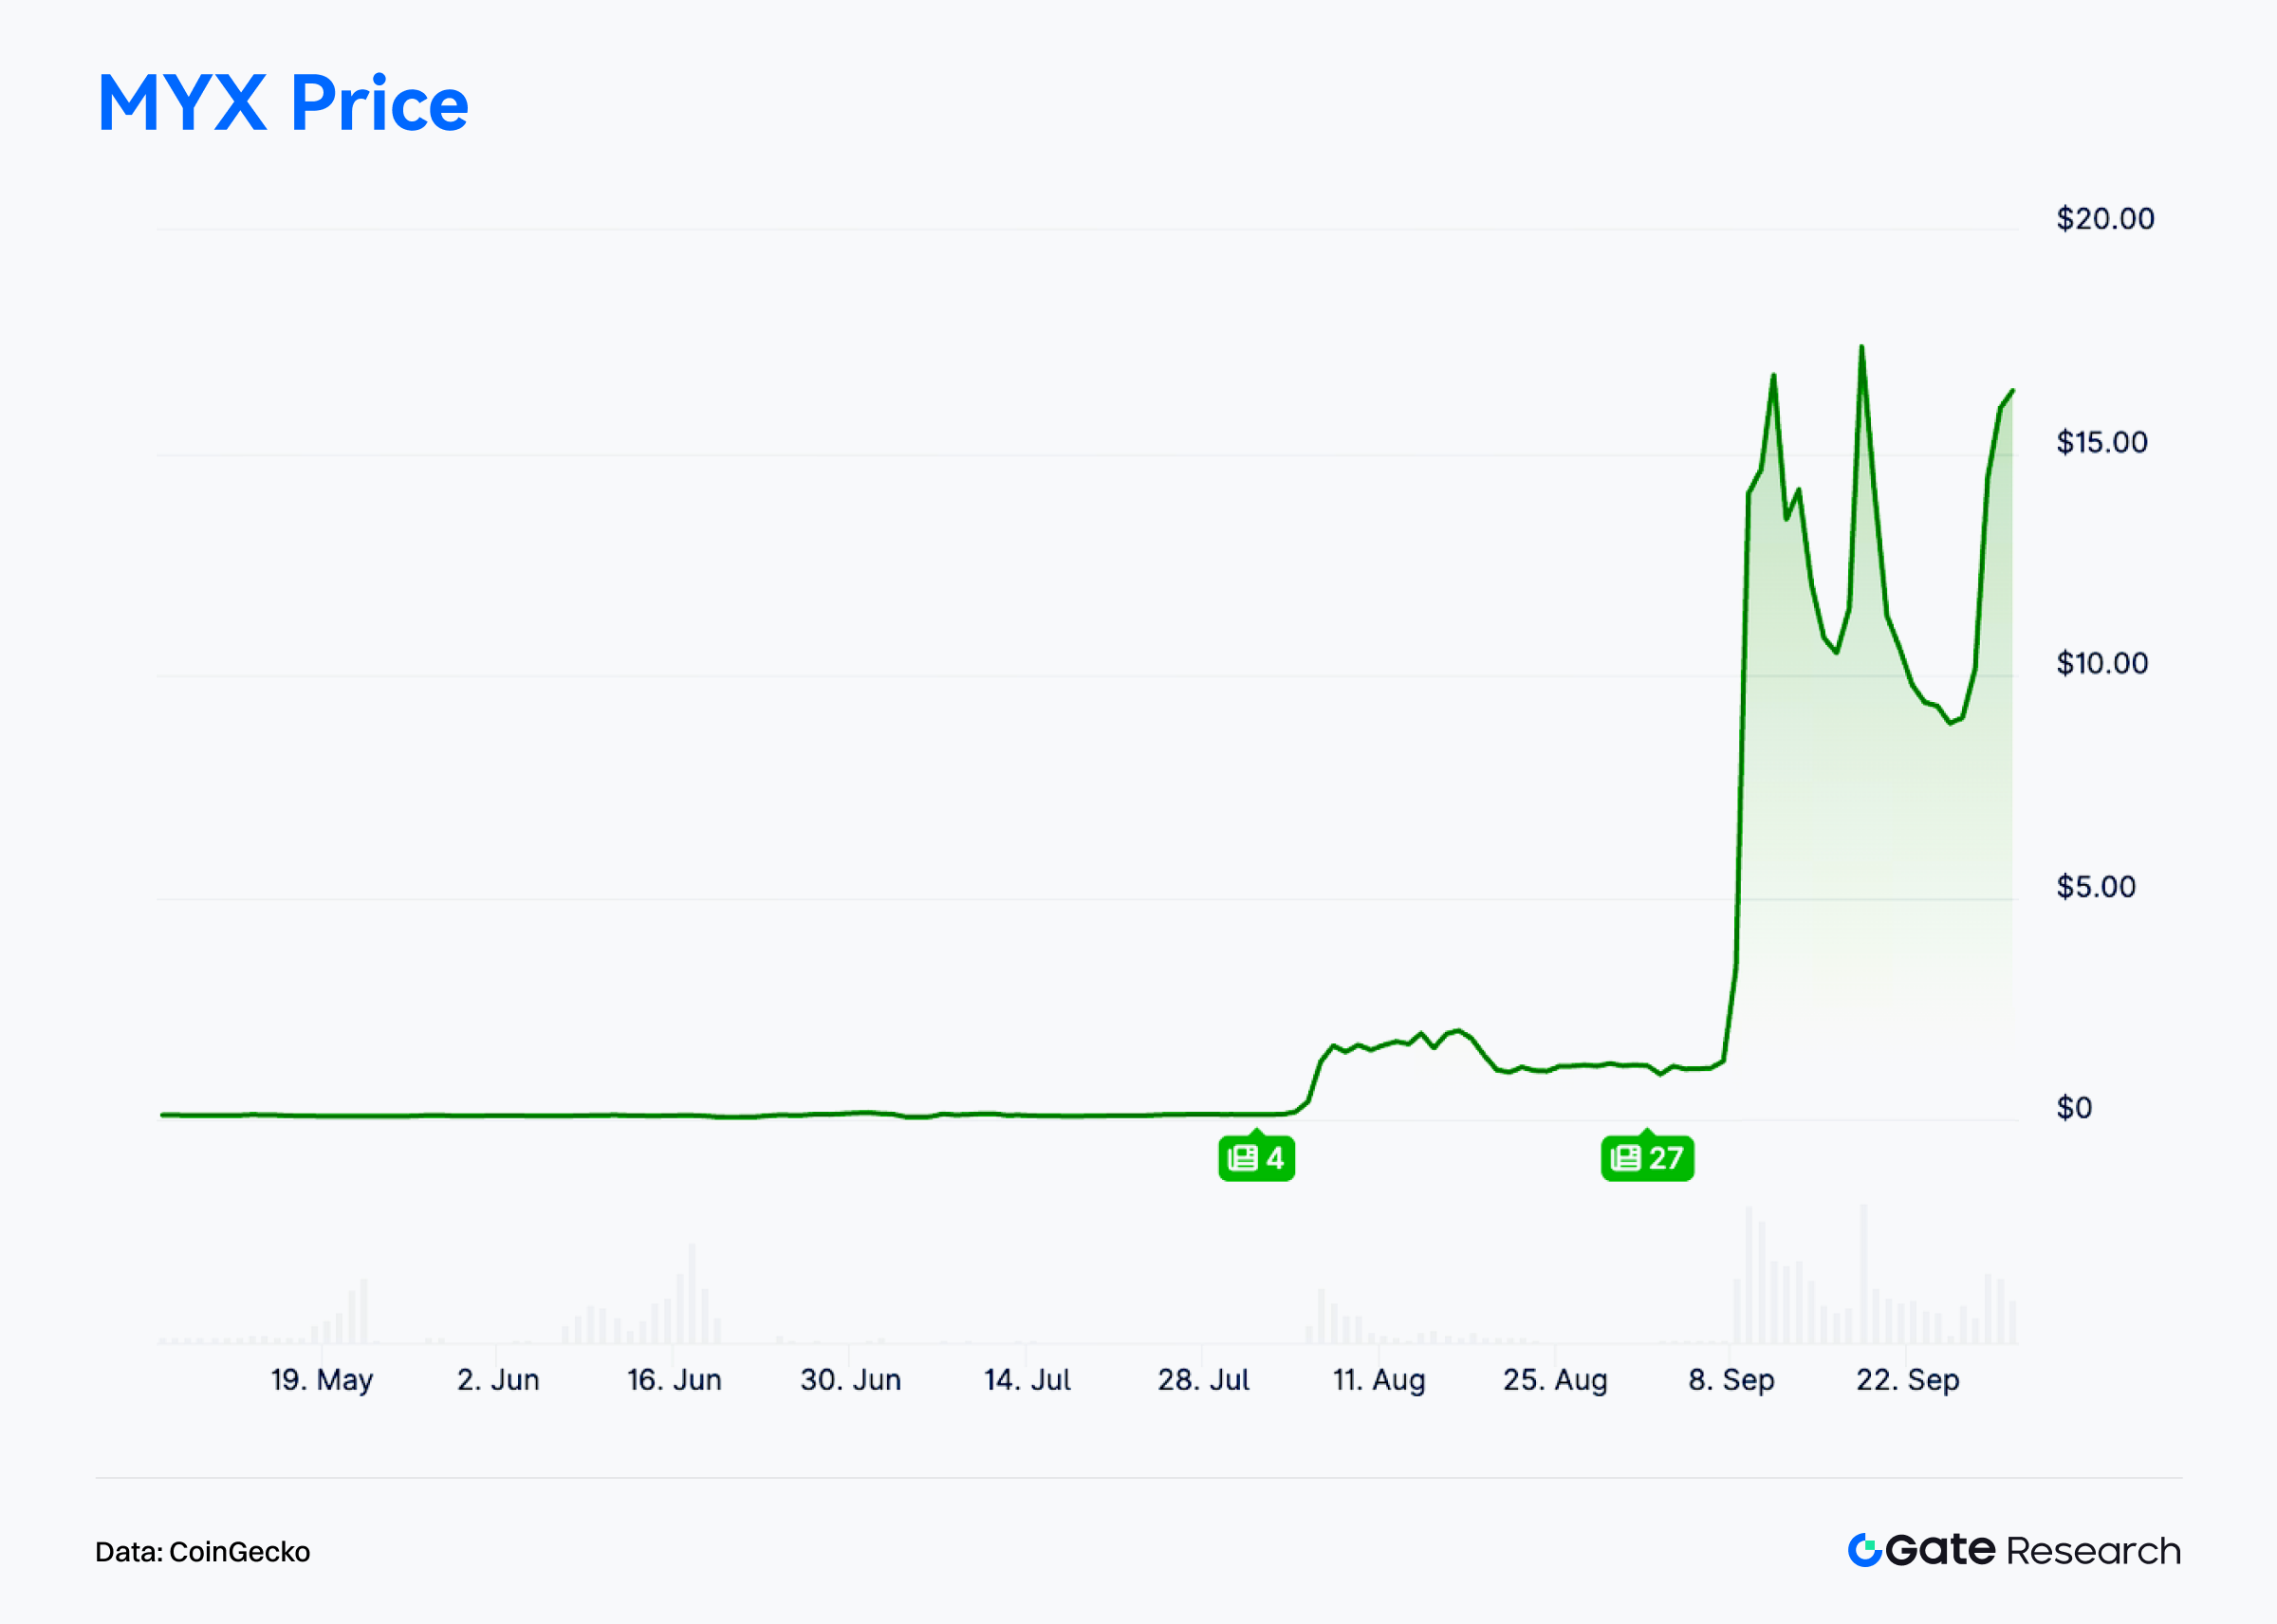
According to CoinGecko, MYX rose 63.25% in the week ending September 30, peaking at USD 16.40, significantly outperforming the broader market. The rally reflected a synergy between macro conditions and project fundamentals. On one hand, global liquidity recovery improved risk appetite, driving capital toward mid-cap altcoins like MYX, which offers high growth potential. On the other, MYX recently launched major protocol modules, rolled out a new liquidity incentive program, and announced partnership expansions, all of which accelerated user and capital inflows.【10】
Community engagement around MYX surged dramatically. On X, Telegram, and crypto forums, discussions about its trading mechanism, airdrop rumors, and roadmap updates spread rapidly. Some crypto influencers labeled MYX as the “dark horse of on-chain perpetuals,” suggesting it could become the next high-growth protocol. Screenshots of large on-chain transactions and wallet analyses circulated widely, amplifying FOMO sentiment and boosting participation. While debates over overvaluation emerged, they only heightened the token’s short-term momentum and visibility.
In summary, MYX Finance has quickly risen as a key player in decentralized derivatives through its mechanism innovation, trading efficiency, and user-centric experience. Supported by strong liquidity incentives, institutional attention, vibrant community engagement, and positive technical momentum, MYX shows strong short-term continuation potential. If liquidity inflows persist, it could become an essential infrastructure component of the on-chain derivatives ecosystem.
Conclusion
In September 2025, on-chain activity and capital distribution continued to diverge structurally. Solana, with 2.3 billion monthly transactions, maintained its dominance in high-frequency activity, while Base, up 26.6% in volume and surpassing 1 million active addresses, solidified its position as a key Layer2 network. Ethereum, despite slight declines in both transactions and active addresses, remained the top high-value chain, underscoring its entrenched role in DeFi and protocol-level interactions.
From a capital perspective, Arbitrum, driven by the DRIP incentive program, recorded over USD 500 million in net inflows, leading all chains in capital attraction as TVL and activity rebounded. In contrast, Ethereum and Base saw net outflows of USD 750 million and USD 600 million, respectively, reflecting liquidity repricing pressures under intensified incentive competition. Funds rotated swiftly toward emerging ecosystems offering higher yields or new incentive schemes.
For Bitcoin, on-chain metrics indicate a sideways consolidation phase—with weak short-term holder activity and continued long-term holder distribution—suggesting limited upside momentum. However, cost-basis zones provide technical support, indicating a corrective phase rather than a full trend reversal.
Among project highlights, Plasma emerged as the month’s breakout new chain, driven by its integrated stablecoin design and aggressive incentive strategy, reaching over USD 5.4 billion TVL and revitalizing ecosystem participation. MYX Finance, meanwhile, became the fastest-rising star in the derivatives sector, with its token up 63.25% in a week amid growing community hype and institutional engagement.
Overall, capital and users are accelerating toward ecosystems with strong activity, high throughput, and compelling narratives, reinforcing the trend of structural divergence across the on-chain landscape.
References:
- Artemis, https://app.artemisanalytics.com/chains
- Artemis, https://app.artemisanalytics.com/chains
- Artemis, https://app.artemisanalytics.com/chains
- Artemis, https://app.artemisanalytics.com/flows
- DefiLlama, https://defillama.com/chain/arbitrum
- Glassnode, https://studio.glassnode.com/charts/indicators.CostBasisDistributionHeatmap?a=BTC&mScl=lin&period=1y&s=1727838936&u=1759374936&zoom=365
- Glassnode, https://studio.glassnode.com/charts/btc-sth-realized-rvt-ratio?a=BTC&s=1398402256&u=1759190400&zoom=
- Glassnode, https://studio.glassnode.com/charts/supply.LthNetChangePit?a=BTC&c=native&ema=0&mAvg=3&mMedian=0&mScl=lin&pScl=lin&period=1y&resolution=24h&s=1722384000&u=1759276800&zoom=
- DefiLlama, https://defillama.com/chain/plasma
- CoinGecko, https://www.coingecko.com/en/coins/myx-finance
Gate Research is a comprehensive blockchain and cryptocurrency research platform that provides deep content for readers, including technical analysis, market insights, industry research, trend forecasting, and macroeconomic policy analysis.
Disclaimer
Investing in cryptocurrency markets involves high risk. Users are advised to conduct their own research and fully understand the nature of the assets and products before making any investment decisions. Gate is not responsible for any losses or damages arising from such decisions.
Related Articles

Reflections on Ethereum Governance Following the 3074 Saga

Gate Research: 2024 Cryptocurrency Market Review and 2025 Trend Forecast

Gate Research: BTC Breaks $100K Milestone, November Crypto Trading Volume Exceeds $10 Trillion For First Time

NFTs and Memecoins in Last vs Current Bull Markets

Gate Research-A Study on the Correlation Between Memecoin and Bitcoin Prices
