XAU/USD: Gold Holds Above $4,040, Strengthening Its Upside Potential
Latest Price Review and Market Performance
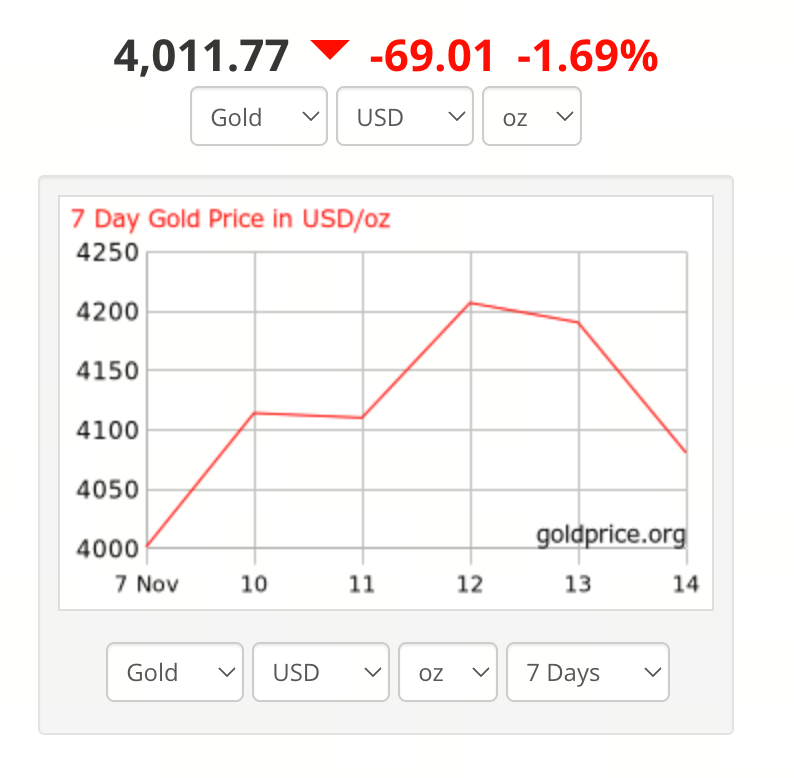
Chart: https://goldprice.org/
Recent data shows gold (XAU/USD) trading between approximately $4,017 and $4,033 per ounce. Gold previously surged near $4,250 before pulling back, and the market is now testing support around the $4,040 level. While there has not been a sharp rally—such as a “2% breakout”—the asset’s ability to hold near its highs signals continued market preference for gold.
Analysis of Key Market Drivers
This gold market movement is shaped by several critical factors:
- Federal Reserve Rate Expectations: Markets remain divided on whether the Fed will cut rates or keep them elevated by year-end. Diminished expectations for rate cuts, or hawkish signals from the Fed, can cap gold’s upside. For instance, analysis indicates that “rate cut expectations fell from roughly 60% to about 45%,” putting downward pressure on gold.
- Dollar Strength and Treasury Yields: A rising US Dollar Index and higher Treasury yields increase the opportunity cost of holding non-yielding assets like gold, reducing its appeal.
- Safe-Haven and Geopolitical Considerations: Despite the absence of major shock events recently, ongoing global economic uncertainty has kept gold’s safe-haven status in focus.
- Support and Pullback Trends: After surging toward the $4,250 range, gold pulled back and entered a consolidation phase. Market participants are watching closely to see if the upward trend will resume.
Technical Analysis: $4,040 as Key Support
Technical charts highlight the $4,040 area as a crucial support level for gold. If prices hold above this level, it could set the stage for further gains; if support fails, gold may fall toward $4,000 or even $3,950. Chart patterns show gold has pulled back from its peak but have yet to signal a clear breakdown, suggesting the market remains in a consolidation phase with a bullish bias.
Investor Strategies: Opportunities and Risks
Opportunities: If you expect the Fed to ease policy, the dollar to weaken, or global risk aversion to rise, gold’s current levels may present a compelling buying opportunity. Consolidation above $4,040 and the formation of a new bullish channel could offer attractive entry points for medium-term positioning.
Risks: On the other hand, robust US economic data, rising inflation, or signals of prolonged high rates from the Fed could trigger a correction in gold. If technical support fails, investors may accelerate selling. Investors should manage position sizes, use stop-losses, and avoid concentrated positions.
Recommended Strategies:
- View gold as a hedge or safe-haven asset within a diversified portfolio, rather than as a standalone investment.
- Monitor upcoming US employment figures, inflation data, and Fed communications—these are key catalysts for gold’s movement.
- If adopting a long position, set conservative targets in the $4,150–$4,200 range and prepare for potential pullbacks to the $4,000–$3,950 area.
Summary and Mid-Term Outlook
Overall, XAU/USD remains stable around $4,040 per ounce. While it has not yet experienced a decisive breakout, holding above key support levels highlights sustained investor interest. In the future, continued dollar weakness and a shift in Fed policy could allow gold to retest higher levels. Conversely, a reversal in policy or economic expectations could heighten downside risks. Investors should stay alert to macroeconomic data and maintain awareness of support areas. Adjust strategies to align with risk preferences.
Share
Content


Related Articles

Pi Coin Transaction Guide: How to Transfer to Gate.io

Flare Crypto Explained: What Is Flare Network and Why It Matters in 2025

How to Use a Crypto Whale Tracker: Top Tool Recommendation for 2025 to Follow Whale Moves

What is N2: An AI-Driven Layer 2 Solution

2025 BTC Price Prediction: BTC Trend Forecast Based on Technical and Macroeconomic Data