Under the spin-off framework outlined in the SanDisk (SNDK) article, Western Digital spun off its Flash business in 2025, making SNDK and WDC two independent public companies. Comparing them on a pre-spin-off consolidated basis would conflate the HDD cycle with the NAND cycle.
What Is SNDK?
SanDisk Corporation is a NAND Flash and solid-state storage (SSD) U.S. stock listed on Nasdaq under the ticker SNDK. In February 2025, SanDisk was spun off from Western Digital and completed its independent listing. SNDK stock inherited the flash memory and SSD business from Western Digital, with its business scope defined as a pure Flash storage chain.
SNDK's revenue structure is primarily composed of NAND wafer manufacturing, enterprise and client SSDs, embedded flash, and automotive solutions. The SNDK Business Structure and Product Matrix breaks down product line layouts by enterprise, client, mobile, and automotive scenarios. SNDK's financial performance more directly reflects NAND average selling prices, SSD shipment structure, and flash capital expenditure pace—metrics that must be read separately from WDC's HDD figures.
In the storage stock classification, SNDK and Micron are comparable at the NAND level, but comparability with WDC stems more from their shared spin-off origin than from similar businesses. When searching financial reports or Gate Stocks pages, use SNDK as the entry point to avoid confusion with WDC's historical consolidated data.
What Is WDC?
Western Digital Corporation is a hard disk drive (HDD) storage U.S. stock listed on Nasdaq under the ticker WDC. After the SanDisk spin-off, WDC retains the HDD business and no longer directly operates NAND Flash and SSD product lines, with its business scope defined as pure HDD capacity-oriented storage.
WDC's core products target cloud data centers, enterprise archives, and consumer external storage. Revenue drivers include HDD shipments, cloud customer procurement, cost per unit of capacity, and hard drive price cycles. After the spin-off, WDC's direct exposure to NAND spot prices has decreased. The SanDisk Spin-off and WDC/SNDK Relationship article outlines the spin-off timeline and ticker identification points.
Within the HDD track, WDC is often compared alongside Seagate (STX). The WDC vs Seagate vs Micron Storage Stock Classification explains the layered logic of HDD, NAND, and DRAM from a broader storage industry perspective. When researching WDC stock, the analysis framework should align with capacity-oriented storage companies, not flash or memory manufacturers.
What Is Micron?
Micron Technology, Inc. is a semiconductor memory U.S. stock listed on Nasdaq under the ticker MU, covering both DRAM dynamic random access memory and NAND flash memory, with its business scope defined as dual-category memory manufacturing of DRAM+NAND.
Micron's products go into downstream sectors such as servers, PCs, smartphones, and AI infrastructure, with revenue affected by both memory and flash price cycles. DRAM focuses on high-speed temporary data processing, while NAND focuses on non-volatile solid-state storage. HBM and other AI-related memory demands also impact its product portfolio. Compared to SNDK, Micron overlaps at the NAND level, but the DRAM business introduces an additional cycle dimension, so the two cannot be considered the same purity of exposure. Micron and WDC belong to silicon-based memory and mechanical hard drive chains respectively; applying cycle logic across chains is a classification mismatch.
Key Differences at a Glance
SNDK, WDC, and Micron can be compared side by side across four dimensions: technology route, business purity, key cycle variables, and comparable peers. The table below summarizes structural differences with the aim of establishing classification boundaries, without ranking any of the stocks.
| Comparison Dimension |
SNDK (SanDisk) |
WDC (Western Digital) |
Micron (MU) |
| Stock Ticker |
SNDK |
WDC |
MU |
| Core Technology |
NAND Flash, SSD |
HDD |
DRAM, NAND |
| Business Purity |
Pure Flash |
Pure HDD (post-spin-off) |
Dual Category: DRAM + NAND |
| Key Downstream Markets |
Cloud SSDs, Client SSDs, Embedded, Automotive |
Cloud Archives, Enterprise Storage, Consumer HDDs |
Servers, PCs, Mobile, AI Memory |
| Key Cycle Variables |
NAND Price, SSD Demand, Flash Capex |
HDD Shipments, Cloud Capacity Demand, Cost per Unit Capacity |
DRAM Price, NAND Price, HBM Demand |
| Relationship to Spin-off |
Independent from WDC in 2025 |
Retained HDD after spin-off |
Independent entity, no spin-off ties |
| Common Comparable Peers |
Micron (at NAND level), Samsung, SK Hynix |
Seagate (STX) |
Samsung, SK Hynix, SNDK (at NAND level) |
The table shows that all three qualify as "storage stocks" only at the broad data storage chain level. Although SNDK and WDC share a common origin from the spin-off, their technology routes are completely separated. SNDK and Micron overlap on NAND, but Micron's DRAM exposure makes the cycle structure more complex. WDC and Micron have the least comparability; one must first distinguish between HDD and silicon-based memory.
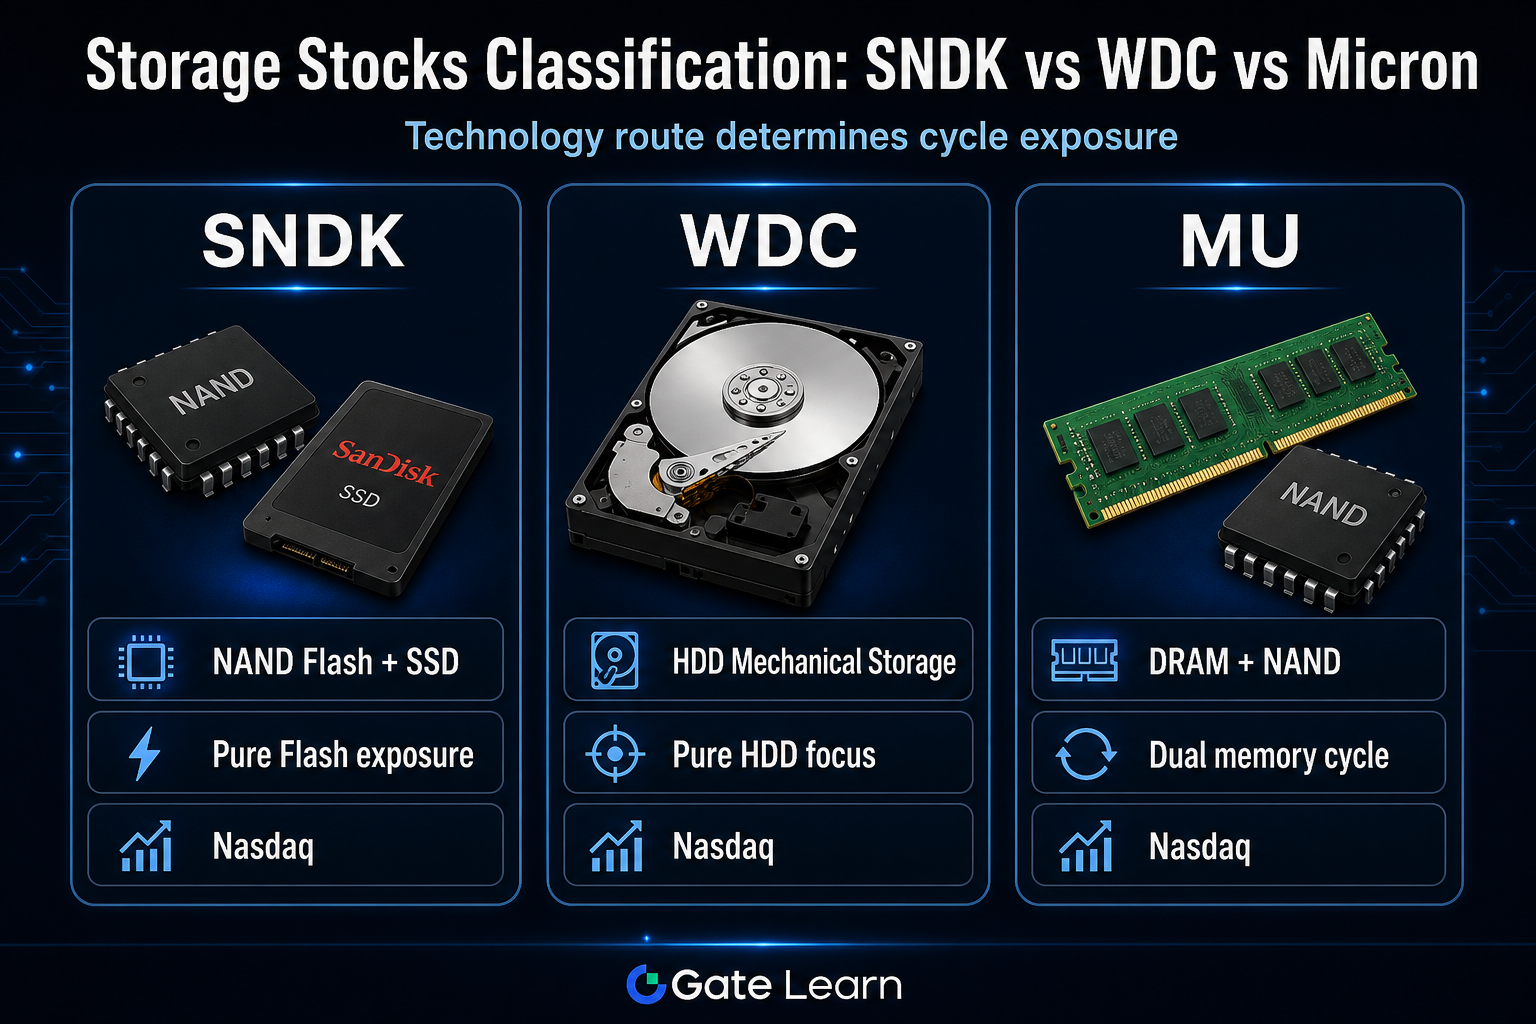 Figure 1. Technology route comparison of SNDK, WDC, and Micron storage stocks: Pure Flash, Pure HDD, and Dual Category DRAM+NAND.
Which Analysis Path to Choose?
The first step in choosing an analysis path is to clarify which technology chain and which type of cycle variable your research goal corresponds to. Different goals should be matched with different stocks and indicator combinations, rather than making a general ranking among the three.
Path One: Track NAND/SSD and Flash Capex
Applicable to SNDK and the NAND-related business metrics within Micron. Focus on NAND average selling price, enterprise and client SSD shipments, capacity utilization, and flash capex. The SNDK Key Metrics and Risk Checklist organizes metrics such as gross margin, inventory turnover, and capacity utilization into a verifiable observation framework. In this path, WDC's HDD indicators are not directly comparable.
Path Two: Track HDD Capacity Storage and Cloud Archive Demand
Applicable to WDC and Seagate (STX) in the HDD track. Focus on HDD shipments, average capacity, cost per unit capacity, cloud customer orders, and gross margin. In this path, SNDK's NAND pricing and Micron's DRAM cycle should not be mixed into WDC analysis.
Path Three: Track the Dual Memory and Flash Cycle
Applicable to Micron. Must simultaneously observe DRAM and NAND prices, inventory, and downstream demand, and distinguish the impact of HBM on revenue structure. SNDK can be used only as a reference in the NAND sub-dimension.
| Research Goal |
Priority Stock |
Suggested Indicators |
| Flash Price and SSD Shipments |
SNDK |
NAND ASP, SSD Structure, Flash Capex |
| Cloud Capacity and Archive Storage |
WDC |
HDD Shipments, Average Capacity, Cloud Customer Procurement |
| Dual Memory + Flash Cycle |
Micron |
DRAM/NAND Price, HBM Proportion, Inventory |
| Post-Spin-off Ticker Identification |
SNDK and WDC (separately) |
Company Entity, Financial Reporting Scope, Trading Ticker |
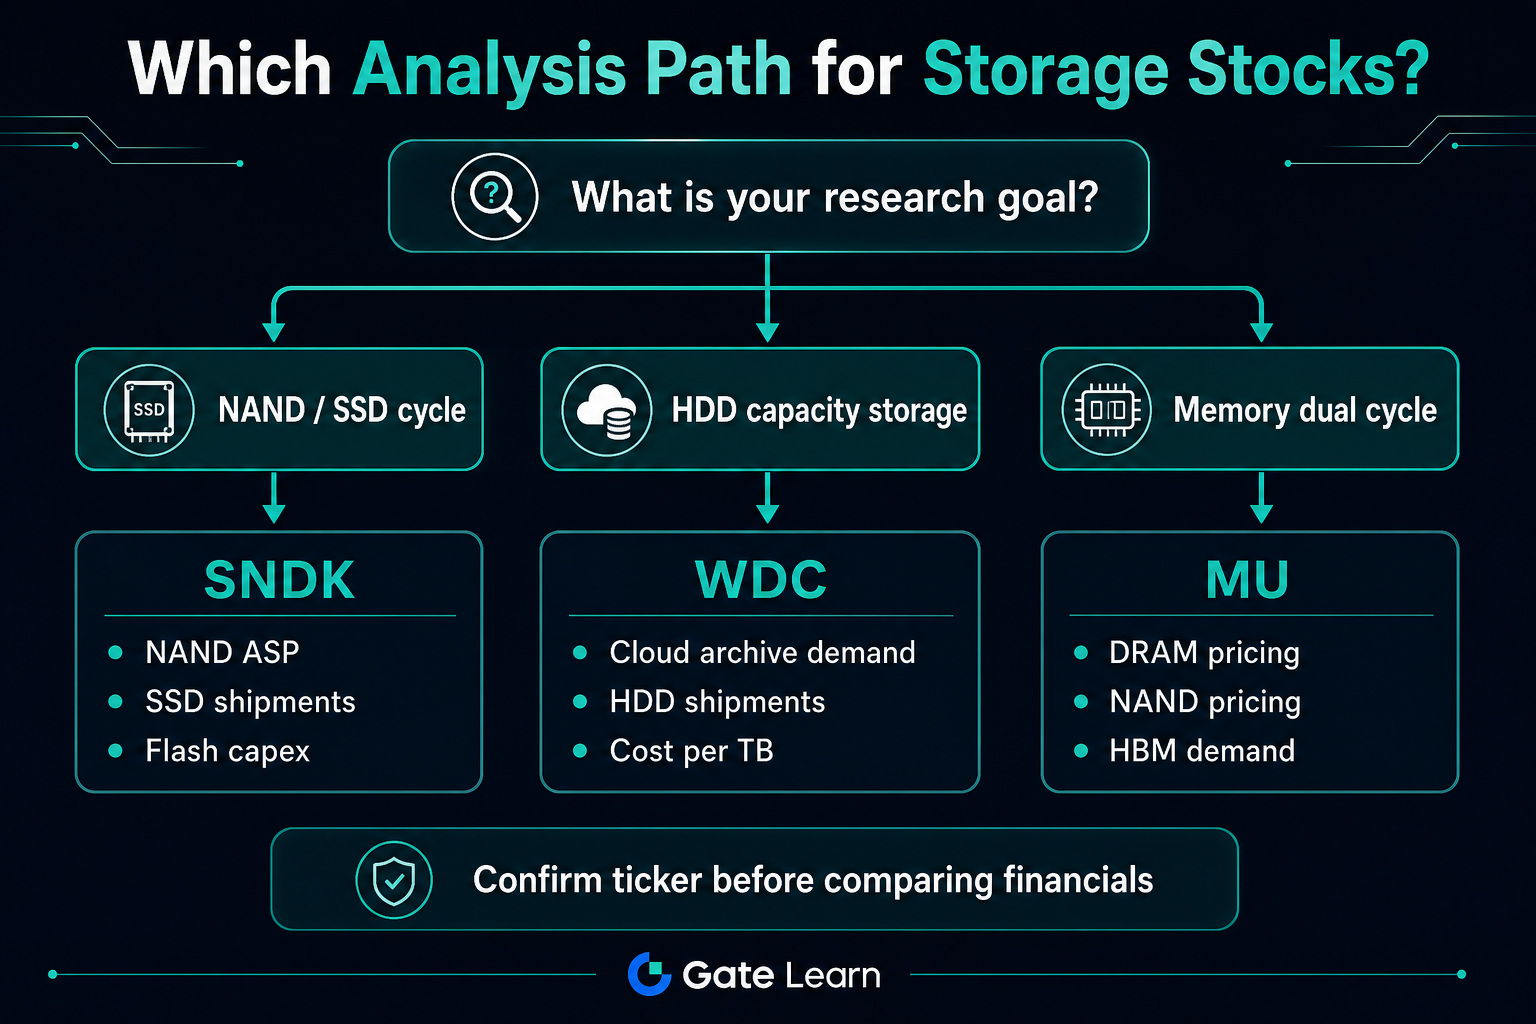 Figure 2. Storage stock analysis path selection: Match SNDK, WDC, or Micron and corresponding cycle indicators by research goal.
When searching on Gate Stocks, use the three tickers SNDK, WDC, and MU to confirm the subject of the trading page, then place the corresponding company back into the path selected in the table above. Ticker confusion is the most common identification error in storage stock comparisons.
What Are the Limitations of Comparison?
Horizontal comparisons among SNDK, WDC, and Micron have structural limitations that must be understood before reading comparative conclusions.
Technology Heterogeneity Limits Direct Financial Comparison
HDD and NAND/DRAM have different cost curves, gross margins, and customer structures. Placing the revenue growth or profit margins of the three in parallel without noting technical differences can easily lead to misinterpreting industry structural differences as management capability differences.
Spin-off Causes Historical Data Break for WDC and SNDK
WDC's pre-spin-off consolidated financials included the Flash business and cannot be spliced with SNDK's standalone disclosure data. WDC must use post-spin-off HDD metrics, and SNDK must use its disclosure after independent listing in 2025.
Micron's Dual Categories and AI Transmission Differences
Micron's DRAM weight dilutes a "pure Flash" interpretation. SNDK and Micron are only partially comparable at the NAND sub-dimension. AI drives DRAM, enterprise SSDs, and archive storage at different paces; the three cannot be grouped under the same beneficiary logic.
Broad Industry Labels Mask Individual Differences
Labels such as "storage stocks" or "semiconductor stocks" facilitate theme screening but cannot replace ticker-level identification. Peers such as Seagate, Samsung, and SK Hynix are not within the core scope of the comparison of the three.
Summary
SNDK, WDC, and Micron are all U.S. storage-related stocks with essential differences in technology routes and cycle exposure: SNDK is pure Flash, WDC is pure HDD, and Micron is dual-category DRAM+NAND. Classification should first confirm tickers and company entities, then select indicators according to the corresponding cycle. SNDK and WDC must be analyzed based on post-spin-off independent metrics, and SNDK and Micron are only partially comparable at the NAND sub-dimension.
FAQ
Can SNDK and WDC still be compared as the same type of storage stock?
They cannot be directly compared as the same type of business. After the spin-off, WDC operates HDD, and SNDK operates NAND Flash and SSD. Their cycle variables and financial reporting scopes have been separated. Comparability mainly lies in the common origin of the spin-off, not in product or customer structure consistency.
Which of SNDK and Micron is closer to "pure NAND" exposure?
SNDK's business scope is concentrated on NAND Flash and SSD, providing purer exposure to the flash cycle. Micron has both DRAM and NAND businesses, so its overall cycle structure is affected by dual categories, making its NAND purity lower than SNDK's.
Is it appropriate to put WDC and Micron in the same comparison table?
It is only appropriate to list them together at the broad "data storage industry" level. It is not appropriate to directly compare gross margins or revenue growth rates without noting technical differences. WDC represents HDD capacity storage, while Micron represents silicon-based DRAM and NAND, with different cycle drivers.
Why is it necessary to confirm stock tickers first when researching U.S. storage stocks?
After the SanDisk spin-off, SNDK and WDC are two independent listed companies with separate tickers, financial reports, and trading pages. Micron uses the MU ticker. Mixing up tickers leads to errors in cycle judgment and financial data references.
Will AI data center growth equally affect SNDK, WDC, and Micron?
AI drives multi-layer storage demand, but each technology layer benefits differently. Micron is more directly tied to DRAM and HBM demand, SNDK is more tied to enterprise SSDs and the NAND cycle, and WDC is more tied to large-capacity archives and HDD shipments. The three should not be placed under the same beneficiary logic.
What other indicators should be checked when comparing SNDK, WDC, and Micron?
For SNDK, focus on gross margin, inventory turnover, flash capex, and capacity utilization. For WDC, focus on HDD shipments, average capacity, and cloud customer procurement. For Micron, track DRAM and NAND prices and inventory separately. After completing classification, check each item by item to avoid cross-technology chain miscomparison.


