Differences in index structure directly affect how capital is allocated across ETFs, index funds, and CFD products. Once industry weights change, the two indexes can show clear differences in market volatility, risk structure, and capital flows.
The core differences between US500 and NAS100 are mainly reflected in component structure, weighting mechanisms, industry distribution, and volatility characteristics. Different levels of technology stock exposure also give the two indexes distinct market positioning in terms of growth characteristics, market sensitivity, and risk appetite.
What Is US500
US500 is the trading code for the S&P 500 Index. It is used to track the overall market performance of 500 large publicly listed companies in the United States.
The core focus of US500 is broad coverage across several major U.S. industries. Technology, finance, healthcare, consumer, and industrial companies are all included within the US500 index system.
First, the S&P committee screens large publicly listed companies. The index system then calculates company weights based on free float market capitalization.
Next, changes in large company stock prices affect index volatility. Finally, US500 forms a broad index that reflects the overall performance of large U.S. companies.
US500 is closer to the overall structure of the U.S. economy, so global institutional investors often use it to observe risk appetite in the U.S. market.
Unlike a single sector index, US500 has broader industry coverage, which usually makes its volatility relatively more stable.
What Is NAS100
NAS100 usually refers to the NASDAQ 100 Index, which mainly tracks large non financial companies listed on the Nasdaq market.
The core focus of NAS100 is its higher weighting toward technology and growth companies. AI, semiconductor, cloud computing, and internet companies usually account for a large share of NAS100.
First, the Nasdaq market screens large non financial companies. The index system then calculates the weight structure according to company market capitalization.
Next, technology stock volatility directly affects NAS100 performance. Finally, NAS100 forms a market index centered on technology growth companies.
Unlike US500, NAS100 does not cover traditional financial institutions, so the technology sector has a more obvious influence on index movements.
This structure means NAS100 is more easily affected by volatility in AI, semiconductors, and internet industries.
Differences Between US500 and NAS100 Components
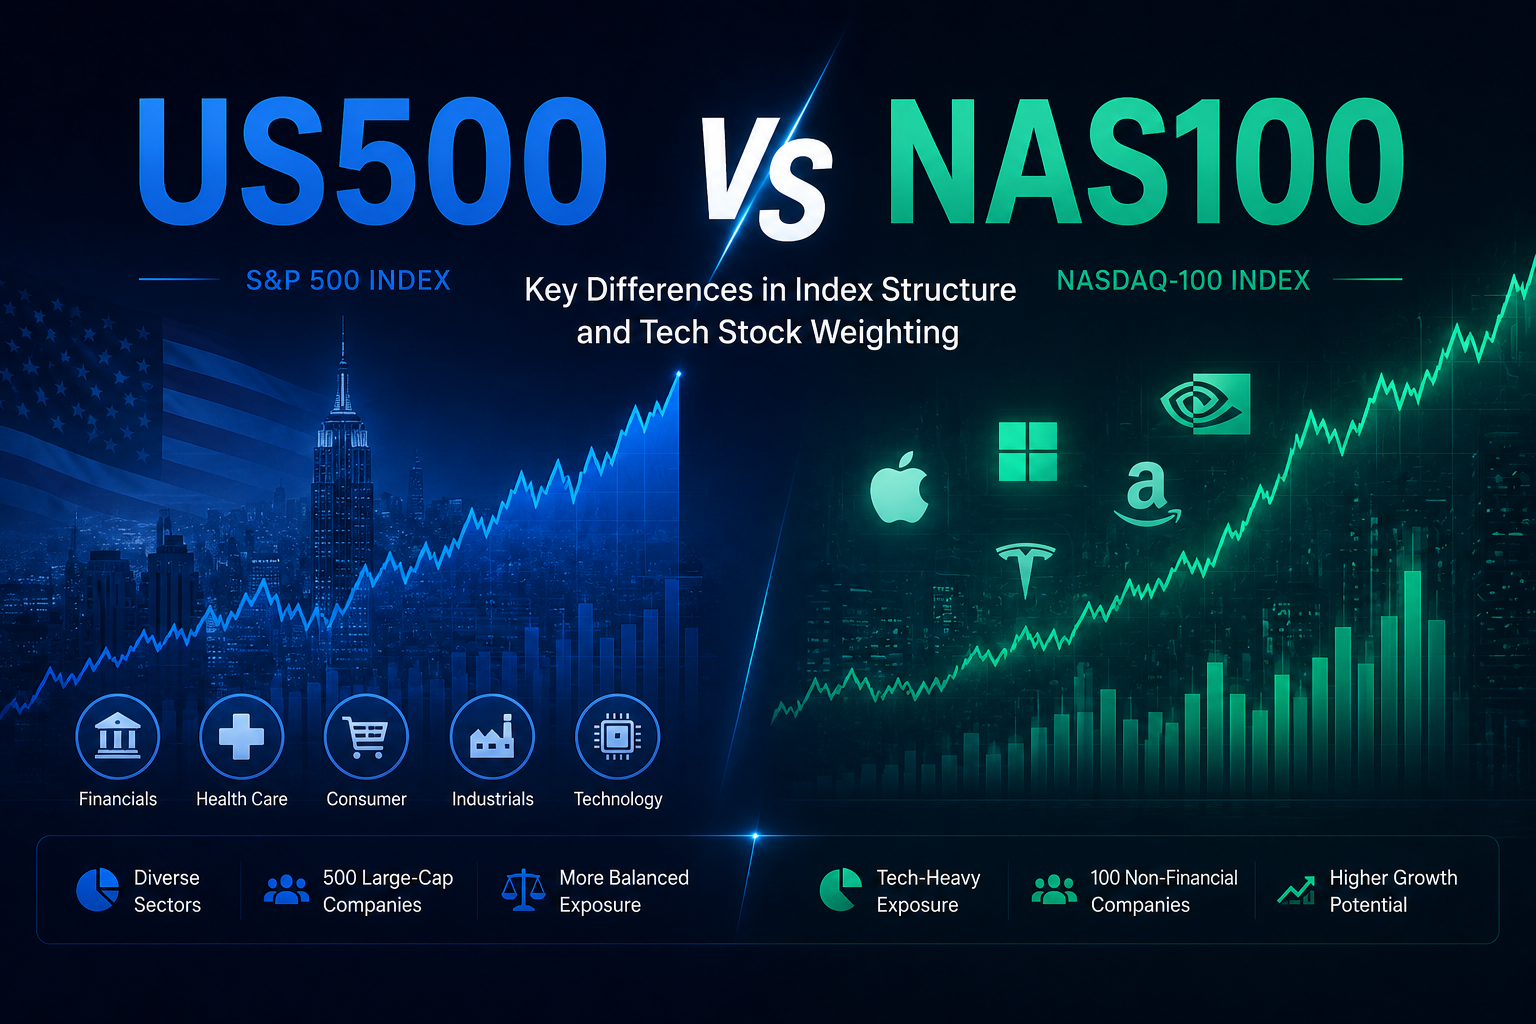
One of the key differences between US500 and NAS100 lies in their component structure. US500 places more emphasis on industry coverage, while NAS100 places more emphasis on growth oriented technology companies.
US500 covers financial, healthcare, industrial, and consumer sectors, so its industry distribution is more balanced. NAS100, by contrast, is mainly concentrated in technology and internet companies.
The table below shows the component differences between US500 and NAS100:
| Comparison |
US500 |
NAS100 |
| Number of companies |
500 companies |
100 companies |
| Industry coverage |
Broad industry coverage |
Mainly technology growth |
| Financial companies |
Included |
Not included |
| Technology weighting |
Relatively high |
Higher |
This structure means US500 is closer to the overall U.S. economy, while NAS100 is closer to the performance of the U.S. technology sector.
During periods when large technology companies rise, NAS100 usually shows more pronounced volatility than US500.
Differences in Weighting Mechanisms Between US500 and NAS100
US500 and NAS100 both follow a market capitalization weighting logic, but they differ significantly in weight concentration.
Because US500 covers more industries, large technology companies may have high weights, but they do not completely dominate the index structure.
NAS100 has a higher concentration of technology companies, so leading AI, semiconductor, and internet companies have a more visible impact on index movements.
First, the index system calculates the free float market capitalization of each constituent. The system then determines index weights based on company size.
Next, when large technology companies rise, NAS100 usually shows stronger volatility. Finally, the two indexes form different market risk structures.
This difference means NAS100 is more dependent on the technology sector, while US500 has a more balanced industry structure.
Structurally, NAS100 usually has higher weight concentration than US500, so its market volatility also tends to be relatively higher.
Differences in Industry Structure Between US500 and NAS100
US500 has a more comprehensive industry structure, while NAS100 is more tilted toward technology and growth sectors.
US500 usually covers:
-
Technology
-
Finance
-
Healthcare
-
Consumer
NAS100 is mainly concentrated in:
-
AI
-
Semiconductors
-
Cloud computing
-
Internet platforms
These industry structure differences directly affect the risk characteristics of each index.
First, during defensive economic phases, US500’s financial and consumer sectors may strengthen index stability. During technology sector rallies, NAS100 usually has greater upside sensitivity.
Next, when AI and semiconductor trends heat up, NAS100 is more likely to rise quickly. Ultimately, industry structure differences influence global capital flows.
Unlike traditional broad based indexes, NAS100 is more easily affected by technology cycles, so it usually has stronger growth characteristics.
Differences in Volatility Between US500 and NAS100
The volatility difference between US500 and NAS100 mainly comes from industry structure and technology stock weighting.
Because US500 has broader industry coverage, its index volatility is usually relatively stable. Financial, consumer, and healthcare sectors can partially offset technology stock volatility.
NAS100 is more easily affected by large technology companies. When AI, chip, and internet companies fluctuate, NAS100 usually experiences more visible gains or losses at the same time.
First, during technology sector rallies, NAS100 often leads the broader market. Then, when technology stocks pull back, NAS100’s decline may also widen.
At the same time, US500 can reduce part of this risk through its diversified industry structure. As a result, the two indexes develop different market volatility characteristics.
This difference means NAS100 is better suited for observing technology growth trends, while US500 is better suited for observing the overall U.S. market environment.
Differences in Use Cases Between US500 and NAS100
US500 is better suited for observing the overall U.S. economy and market risk appetite, while NAS100 is better suited for tracking technology sector trends.
Institutional investors often use US500 to allocate broad based assets. ETFs, pension funds, and index funds also build long term investment structures around US500.
NAS100 is more often used for technology growth asset allocation. AI, semiconductor, and internet related ETFs usually reference NAS100 more closely.
First, institutions choose index allocation directions based on the market environment. ETF and CFD platforms then provide index related products accordingly.
Next, market capital flows into different index products. Finally, US500 and NAS100 form different asset allocation scenarios.
This difference in use cases means US500 is more of a broad market indicator, while NAS100 is more of a technology growth indicator.
Conclusion
US500 and NAS100 are both core U.S. stock indexes, but they differ significantly in industry structure, technology stock weighting, and market volatility.
US500 focuses more on the overall performance of large U.S. companies, so its industry structure is more balanced. NAS100 is more tilted toward technology and growth companies, which makes the influence of technology stocks more pronounced.
ETFs, index funds, and CFD products all build market structures around these two indexes. As a result, the differences between US500 and NAS100 directly affect global capital flows and market risk appetite.
FAQs
What Is the Biggest Difference Between US500 and NAS100?
US500 covers multiple core U.S. industries, while NAS100 is more tilted toward technology and growth companies. As a result, their industry structures and technology stock weights differ significantly.
Why Is NAS100 Usually More Volatile?
NAS100 has a higher technology stock weighting. When AI, semiconductor, and internet companies fluctuate, NAS100 usually sees more pronounced gains or losses.
Does US500 Include Technology Companies?
US500 includes many technology companies, but it also covers finance, healthcare, and consumer sectors, giving it a more comprehensive industry structure.
Why Does NAS100 Not Include Financial Companies?
NAS100 mainly tracks large non financial companies listed on the Nasdaq market, so traditional financial institutions are usually not included in the index.
Why Are ETFs and CFDs Affected by These Two Indexes?
ETF and CFD products usually track the real time movements of US500 or NAS100, so index changes directly affect the prices of related market products.