Торгова логіка альткоїнів: Фундаментальний аналіз, Технічний аналіз, Адреси розумних грошей
На криптовалютному ринку альткоїни часто розглядаються як інвестиційні активи високого ризику та високого доходу. Багато трейдерів вважають, що використання менталітету Bitcoin для торгівлі альткоїнами не дієво. Bitcoin є відносно зрілим з більш контрольованою волатильністю, тоді як альткоїни представлені у багатьох варіаціях та темах, що робить їхні ціни більш схильними до новин про проекти та маніпуляцій великими інвесторами. Тому нам потрібно встановити правильну торгівельну логіку для альткоїнів. Ця стаття крок за кроком навчить початківців створювати власну стратегію торгівлі альткоїнами за допомогою трьох основних методологій: фундаментальний аналіз, технічний аналіз та відстеження адрес розумних грошей.
Фундаментальний аналіз: Розуміння Внутрішньої Вартості Проектів Альткоїнів
Фундаментальний аналіз спрямований на оцінку внутрішньої вартості та довгострокового потенціалу криптопроєкту, включаючи силу команди, технологію продукту,tokenomics, і попит на ринку. Порівняно з Bitcoin, який головним чином впливає на макрофактори, альткоїни нагадують акції стартапів, чиї результати високо залежать від розвитку проєкту та тепла його екосистеми.
На що звернути увагу в фундаментальному аналізі?
Команда та візія
Розуміння фону, досвіду розвитку та репутації спільноти команди проекту. Надійна команда та чітке візіонерство можуть збільшити шанси успіху проекту. Огляньте офіційний білий папір та дорожню карту, щоб підтвердити проблеми, які прагне вирішити проект, та його майбутні плани розвитку.
Технічна імплементація та впровадження продукту
Оцініть технологічну інноваційність проекту та поточний стан його реалізації продукту. Наприклад, перевірте, чиDeFiпроект вже має робочий протокол або якщоГреймФігра має існуючу гральну спільноту. Хоча технологічні досягнення важливі, проект, який залишається на етапі концепції без застосування в реальному світі, несе вищий ризик.
Індикатори даних (дані on-chain)
Використовуйте інструменти аналізу on-chain для відстеження ключових даних проекту, таких як щоденні активні адреси, обсяг торгів та загальна заблокована вартістьTVLЦі метрики відображають, чи проєкт дійсно використовується. Наприклад, якщо обсяг заблокованих коштів на DeFi платформі збільшується, це свідчить про те, що в протокол заблоковано більше коштів, що свідчить про міцні фундаментальні показники. Навпаки, зниження використання сигналізує про наявність попереджувальних сигналів. Беручи екосистему DeFi як приклад, під час ведмежого ринку 2022 року загальний обсяг заблокованих коштів у DeFi впав нижче $50 мільярдів, втративши 75% своєї вершинної вартості, показуючи великий вітік капіталу. У таких випадках, навіть якщо технічні показники показують бикові сигнали, потрібна обережність.

Обсяг заблокованих коштів у DeFi значно знизився в 2022 році (Джерело: Glassnode)
Токеноміка
Проаналізуйте механізм постачання токенів та їх розподіл, включаючи загальний обсяг емісії, темп інфляції, графік розблокування та сфери застосування. Хорошо спроектована модель токеноміки (такі як дефляційні механізми та чітка корисність) може допомогти збільшити вартість токена. З іншого боку, якщо команда утримує занадто великий відсоток або розблокування сконцентроване в певні моменти часу, може виникнути ризик продажного тиску.
Спільнота та Ринкова Хайп
Спостерігайте за залученням спільноти та увагою ринку до проекту. Наприклад, кількість учасників та активність у Твіттері або спільноті Discord проекту, а також медійне висвітлення. Дуже активна спільнота часто свідчить про сильний інтерес ринку, але слід також бути обережними щодо проектів, що підпадають під гіповани, але не мають реальних досягнень.
Фундаментальний аналіз на практиці
Давайте візьмемоLido Financeна прикладі покажемо, як використовувати фундаментальний аналіз для визначення того, чи варто слідувати за проєктом DeFi:
Спочатку, шукаючи фінанси Лідо фононлайн, ви знайдете, що він був співзаснований в 2020 році Костянтином Ломашуком, Василем Шаповаловим і Джорданом Фішем, які були основними інженерами у провідних криптовалютних компаніях, таких як РівністьіConsenSys. Це свідчить про те, що команда не лише має високу технічну експертизу, але й глибокі зв'язки та ресурси в галузі, що зменшує ризик невдачі проекту.
Щодо технологій та продуктів, Lido’sstETHліквідність стейкінгу похідних вже підтримує основні ланцюги, такі як Ethereum,Полігон, та Солана, і інтегрується з понад сотнею протоколів DeFi. Це свідчить про високу зрілість продукту з багатими використаннями та сильною конкурентною перевагою в екосистемі.
Далі, розглядаючи токеноміку, LDO має загальний обсяг 1 мільярд токенів, з яких 36,32% виділено для скарбниці DAO, 22,18% для інвесторів та 15% для засновницької команди. Ви можете скористатися панеллю Token Terminal для перевірки концентрації токенів LDO в реальному часі серед Топ-власників токенів:
- Відкрийте токен-термінал → Проекти → Пошук “Lido Finance” → Клацніть “Набори даних” → Клацніть “Топ-власники токенів”
- У стовпці “Власність” ви можете побачити відсоток постачання LDO, контрольований кожною адресою.
Ці дані оновлюються щоденно, і вони показують, що топ-100 власників контролюють 84% поставок LDO, що свідчить про високу концентрацію. Висока концентрація власності токенів означає, що управлінська влада може бути контрольована кількома власниками, що приносить ризики централізації. Дуже важливо уважно стежити за майбутнім графіком блокування та розблокування проєкту.

Запит розподілу утримання найбільших власників токенів (Джерело: Токеновий термінал)
У плані ринкового хайпу за даними Token Terminal → Metrics, Місячні активні користувачі (MAU) Lido перевищили 25 000 в травні 2024 року, але швидко впали, наразі становлячи близько 11 100. Ця значна коливання свідчить про те, що популярність Lido не була утримана, показуючи проблеми з утриманням користувачів та зниженням залученості спільноти. Важливо контролювати, як проект вирішує та покращує вартість та участь на довгостроковій основі.

Спад щомісячних активних користувачів Lido (Джерело: Токеновий термінал)
Ви також можете використовувати Token Terminal → Метрики для перевірки Загальної Заблокованої Вартості (TVL) Lido. TVL Lido продовжує постійно зменшуватися з кінця 2024 року, знижуючись з майже $40 мільярдів до приблизно $18 мільярдів. Це свідчить про те, що велика кількість капіталу залишає протокол, участь користувачів зменшується, а довіра ринку коливається. Важливо бути обережними на можливі фундаментальні слабкості та ризик того, що конкуренти підточують його позицію.

TVL Lido постійно зменшувався з кінця 2024 року (Джерело: Токен Термінал)
У цілому фундаментальні показники Lido все ще мають достатньо сили для підтримки проекту, але декілька ключових показників нещодавно послабилися. Рекомендується прийняти стратегію "чекати підтвердження": зачекайте, поки основні метрики, такі як TVL та MAU стабілізуються, і децентралізація управління покращиться, перш ніж оцінювати час для поступових інвестицій.
Через цей випадок очевидно, що фундаментальний аналіз допомагає нам визначити, чи є проект альткоїнів «вартий уваги». Для початківців розвивання звички вивчення білокниги проекту і моніторинг тенденцій даних on-chain є ціннішим, ніж сліпе відтворення ринкових чуток. Пам'ятайте: фундаментали - це довгострокова сила, і ціни в кінцевому підсумку повернуться до цінності. Перш ніж інвестувати в альткоїни, запитайте себе, чи справді проект має довгострокове значення. Це збільшить ваші шанси на успіх в інвестуванні в альткоїни.
Технічний аналіз: Аналіз трендів на графіку та володіння часом
Крім фундаментального аналізу, технічний аналіз (TA) є важливим інструментом при торгівлі альткоїнами. Технічний аналіз ґрунтується на ринкових даних, таких як ціна та торговий обсяг, використовуючи графіки для визначення тенденцій та паттернів, які допомагають визначити можливості для купівлі та продажу. Для волатильних альткоїнів ціни можуть подвоїтися протягом декількох днів або різко впасти. Розуміння того, як читати графіки, може допомогти вам йти за трендом та приймати своєчасні рішення щодо отримання прибутку або зменшення збитків.
Основні ключові моменти технічного аналізу
Тенденції та шаблони
Почніть з визначення того, чи альткойн знаходиться в бичому або ведмежому тренді. Ви можете спостерігати за рухомими середніми (наприклад, 50-денна рухома середня), щоб оцінити, чи короткострокові та довгострокові тенденції перебувають у бичому вирівнюванні. Звертайте увагу на класичні патерни, такі як подвійні дни, потрійні вершини, трикутні збіжності та верхи/дни голови і плечей. Наприклад, якщо ціна альткойна формує патерн потрійного дна та проривається вгору через лінію шиї, це часто сигналізує про реверсію тренду вгору.

При рухомих середніх вище вказано на биковий тренд (Джон, автор Gate Learn)
Підтримка та опір
З використанням свічкових графіків визначте ключові рівні підтримки та опору (зони з густими високими та низькими). Через високу волатильність альткоїнів рівні підтримки/опори часто стають місцями битви биків і ведмедів. Рівень, який постійно підтримується, є міцною підтримкою, тоді як ціна, яка постійно не може прорватися та падає назад, вказує на міцну опір. Коли ціна прориває опірну зону, це часто призводить до зміни підтримки/опори, де попередня опір стає підтримкою. При входженні в угоду, покупка близько до зони підтримки, як правило, є безпечнішою.

Підтримка та опірні зони (Джон, творець Gate Learn)
Технічні показники
Допоміжні індикатори, такі як RSI (Relative Strength Index), MACD та Bollinger Bands, можуть надавати сигнали для перекуплених / перепроданих умов або змін імпульсу. Наприклад, RSI вище 70 часто вказує на перекуплені умови (потенційна корекція ціни), тоді як RSI нижче 30 може свідчити про перепродані умови (вища ймовірність відбиття).
Проте важливо не покладатися виключно на значення індикаторів, а поєднувати їх з аналізом тенденцій. Наприклад, у період бичого ринку пороги перекупленості / перепроданості для RSI можуть бути налаштовані на 80 та 40, а в спадному ринку на 60 та 20, щоб уникнути надмірних або неефективних сигналів.
Додатково, одноперіодний аналіз часто може видавати хибні сигнали, тому рекомендується використовувати багаточасову рамку підтвердження. Наприклад, коли 30-періодний EMA перетинається вище 90-періодного EMA, підтвердьте це, перевіривши, що 4-годинний RSI перевищує 65, і щотижневий MACD показує золотий перехрестя. Ці комбіновані умови створюють надійний входження в коротку позицію, покращуючи успішність угод та зменшуючи ризики. Оптимізуючи стратегії таким чином, трейдери можуть точніше визначати час своїх угод та уникати заблукання через ринковий шум.
Обсяг торгів
Торговий обсяг є одним з найважливіших, але часто ігнорованих елементів технічного аналізу. Тенденція стає більш переконливою, коли рухи цін супроводжуються великим торговим обсягом. Навпаки, збільшення або зменшення цін без значного обсягу зазвичай є нестійкими. Коли ви бачите, що альткоїн прориває ключовий рівень підтримки, завжди перевіряйте, чи обсяг значно збільшився. Вибух з великим обсягом має більшу ймовірність успіху. Якщо обсяг недостатній, це може бути хибним проривом, тому будьте обережні, коли намагаєтеся зловити підйом ціни.
Технічний аналіз на практиці
Ми можемо систематично розробити технічну торгівельну стратегію для альткоїнів, застосовуючи вищезазначені ключові моменти. Давайте скористаємося LDO як прикладом, щоб проілюструвати практичні кроки. Нижче наведено щоденну діаграму LDO:

Щоденна діаграма LDO (Джон, творець Gate Learn)
Ви можете відкритиTradingViewабо використовуйте вбудовану свічкову діаграму на біржі, а потім розширте часовий рамки на щоденний або щотижневий, щоб спостерігати загальну тенденцію LDO. На даний момент ціна перебуває в постійному спадному тренді і залишається нижче 50-денного рухомого середнього, що свідчить про песимістичний тренд. Однак ціна зараз знаходиться на чіткій зоні підтримки (крапкована біла лінія) і показує ознаки відбою без руйнування. У той же час індикатор RSI знаходиться на низькому рівні, що свідчить про потенційний перепроданий стан. Об'єднані технічні показники вказують на зростаючу ймовірність реверсу тенденції.
На основі цього аналізу, якщо ви ставите на розвиток фундаментальної ситуації і бажаєте відкрити позицію на зростання, ви можете розробити торговельну стратегію: вступайте, коли ціна перериває рухомий середній з великим обсягом, сигналізуючи зміну на бичачий тренд, і мета - наступна ціль на попередньому максимумі або вище. Управління ризиками так само важливо - якщо ціна ослаблює і перериває критичну підтримку, розгляньте можливість зупинитися, щоб уникнути подальшого ризику падіння.
Якщо LDO подальше розламується з великим обсягом, ми виконуємо наш план і купуємо частинами. Протягом наступних днів уважно контролюйте торговий обсяг та ринковий настрій: якщо ціна зростає, а обсяг продовжує зростати, це свідчить про здоровий тренд вгору, і позицію можна утримати довше. Проте, якщо ціна робить нові максимуми, а обсяг зменшується (розбіжність між ціною та обсягом), це сигнал попередження, і можливо буде розумним брати часткові прибутки на вищих рівнях. Технічний аналіз - це динамічний процес, і ми повинні залишатися гнучкими, адаптуючись до змін на ринку.
Застосовуючи цей принцип: У реальній торгівлі кожен графік альткоїнів унікальний, але логіка технічного аналізу залишається незмінною. Для початківців найкраще почати з аналізу загальної ринкової тенденції – спочатку навчитися оцінювати Bitcoin та Ethereum – оскільки на альткоїни часто впливають ширші рухи ринку. Якщо ринок перебуває у ведмежому тренді, навіть найкращі альткоїни можуть впасти разом із ним. І навпаки, під час бичачого ринку навіть неякісні проєкти можуть зіткнутися зі стрибками цін через приплив капіталу. Однак деякі альткоїни можуть демонструвати незалежну цінову дію, що робить використання технічного аналізу для визначення часу входів і виходів важливим. Наприклад, деякі популярні токени DeFi можуть зрости навіть тоді, коли Bitcoin консолідується. У таких випадках трейдерам необхідно використовувати свічкові патерни, щоб перевірити, чи є купівельний тиск справжнім і чи не пробиті ключові рівні опору. Зрештою, технічний аналіз допомагає визначити, «коли входити і виходити», але не менш важливо поєднувати його з фундаментальним аналізом, щоб вирішити, «що купити». Інтеграція обох стратегій значно підвищує ймовірність успіху.
Управління ризиками та контроль позицій
Механізм захисту від ризику
З урахуванням великої волатильності альткоїн ринку та його схильності до коливань цін на Bitcoin (BTC) та Ethereum (ETH), важливо встановити систематичний кількісний механізм хеджування для зменшення ризиків, пов'язаних з загальними спадами на ринку. Наприклад, можна використовувати коефіцієнт βдля кількісного хеджування BTC/ETH.
Коефіцієнт β (бета-коефіцієнт) використовується для вимірювання чутливості ціни окремого активу до волатильності відносно всього ринку або базового активу (такого як BTC або ETH). Формула для обчислення β наступна:

Формула коефіцієнта β (Джерело: Вікіпедія)
Де: Ra = Щоденний приріст альткоїна (наприклад, щоденний відсоток зміни ціни) Rm = Щоденний приріст базового активу, такого як BTC або ETH. β > 1 вказує на те, що альткоїн більш волатильний, ніж BTC або ETH. β ≈ 1 означає, що альткоїн рухається у такт з BTC або ETH. β < 1 вказує на те, що альткоїн менш волатильний, ніж BTC або ETH.
Конкретні кроки для механізму зменшення ризику наступні:
- Спочатку розрахуйте коефіцієнт β альткоїна відносно BTC/ETH для оцінки чутливості ринку та рівня волатильності альткоїна. Спочатку розрахуйте коефіцієнт β альткоїна відносно BTC/ETH для оцінки чутливості ринку та рівня волатильності альткоїна.
- Якщо 30-денний коефіцієнт β у секторі альткоїнів перевищує 1, що свідчить про надмірну волатильність ринку, слід негайно активувати стратегію хеджування ризику. Наприклад, виділіть приблизно 25% позиції для обертання в обернені постійні контракти на BTC або ETH (короткі позиції), щоб скомпенсувати можливі збитки з позиції в альткоїнах прибутками, отриманими від обернених контрактів під час спаду ринку.
- Коли коефіцієнт β повертається до нормальних рівнів (наприклад, нижче 1), поступово закривайте інверсні контракти та відновлюйте нормальне розподіл позицій.
Цей метод страхування на основі коефіцієнта β може систематично управляти ризиком портфеля, зменшуючи потенційні втрати під час періодів значної волатильності ринку.
Вдосконалені технічні правила Stop-Loss
Узагальнена стратегія технічного зупинення втрат може зменшити ефективність операцій. Тому рекомендується вдосконалити налаштування зупинення з використанням більш точних методів:
- Коли ціна альткоїна падає нижче критичного рівня підтримки, використовуйте динамічний метод стоп-лосс (ATR stop-lossATR (Average True Range) - це технічний індикатор, який використовується для вимірювання волатильності ціни активу. На відміну від стандартних індикаторів волатильності, ATR не враховує напрямок ціни, а лише описує величину коливань цін, часто використовується для встановлення динамічного стоп-лоссу або оцінки ринкового ризику. Зокрема, стоп-лосс може бути встановлений в 2 рази більше ATR, дозволяючи точці стоп-лоссу динамічно налаштовуватися на основі останньої волатильності, що робить його більш підходящим для поточних ринкових умов.
- Слідкуйте за ліквідністю ринку альткоїна. Якщо різниця між котируваннями купівлі-продажу раптово збільшується більше ніж на 5%, що свідчить про серйозний дефіцит ліквідності та зменшення глибини ринку, це може призвести до значної волатильності цін. У таких випадках слід вжити екстрену стратегію виходу, швидко ліквідуючи або значно зменшуючи позицію, щоб уникнути великих збитків, спричинених вичерпанням ліквідності ринку.
Ці вдосконалені стратегії зупинки збитків та моніторингу ліквідності можуть ефективно контролювати ринкові ризики, запобігаючи значним, необоротним збиткам через дефіцит ліквідності або неочікувані зниження.
Відстеження адрес розумних грошей: Спостереження за рухами китів для виявлення ринкових можливостей
Розумні грошівказує на тих добре інформованих, досвідчених великих інвесторів, включаючикитгаманці, відомі інвестиційні установи та ключові гравці, які зробили ранні кроки в певному секторі. Завдяки прозорій природі блокчейну, будь-які великі перекази або угоди за адресою реєструються в ланцюжку блоків та є загальнодоступними. Слідкуючи за цими адресами розумних грошей, ми можемо потенційно визначити перспективні проекти на ранніх етапах, слідкувати за ринковими тенденціями для отримання прибутку, а навіть отримувати своєчасні попередження про ризики.
Чому важливо відстежувати розумні гроші?
Розумні гроші зазвичай мають доступ до первинної інформації або проводять глибоке дослідження. Їх капіталовкладення можуть вести ринок. Наприклад, коли потужний кит починає накопичувати певну альткоїн у великих кількостях, це зазвичай призводить до підйому ціни цієї монети на короткий термін. Роздрібні інвестори, які спостерігають за цими активностями на ланцюгу блоків і вчасно реагують, мають можливість скористатися цим трендом. Крім того, відстеження розумних грошей допомагає нам вчитися від їхніх інвестиційних стратегій і розуміти, чи відповідає їхня позиціонування нашій власній логіці. Деякі кити фокусуються на короткостроковійМем-монетаспекуляції, тоді як інші тримаються довгостроковихпроекти DeFi синього фішки—кожен з різними стилями. Ми можемо отримати уявлення та покращити наші торговельні системи завдяки довгостроковому спостереженню. Звичайно, якщо ми спостерігаємо, що кити значно виводять або викидають актив, це може сигналізувати про час взяти прибуток або вказувати на потенційні негативні новини для проекту, в такий момент зменшення експозиції може допомогти зменшити ризик.
Інструменти відстеження розумних грошей
Є кількаінструменти моніторингу ланцюгадоступні сьогодні, що дозволяють звичайним інвесторам легко відстежувати рухи розумних грошей. Нижче наведено кілька найпопулярніших та корисних платформ або інструментів:
Lookonchain
Платформа, присвячена відслідковуванню руху китів на ланцюжку, часто ділиться випадками активності розумних грошей в соціальних мережах. Рекомендується слідкувати за їхніми дописами на платформах, таких як X, де вони часто розкривають інформацію, таку як "кит щойно купив монету X" або "старий гаманець переклав велику кількість монети Y на біржу."
Наприклад, у лютому 2025 року Lookonchain опублікував попередження, що таємничий кит вивів 1,7 мільйона UNI (вартістю приблизно 15,54 мільйона доларів) з біржі на новий гаманець. Це свідчило про те, що кит накопичував токени Uniswap (UNI). Оскільки Uniswap є найбільшою децентралізованою біржею на Ethereum, його токен зріс на понад 50% за останній рік. Такі значущі рухи розумних грошей рідко бувають без причин; вони можуть передбачати позитивні події для Uniswap і позиціонувати себе рано. Цей тип інформації слугує потенційним сигналом для бичого настрою.

Lookonchain Публікація, що розкриває рух китів (Джерело: Lookonchain Офіційний X)
Аркхем
Платформа розвідки, яка наголошує на аналізі деанонімізації, яка з'являється на ланцюжку.Arkhamдопомагає користувачам пов'язувати конкретні адреси гаманців з потенційними реальними власниками або установами (наприклад, позначаючи адресу як належну певній фонді). З даними Arkham стає легше ідентифікувати, які адреси розумних грошей варто відслідковувати. Подія з виведенням кита UNI, згадана раніше, була виявлена та розповсюджена Lookonchain через позначені дані Arkham. Arkham також надає функції моніторингу, що дозволяє користувачам отримувати сповіщення про значні перекази з відстежуваних адрес, що дозволяє інвесторам зручно відстежувати рухи китів в реальному часі.
Ось як використовувати Аркхем для відстеження:
1. На головній сторінці введіть назву токена, який ви хочете відстежувати (наприклад, «UNI») у поле пошуку.
2. Прокрутіть вниз, щоб побачити розділ з найбільшими власниками, які зазвичай є адресами відомих установ / фондів / валют вартістю, які варто стежити за цим токеном.

Адреси китів UNI (Джерело: Arkham)
3.З боку є ще один розділ, де показані записи про переказ активів для цього токена. Ви можете фільтрувати за конкретними адресами або великими переказами, щоб перевірити наявність незвичайної активності. Наприклад, під час фільтрації адреси великого власника я виявив, що протягом останніх двох років не було жодних значних рухів.
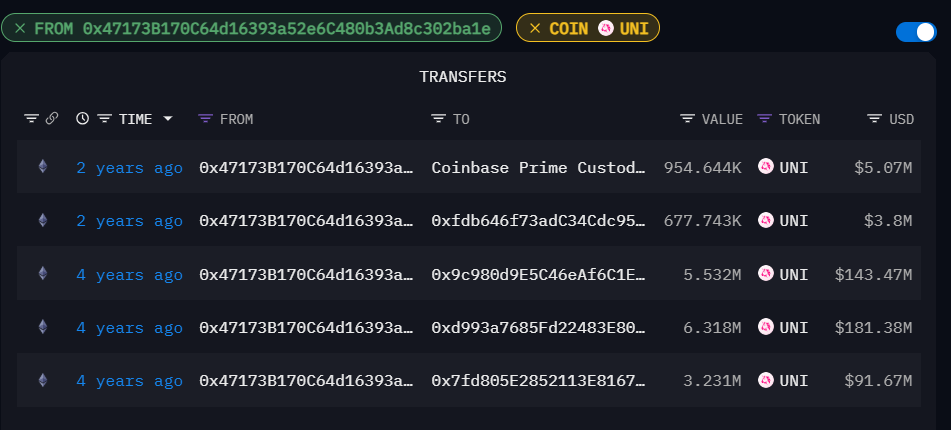
Записи про переказ активів в адресу кита (Джерело: Arkham)
4. Якщо ви вважаєте певну адресу важливою і варто відстежувати, ви можете створити список спостереження. Просто знайдіть адресу на домашній сторінці Arkham, а потім натисніть «Створити сповіщення» або «Відстежити адресу» в правому верхньому куті. Проте слід мати на увазі, що для використання цих функцій потрібна реєстрація.
Nansen
Nansen - це популярна та всебічна платформа для аналізу on-chain. Однією з її основних функцій є "Smart Money Label", яка категоризує адреси гаманців за допомогою машинного навчання та професійних командних анотацій. Nansen міткидесятки тисяч адрес гаманців, таких як ті, що належать відомим венчурним фондамVCs) , досвідчені кити DeFi, експерти з арбітражу та ранні інвестори. Трейдери можуть швидко зрозуміти контекст та потенційні інвестиційні мотивації власників гаманців за допомогою цих міток.

Інструмент Nansen показує участь розумних грошей в угодах (Джерело: Nansen)
Додатково, Nansen чітко представляє статус потоку фондів токенів для конкретної адреси, що дозволяє користувачам одним поглядом побачити, чи продовжує розумні гроші інвестувати в певний токен або екосистему, чи починає вони виводити кошти з певного сектору.

Nansen показує потік коштів для конкретної адреси (Джерело: Nansen)
У інвестиціях у альткоїни фактори, такі як співвідношення інституційних утримань, графіки розблокування токенів, а також те, чи токени передаються на біржі після розблокування, є важливими елементами, які впливають на короткострокові коливання цін. Наприклад, коли токени від ВК або ранніх інвесторів мають бути розблоковані для певного проекту, Nansen може відстежувати та маркувати інституційні адреси для моніторингу руху їх активів. Спостерігаючи, чи ці адреси передають токени на біржі, трейдери можуть передбачити, чи ці великі утримувачі готуються продавати для арбітражу. Це надає попередження, що дозволяє трейдерам вжити заходів з мінімізації ризику, таких як зменшення позицій або коригування стратегій.

Nansen показує великі перекази токенів на біржі (Джерело: Nansen)
Інші схожі інструменти
Інші інструменти на ланцюгу включають DeBank, що дозволяє користувачам шукати будь-яку адресу Ethereum і переглядати її активи та історичні дії. Якщо ви знаєте адресу гаманця відомої людини, ви можете додати її до свого списку спостереження DeBank, щоб відстежувати її останні активи та прибутки. Аналогічно Etherscan, блокчейн-дослідник, корисний для більш глибокого вивчення деталей фондових переказів. Наприклад, коли коливається ціна токена, ви можете використовувати Etherscan, щоб перевірити, чи були великі транзакції, відстежувати кошти, що надходять з гаманця на біржу, та виявити, чи продаються які-небудь кити.
Стратегія відстеження розумних грошей
Попередження про продаж китів
У березні цього року токен платформи DeFi АУКЦІОНпобачив раптове падіння ціни на 50%.Згідно з офіційним X Lookonchain, кілька адрес китів переклали понад 1,08 мільйона токенів AUCTION (14% в обігу) на біржі Binance та OKX перед крахом. Така велика концентрація токенів, що потрапили на біржі, чітко свідчила про те, що кити готувалися продавати, що призвело до зриву ринкової ціни.
Якби ми стежили за гаманцями цих китів AUCTION, ми б могли помітити надзвичайно великі перекази на біржі і швидко діяти, щоб або підвищити попередження, або продати як засіб забезпечення. Цінність управління ризиками відстеження «розумних» адрес грошей полягає в ідентифікації сигналів, що тренди можуть змінитися на основі дій китів. Навпаки, якщо ми спостерігаємо, як кити купують великі суми невідомого токена, це може сигналізувати про те, що фундаментальні показники токена можуть покращитися (наприклад, оновлення протоколу або запуск нового продукту). Якщо звичайні інвестори можуть помітити це рано і відповідно розмістити свої позиції, вони можуть отримати прибуток на ринку пізніше.
Визначення цілей розумних коштів
Не всі дії китів варто сліпо слідувати. Нам потрібно розрізняти мету за рухом розумних грошей. Деякі кити віддають перевагу довгостроковим інвестиціям, таким як відомі інституційні фонди, які розподіляються на провідні проекти та утримуються довгостроково. У цих адресах зазвичай менше часті дії. Однак їх зміни в утриманні можуть допомогти оцінити настрій ринку (наприклад, якщо провідний фонд збільшує свою позицію в новому зароджуючому секторі, це свідчить про довіру в цю область).
Інші - це короткострокові арбітражні «снайперські» гаманці, які купують великі кількості токенів, коли проект вперше запускає свій пул ліквідності, а потім швидко продають з величезним прибутком. Відстеження цих адрес може навчити короткострокових технік входу та виходу, але звичайним інвесторам може бути важко втримати їхній темп.
Крім того, деякі так звані "розумні грошові адреси" можуть бути більш вигідними завдяки удачі, наприклад, ранні учасники, які стали багатими завдяки роздачам, а не завдяки вдосконаленим рішенням. Тому важливо уважно фільтрувати і відстежувати лише тих китів з реальними стратегіями та можливостями. Завжди уникайте сліпого копіювання інших - розумні гроші надають сигнали та натхнення, але остаточні рішення про купівлю чи продаж повинні базуватися на власному незалежному аналізі та оцінці ризику.
З використанням інструментів on-chain ми можемо отримати деякі уявлення про рухи провідних фондів на ринку, що є значним перевагою в часто перенасиченому світі криптовалют. Однак важливо пам'ятати, що будь-який кит може допустити помилки або несподівано змінити напрямок. Хоча рухи розумних грошей слід розглядати як джерело інформації, ніколи не ігноруйте власний фундаментальний та технічний аналіз. Тільки поєднавши інформацію з різних джерел, ми можемо справді бути в курсі подій.
Поєднуючи три методи для створення персоналізованої стратегії торгівлі альткоїнами
Ринок альткоїнів постійно змінюється, і немає жодної однієї формули, яка гарантує успіх. Фундаментальний аналіз, технічний аналіз та відстеження розумних грошей мають свої переваги і доповнюють один одного: фундаментальний аналіз показує нам, які монети мають потенціал і варто звернути увагу на тривалий строк, технічний аналіз відповідає на питання, коли купувати або продавати для найнижчого ризику та найвищої можливості, а відстеження розумних грошей надає інформацію про те, як інші інвестують, пропонуючи переваги ранньої інформації та попередження про ризики.
Для початківців ключовою є ефективне поєднання цих методів. Наприклад, коли ви виявляєте, що новий проєкт DeFi має міцні фундаментальні основи, бачите розриви на графіках й помічаєте, що в проєкт входить кілька великих гравців, ці три сигнали разом створюють цінну можливість для уваги. Ймовірність успіху набагато вища, ніж при покладанніся тільки на один сигнал. З іншого боку, поспішати в монету лише на підставі технічного сигналу для покупки, не розуміючи фундаментальних аспектів, коли вже вийшли великі гравці, часто призводить до невдачі.
Звичайно, характер та уподобання кожного інвестора різні, і на практиці, залежність від цих трьох методів може варіювати. Деякі можуть відмінно вивчати тенденції у галузі та зосереджувати більшість своєї енергії на фундаментальному аналізі; інші можуть насолоджуватися читанням графіків свічок та процвітати на ритмі технічного аналізу; досвідчені гравці можуть спеціалізуватися на видобутку даних в ланцюжку, уважно відстежуючи рухи китів. Жодна одна стратегія не підходить для всіх, і найважливіше - вчитися та практикувати, поки ви не знайдете комбінацію стратегій, яка працює найкраще для вас.
Починаючи ваш шлях торгівлі альткоїнами, спробуйте перевірити фундаментальну, технічну та інформацію від розумних грошей. Задайте собі питання: Яка довгострокова цінність проекту (фундаментальні аспекти)? Чи узгоджений поточний ринковий настрій та тенденція (технічні аспекти)? Чи є ознаки того, що великі гравці також звертають увагу (розумні гроші)? Після огляду цих факторів ваше рішення буде виглядати більш обґрунтовано.
Нарешті, нагадування: працюючи на здобуття прибутку, ніколи не слід забувати про управління ризиками. Незалежно від того, наскільки ви впевнені в угоді, завжди встановлюйте точки зупинки збитків і керуйте розміром позиції. Тільки виживаючи достатньо довго на ринку, ви зможете скористатися наступною можливістю з альткоїном, що зустрінеться вам на шляху. Бажаю всім читачам успішної торгівлі в криптосвіті та успіху в пошуку свого шляху!
Поділіться


Пов’язані статті

Як провести власне дослідження (DYOR)?

Детальний опис Yala: створення модульного агрегатора доходності DeFi з $YU стейблкоїном як посередником

Дослідження 8 основних агрегаторів DEX: Двигуни, що забезпечують ефективність та ліквідність на крипторинку

7 інструментів аналізу для розуміння NFT

Як поставити ETH?
