币圈翔宇
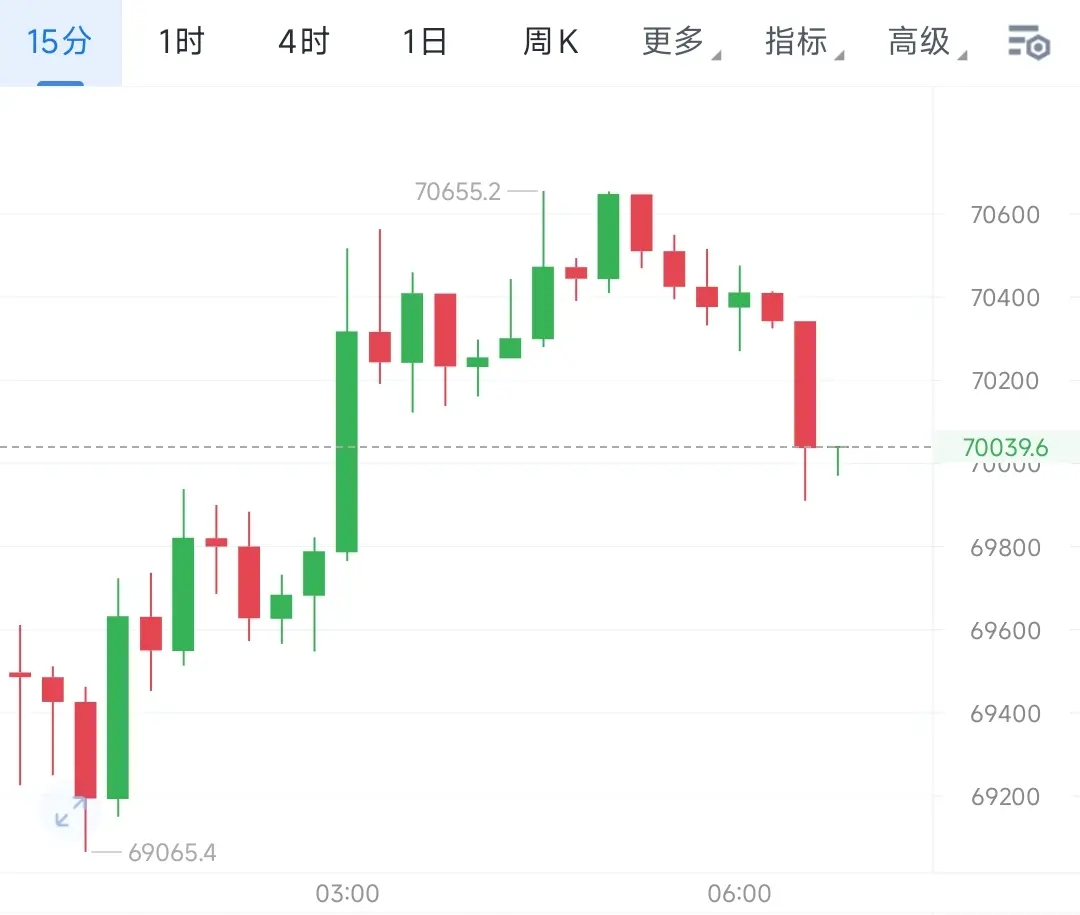
Good morning friends, Big Bitcoin maintained an overall shock repair pattern overnight, oscillating upward throughout the night and touching a high of 70600 in the early morning, then came under pressure and retreated. Currently it's consolidating around the 70000 level; Auntie's trend is relatively weak, with the price ratio rebounding to around 2155 before facing upside resistance, now retracing slightly to around 2140 for adjustment. The short strategy I provided at midnight has successfully offered entry opportunities, and actual positions have been successively entering. Friends who have
BTC-1.17%
- 讚賞
- 按讚
- 留言
- 轉發
- 分享

$XAU
上升趨勢.....
查看原文上升趨勢.....
- 讚賞
- 按讚
- 留言
- 轉發
- 分享
ass
trump
創建人@GateUser-6205dbef
上市進度
0.00%
市值:
$2320.68
更多代幣
📢 AINFT AI 服務平台重磅升級,一次性新增三款頂尖大模型支持!
✨ MiniMax‑M2.5
強化多步邏輯推理能力,深度優化智能 Agent 工作流,複雜任務處理更流暢。
✨ Kimi‑K2.5
支持超長上下文理解,專為海量長文本、深度文檔解析與總結場景打造。
✨ GLM‑5
推理、代碼能力與中文理解全面均衡,多場景通用,實用性拉滿。
目前平台已一站式集成 Claude、ChatGPT、Gemini 等全球主流模型,
統一入口即可自由調用多模型,按需計費,無需訂閱,使用成本更低、體驗更絲滑。
新用戶登錄即可領取百萬積分福利,快來體驗 Web3 時代最強 AI 聚合平台!
👉 立即體驗:
#AINFT # TRONAI #Web3AI
✨ MiniMax‑M2.5
強化多步邏輯推理能力,深度優化智能 Agent 工作流,複雜任務處理更流暢。
✨ Kimi‑K2.5
支持超長上下文理解,專為海量長文本、深度文檔解析與總結場景打造。
✨ GLM‑5
推理、代碼能力與中文理解全面均衡,多場景通用,實用性拉滿。
目前平台已一站式集成 Claude、ChatGPT、Gemini 等全球主流模型,
統一入口即可自由調用多模型,按需計費,無需訂閱,使用成本更低、體驗更絲滑。
新用戶登錄即可領取百萬積分福利,快來體驗 Web3 時代最強 AI 聚合平台!
👉 立即體驗:
#AINFT # TRONAI #Web3AI
NFT0.51%
- 讚賞
- 按讚
- 留言
- 轉發
- 分享
你只需花費100美元。
選擇最佳選項
查看原文選擇最佳選項

- 讚賞
- 按讚
- 留言
- 轉發
- 分享
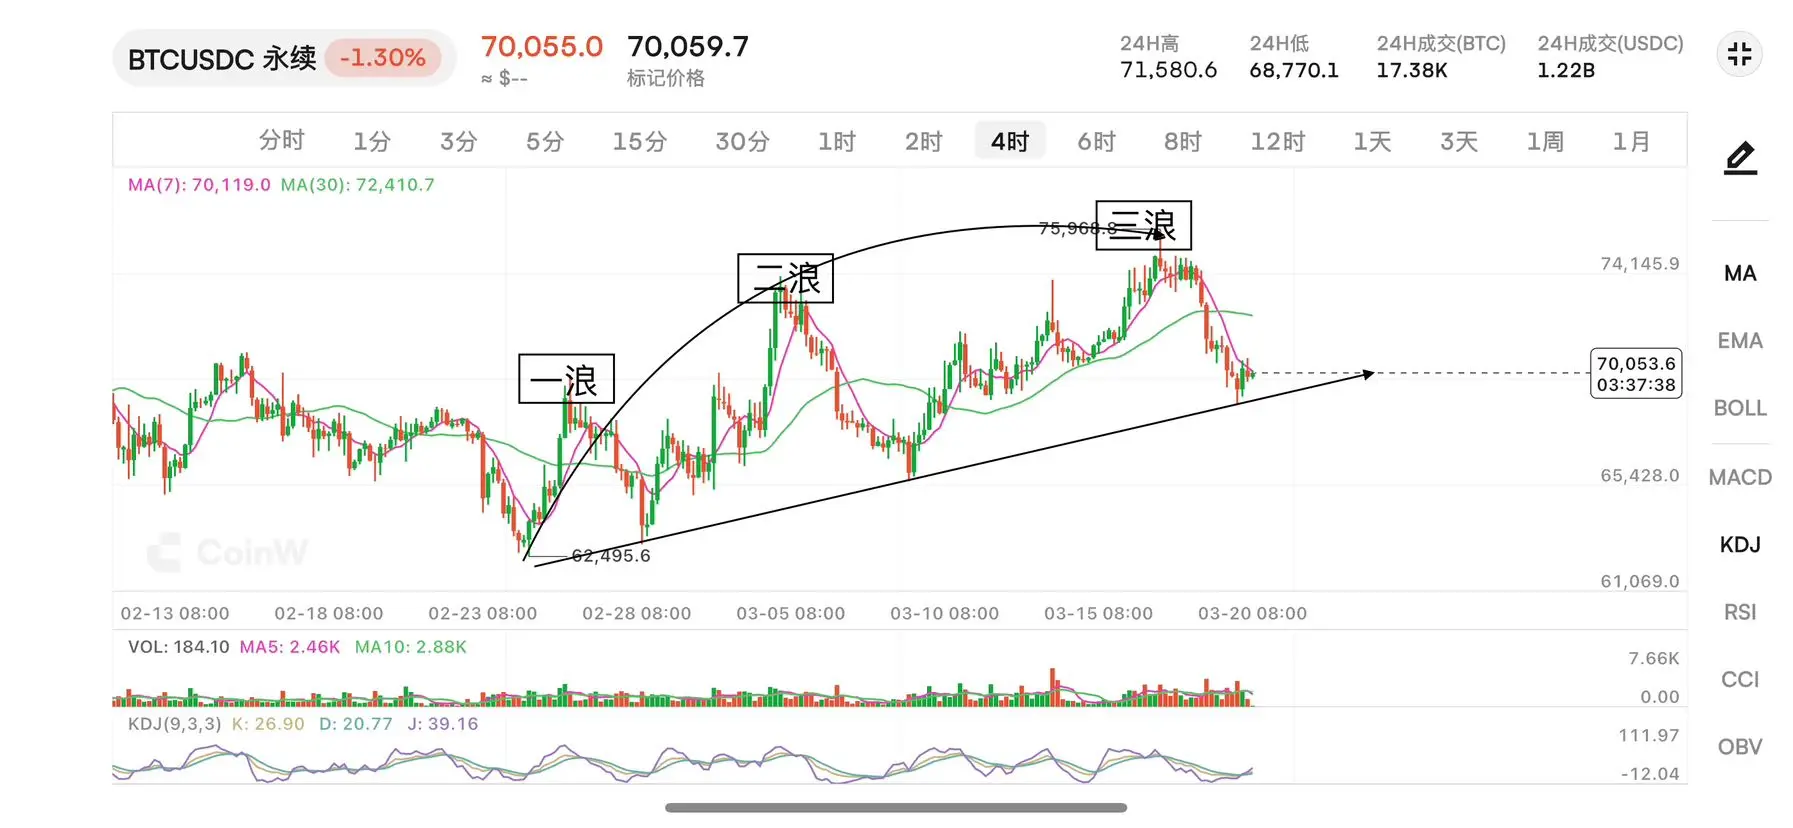
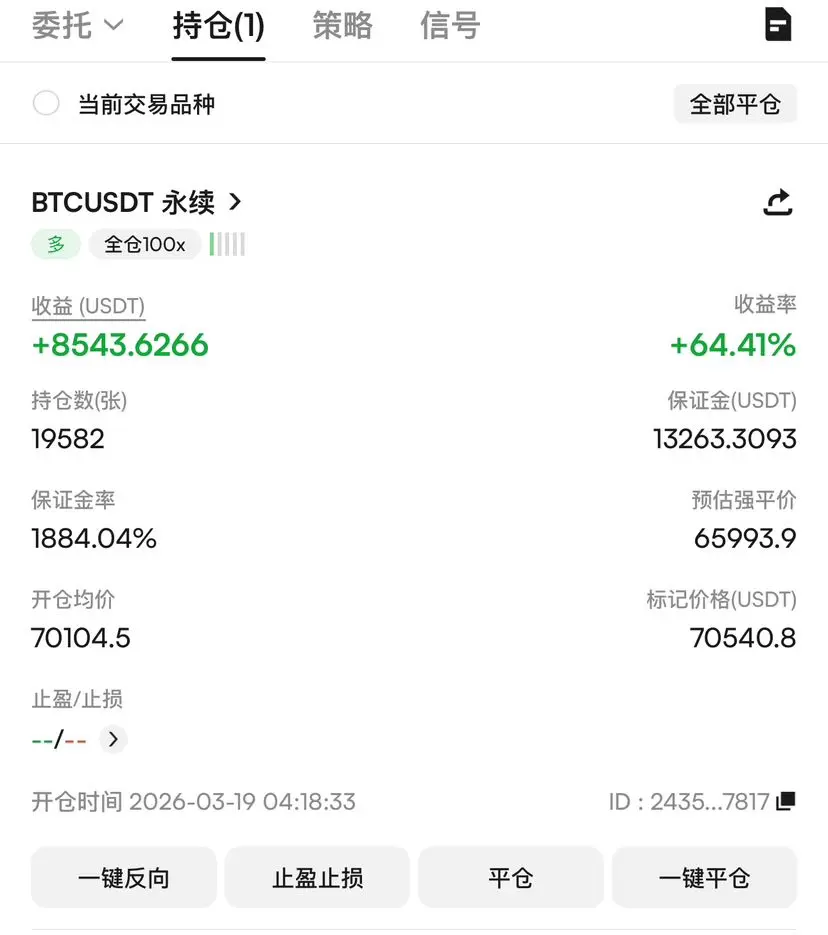
# Friday Morning Bitcoin 4-Hour Chart Analysis
After a three-wave rally and pullback, low-buy opportunities have emerged! Folks, here comes the real content! Today let's focus on this 4-hour candlestick chart and break down the market logic, structure, and opportunities for you!
First, the big picture: Standard three-wave rally, trend direction is crystal clear. Starting from the low of 62495 in late February, this move follows a textbook ascending three-wave structure:
**Wave 1:** Initiated from 62495.6, the first rally completes the trend reversal and establishes the bullish foundation
**Wav
查看原文After a three-wave rally and pullback, low-buy opportunities have emerged! Folks, here comes the real content! Today let's focus on this 4-hour candlestick chart and break down the market logic, structure, and opportunities for you!
First, the big picture: Standard three-wave rally, trend direction is crystal clear. Starting from the low of 62495 in late February, this move follows a textbook ascending three-wave structure:
**Wave 1:** Initiated from 62495.6, the first rally completes the trend reversal and establishes the bullish foundation
**Wav
- 讚賞
- 按讚
- 留言
- 轉發
- 分享
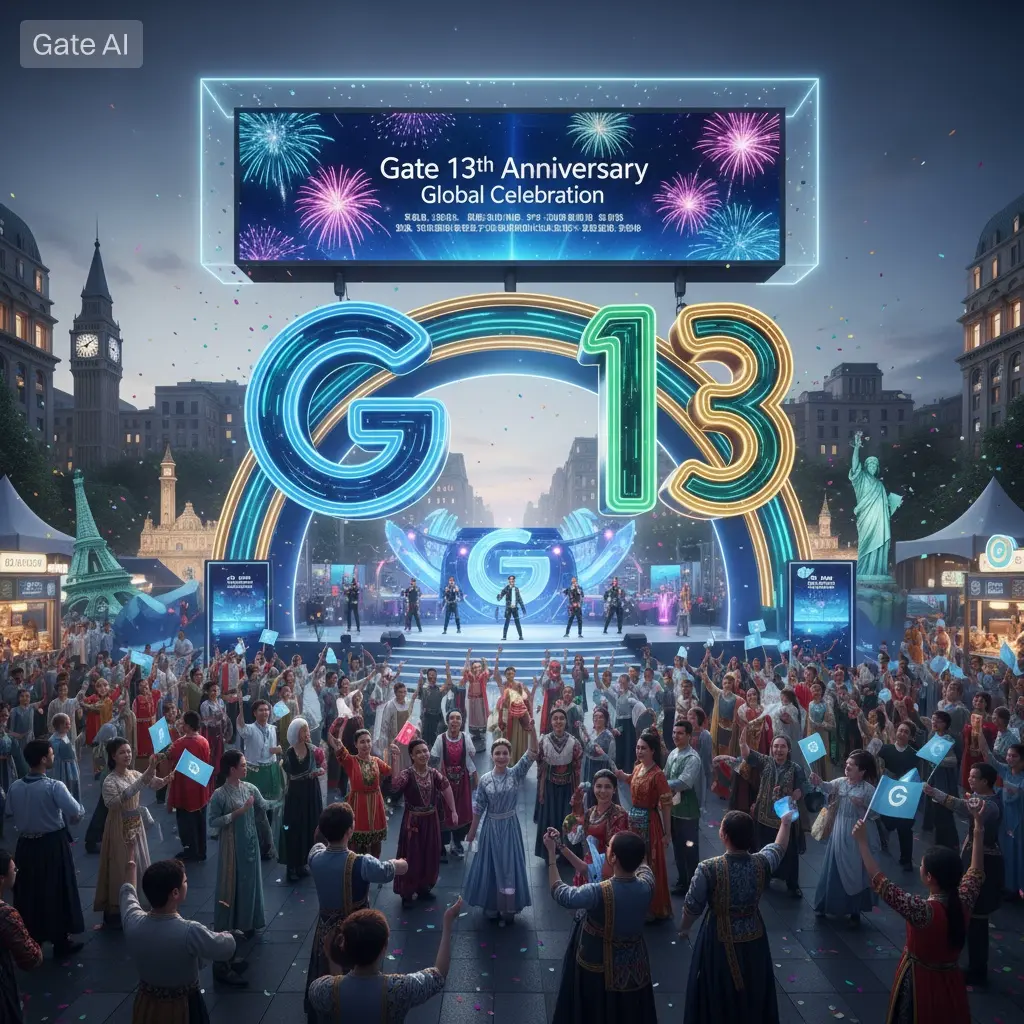
🚀 #Gate13週年全球慶祝
這不僅僅是一個週年紀念……這是一個正在進行中的遺產。
十三年前,當加密貨幣充滿不確定性、風險和誤解時——一個平台選擇了建設,而不是跟隨。
如今,這個願景已成為全球強國,受到數百萬人的信任。
🏆 13年。13堂課。一個真理:
在加密領域的生存不是運氣——而是信任、一致性和進化。
從早期比特幣時代到今天的AI驅動市場,Gate從未僅僅"存在"……
它已經適應、擴展並領先於前沿。
🌍 遠不止一個平台——一個生活的生態系統
這段旅程強大之處不僅在於增長——而在於轉變。
• 從簡單交易 → 到多資產強國
• 從工具 → 到智能AI系統
• 從用戶 → 到超過5000萬的全球社區
這不僅是進步。
這是大規模的重新發明。
💬 Gate廣場——聲音轉化為力量的地方
Gate廣場不僅僅是一個功能……它是心跳。
它是這樣的地方:✔ 想法變成策略
✔ 交易者成為創造者
✔ 像我這樣的聲音……真的很重要
每一篇帖子、每一份見解、每一次討論——
都在構建這個生態系統的力量。
🔐 建立在一個核心原則上:信任
在一個項目來來往往的市場中……
生存下來的是信譽。
經歷牛市、暴跌和不確定性——
Gate堅定不移。
不僅作為一個平台……
而且作為旅程每個階段的合作夥伴。
⚡ 轉變:從交易 → 到智能
最大的進化是什麼?
我們不再只是手動交易。
我們正在進入一個時代:🧠 AI
BTC-1.17%
- 讚賞
- 2
- 2
- 轉發
- 分享
楚老魔 :
:
2026衝衝衝 👊查看更多
⚡️ 剛剛消息:據華爾街日報報導,傑夫·貝索斯正處於早期洽談階段,籌集$100 億美元,用於一個專注於晶片製造、國防和航空航天公司的AI驅動製造基金。#crypto
查看原文
- 讚賞
- 按讚
- 留言
- 轉發
- 分享
🎉 慶祝13年創新:您通往iWeb3的大門!🎉
Gate非常高興地宣布我們全球13週年慶典的啟動!🥳 從一個具有遠見的想法到一個全面的數字資產生態系統,我們將以一系列精彩的全球活動來慶祝這個令人難以置信的里程碑。
加入我們,一起連接過去與未來:
🥂 13週年專屬主題晚宴
🏆 高風險全球交易比賽
🌐 亮相巴黎區塊鏈周和香港Web3嘉年華等頂級行業盛事。
我們不僅在慶祝我們的歷史,更在與全球社群共同創造加密貨幣的未來:「你通往iWeb3的大門」。
---
🏆 13年來的里程碑亮點:
🚀 全球領導地位:擁有超過5000萬用戶信賴,提供超過4500種資產及深厚的流動性。
📊 安全性無妥協:我們的現貨與衍生品交易量始終位居全球前列,並由堅實的125%儲備金比率支撐。
🔐 信任與合規:我們建立了完善的合規架構,確保在全球主要市場的穩固地位。
---
🤖 未來已來:Gate for AI
我們正不斷突破可能性的界限。今年,我們將引領下一個時代,推出Gate for AI,利用六大核心能力,讓AI代理能在封閉循環中實現自主交易。
⚡️ 創新實踐:
· GateRouter:您的全球領先大型語言模型的統一入口。
· GateClaw:讓複雜策略更易獲取,實現智能交易的民主化。
從領先的交易平台到完整的數字資產生態系統,Gate正不斷強化基礎建設、擴展全球版圖,並持續推動創新。
查看原文Gate非常高興地宣布我們全球13週年慶典的啟動!🥳 從一個具有遠見的想法到一個全面的數字資產生態系統,我們將以一系列精彩的全球活動來慶祝這個令人難以置信的里程碑。
加入我們,一起連接過去與未來:
🥂 13週年專屬主題晚宴
🏆 高風險全球交易比賽
🌐 亮相巴黎區塊鏈周和香港Web3嘉年華等頂級行業盛事。
我們不僅在慶祝我們的歷史,更在與全球社群共同創造加密貨幣的未來:「你通往iWeb3的大門」。
---
🏆 13年來的里程碑亮點:
🚀 全球領導地位:擁有超過5000萬用戶信賴,提供超過4500種資產及深厚的流動性。
📊 安全性無妥協:我們的現貨與衍生品交易量始終位居全球前列,並由堅實的125%儲備金比率支撐。
🔐 信任與合規:我們建立了完善的合規架構,確保在全球主要市場的穩固地位。
---
🤖 未來已來:Gate for AI
我們正不斷突破可能性的界限。今年,我們將引領下一個時代,推出Gate for AI,利用六大核心能力,讓AI代理能在封閉循環中實現自主交易。
⚡️ 創新實踐:
· GateRouter:您的全球領先大型語言模型的統一入口。
· GateClaw:讓複雜策略更易獲取,實現智能交易的民主化。
從領先的交易平台到完整的數字資產生態系統,Gate正不斷強化基礎建設、擴展全球版圖,並持續推動創新。

- 讚賞
- 按讚
- 留言
- 轉發
- 分享
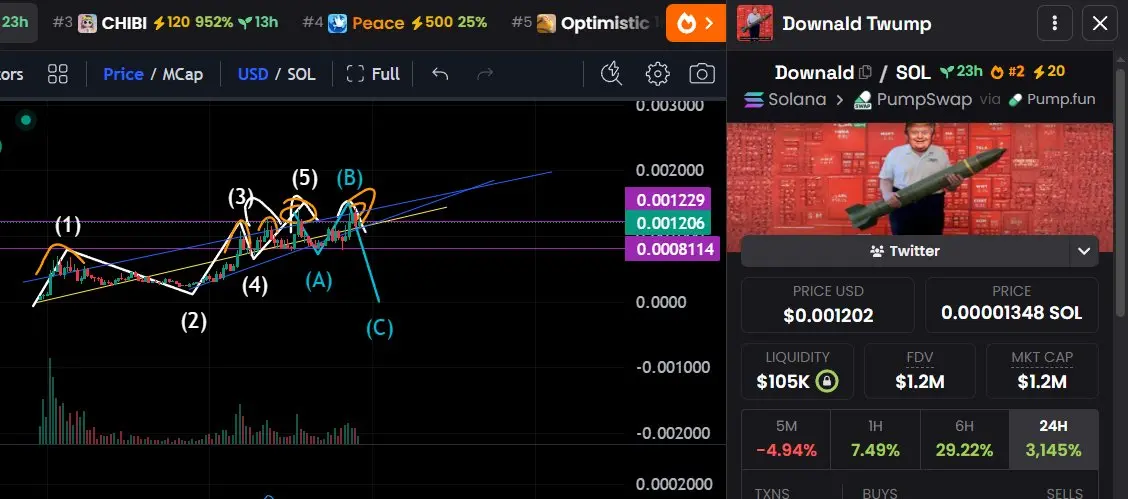
他們對我嚴厲處罰
$DOWNALD
查看原文$DOWNALD
- 讚賞
- 按讚
- 留言
- 轉發
- 分享
🚨 大資金在快速移動 🚨
貝萊德的質押以太坊信託在第一周就吸收了 $254M AUM——在 $146M 的新淨流入之上,還有 $100M 的種子資金。
這不是散戶炒作。
這是機構定位。
關鍵要點:
• 質押收益正成為主要敘事
• 傳統金融開始適應ETH敞口
• 對收益和安全性的需求推動資金流動
聰明錢不是在追逐——而是在配置。
你在密切關注還是反應遲緩? 👀
#ETH #CryptoUpdate #Gate13thAnniversaryGlobalCelebration #TradFiIntroducesMultiLeverageFirst #FedHoldsRatesSteady
貝萊德的質押以太坊信託在第一周就吸收了 $254M AUM——在 $146M 的新淨流入之上,還有 $100M 的種子資金。
這不是散戶炒作。
這是機構定位。
關鍵要點:
• 質押收益正成為主要敘事
• 傳統金融開始適應ETH敞口
• 對收益和安全性的需求推動資金流動
聰明錢不是在追逐——而是在配置。
你在密切關注還是反應遲緩? 👀
#ETH #CryptoUpdate #Gate13thAnniversaryGlobalCelebration #TradFiIntroducesMultiLeverageFirst #FedHoldsRatesSteady
ETH-2.1%

- 讚賞
- 按讚
- 留言
- 轉發
- 分享
ElizaOSv2
全新AI开源框架
創建人@gatefunuser_e839
上市進度
0.49%
市值:
$2389.4
更多代幣
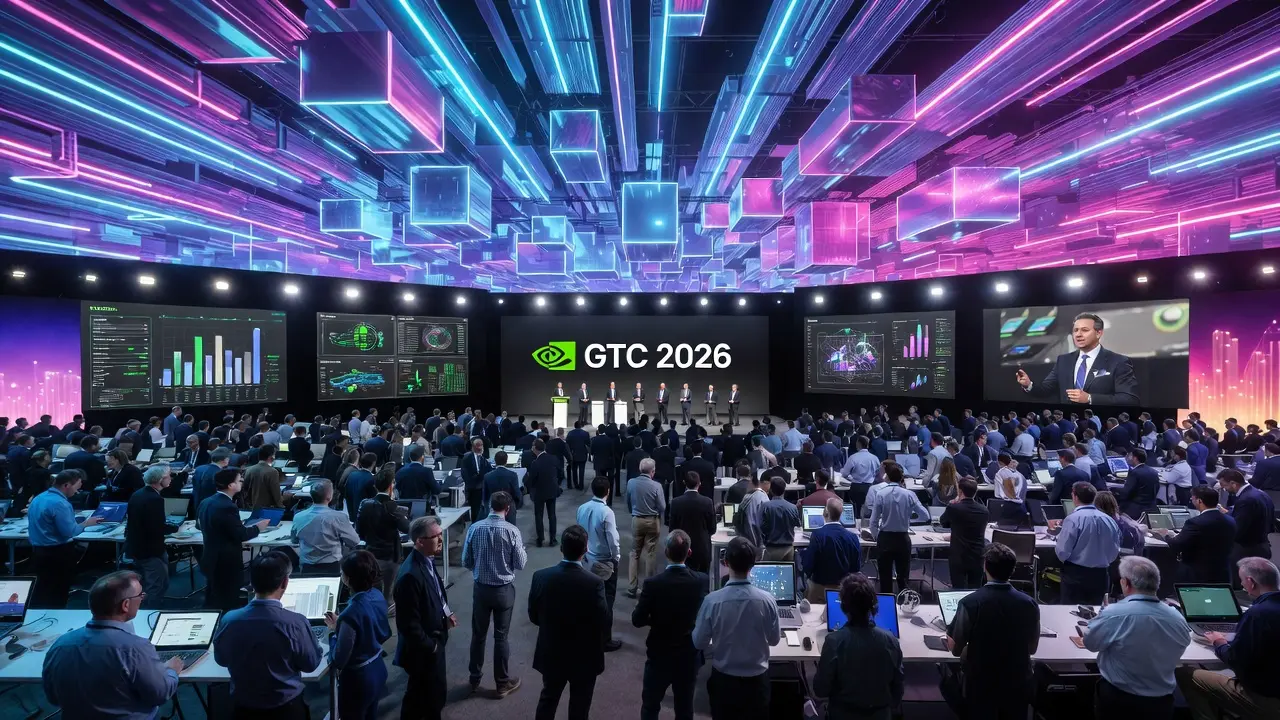
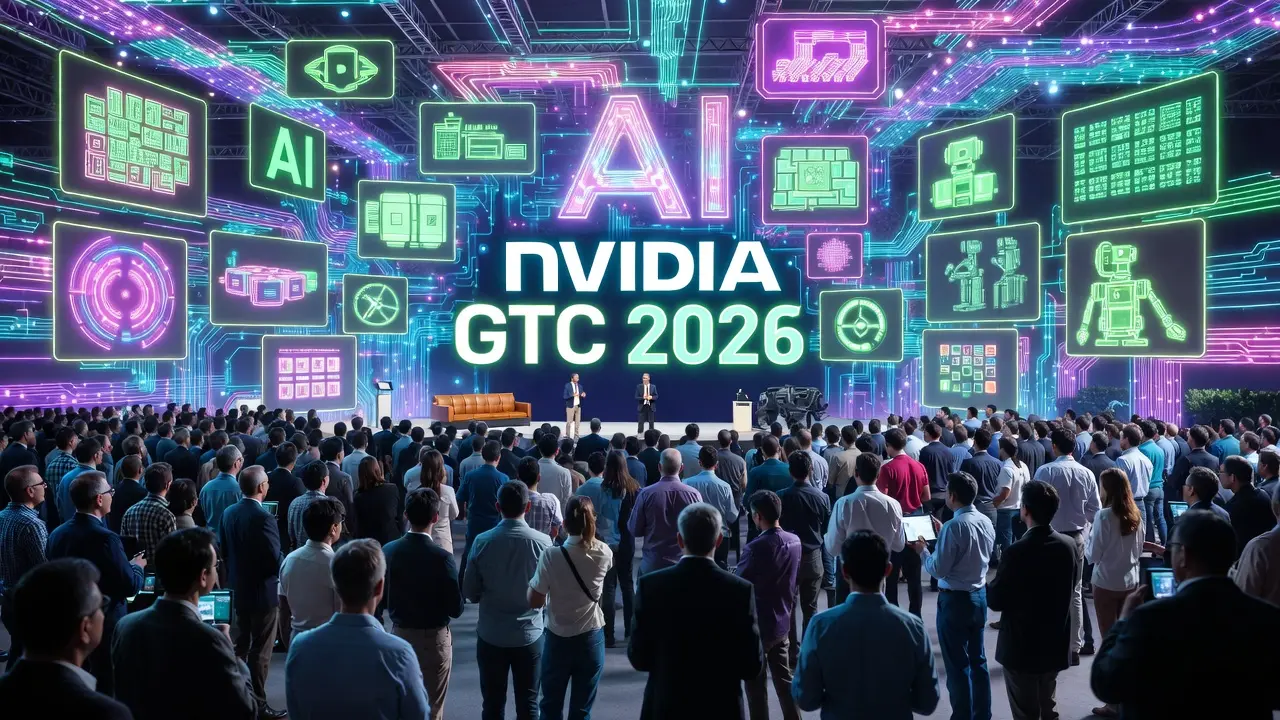
#NvidiaGTC2026ConferenceBegins 科技界正在热议備受期待的Nvidia GTC 2026大会正式启幕,承诺为AI、图形处理和计算创新的未来提供一瞥。这场虚拟和线下相结合的全球盛会,汇聚了来自世界各地的开发者、研究人员和科技爱好者,预计将展示Nvidia最新的突破性进展,并为下一波AI驱动的解决方案奠定基调。
Nvidia已将自己定位于人工智能和GPU技术的前沿,GTC 2026也不例外。与会者可以期待一系列主题演讲、技术会议和现场演示,展示AI、机器学习、机器人技术和数据中心解决方案的进步。今年的主要关注点之一是将AI集成到日常应用中,从创意工具和游戏到企业解决方案和自主系统。Nvidia首席执行官将发表开幕主题演讲,提供对公司在未来十年AI创新战略愿景的深入了解。
GTC 2026的一个突出主题是Nvidia AI软件生态系统的扩展。该公司正在推出Nvidia AI Enterprise的更新,旨在使企业能够利用AI完成数据分析、预测建模和自然语言处理等复杂任务。开发者可以期待更强大的工具来更高效地构建AI模型,包括对大型语言模型、生成式AI和高级计算机视觉应用的支持。这些创新旨在加速工作流程、降低计算成本,并为AI在各行业的采用开辟新的可能性。
游戏和图形爱好者也有很多值得期待的东西。Nvidia预计将发布新的GPU和技术,突破实时光线追踪、渲染和
查看原文Nvidia已将自己定位于人工智能和GPU技术的前沿,GTC 2026也不例外。与会者可以期待一系列主题演讲、技术会议和现场演示,展示AI、机器学习、机器人技术和数据中心解决方案的进步。今年的主要关注点之一是将AI集成到日常应用中,从创意工具和游戏到企业解决方案和自主系统。Nvidia首席执行官将发表开幕主题演讲,提供对公司在未来十年AI创新战略愿景的深入了解。
GTC 2026的一个突出主题是Nvidia AI软件生态系统的扩展。该公司正在推出Nvidia AI Enterprise的更新,旨在使企业能够利用AI完成数据分析、预测建模和自然语言处理等复杂任务。开发者可以期待更强大的工具来更高效地构建AI模型,包括对大型语言模型、生成式AI和高级计算机视觉应用的支持。这些创新旨在加速工作流程、降低计算成本,并为AI在各行业的采用开辟新的可能性。
游戏和图形爱好者也有很多值得期待的东西。Nvidia预计将发布新的GPU和技术,突破实时光线追踪、渲染和
- 讚賞
- 1
- 3
- 轉發
- 分享
CryptoChampion :
:
2026 GOGOGO 👊查看更多


- 讚賞
- 按讚
- 留言
- 轉發
- 分享
@全体成員 gm 注意 持幣飛 $CHIBIFY 起飛了
#CHIBIFY 中文讀 持幣飛呀 你品你細品
DDDD
DYOR
0xfb8357eea11bf241ddbe92903932e38f20df4444
查看原文#CHIBIFY 中文讀 持幣飛呀 你品你細品
DDDD
DYOR
0xfb8357eea11bf241ddbe92903932e38f20df4444

- 讚賞
- 按讚
- 留言
- 轉發
- 分享
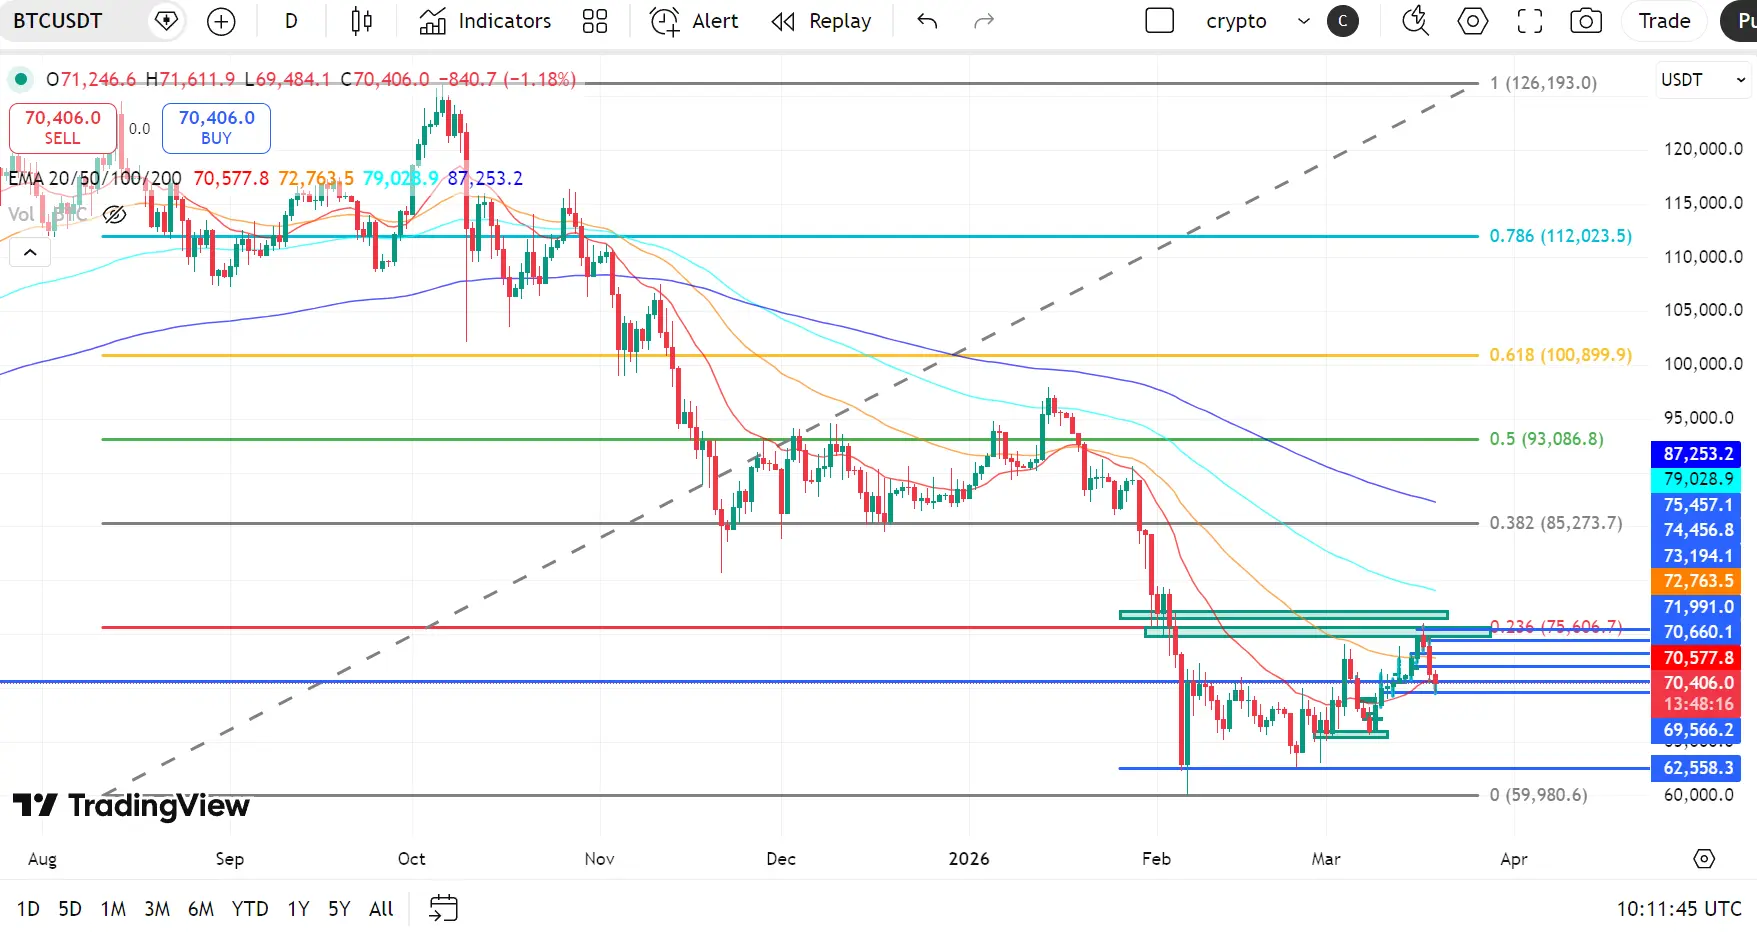
BTC 技術前景:阻力位拒絕保持市場有序下跌趨勢
比特幣在更高時間框架上仍然結構性看跌,但短期價格走勢顯示在從 $60K 區域反彈後的整固。近期在阻力位附近的拒絕表明賣家目前仍然掌控著市場。
目前,BTC 交易價格約在 $70.4K,略低於關鍵阻力集群。
EMA 結構 ( 看跌排列 )
20 EMA:$70,577
50 EMA:$72,763
100 EMA:$79,028
200 EMA:$87,253
價格在 20 及 50 EMA 下方掙扎,表明短期動能疲弱。
所有 EMA 呈看跌排列 ( 20 < 50 < 100 < 200 ),確認更廣泛的趨勢仍向下。
$72K– $73K 區域 ( 50 EMA ) 充當直接動態阻力。
斐波那契比例與市場結構
0.786 Fib:$112K
0.618 Fib:$100.8K
0.5 Fib:$93K
0.382 Fib:$85K
0.236 Fib:$75.6K
Fib 0:$59.9K
BTC 目前低於 0.236 斐波那契位準 ( $75.6K ),使市場處於低結構區域。
近期價格走勢顯示:
從 $72K– $73K 阻力位拒絕
$69K 支撐位上方整固
這在 $69K–$72K 之間形成緊密區間,表示決策區域。
RSI 動能
RSI 約在 49–51,處於中性區域。
這反映出猶豫不決 —— 目前既無強勢看漲動能
BTC-1.17%
- 讚賞
- 1
- 留言
- 轉發
- 分享
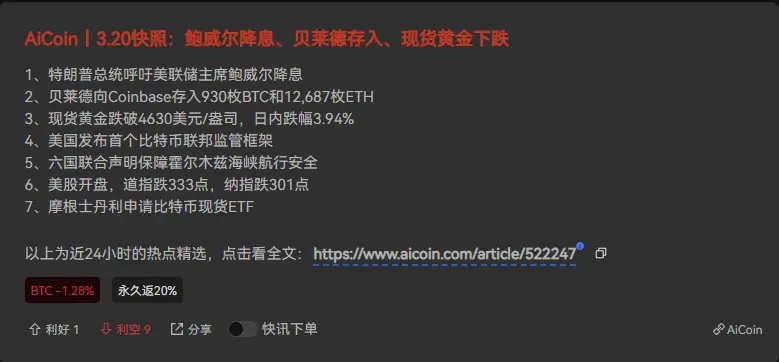
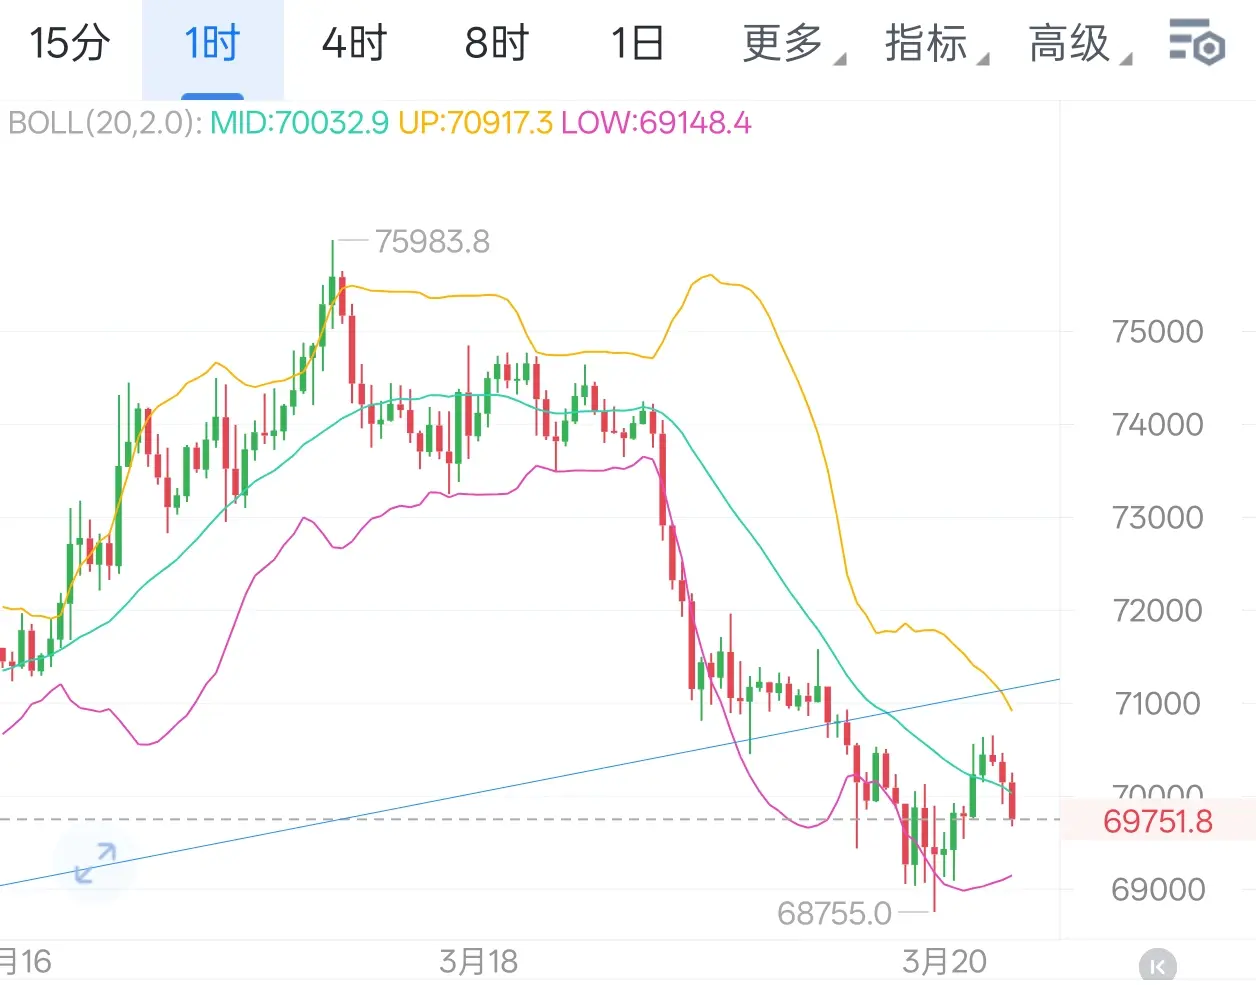
3.20早間分析:
大餅連續大陰線空頭主導不改,反彈高空為主
昨日空頭如期發力,行情再度兌現預判,今日操作依舊順勢而為。
從4小時走勢來看,大餅沖高刷新近期新高後,連續大陰線放量下挫,直接回踩下軌,近一週漲幅被盡數回吞,下行趨勢明確。MACD空頭動能持續放量,雖多頭依托下影線反復抵抗,但未能扭轉整體下行節奏,短期趨勢仍偏向空頭。
小時線層面,前期碎陰碎陽橫盤整理後,出現陰包陽形態吞沒反彈空間,價格進一步下探,最低觸及69700位置。當前雖有小幅觸底反彈,但本輪跌幅近七千點,盤面未出現有效企穩信號,空頭仍佔據絕對主導。
操作思路:趨勢看空不變,堅守反彈高空策略,切勿盲目抄底。
做空區間:70500-71000
目標位:68500,破位後可繼續下看#TradFi首创多倍杠杆 #美联储维持利率不变 $BTC $ETH
查看原文大餅連續大陰線空頭主導不改,反彈高空為主
昨日空頭如期發力,行情再度兌現預判,今日操作依舊順勢而為。
從4小時走勢來看,大餅沖高刷新近期新高後,連續大陰線放量下挫,直接回踩下軌,近一週漲幅被盡數回吞,下行趨勢明確。MACD空頭動能持續放量,雖多頭依托下影線反復抵抗,但未能扭轉整體下行節奏,短期趨勢仍偏向空頭。
小時線層面,前期碎陰碎陽橫盤整理後,出現陰包陽形態吞沒反彈空間,價格進一步下探,最低觸及69700位置。當前雖有小幅觸底反彈,但本輪跌幅近七千點,盤面未出現有效企穩信號,空頭仍佔據絕對主導。
操作思路:趨勢看空不變,堅守反彈高空策略,切勿盲目抄底。
做空區間:70500-71000
目標位:68500,破位後可繼續下看#TradFi首创多倍杠杆 #美联储维持利率不变 $BTC $ETH
- 讚賞
- 按讚
- 留言
- 轉發
- 分享
#Gate13thAnniversaryGlobalCelebration 全球加密貨幣社區齊聚一堂,慶祝Gate.io的一個重要里程碑——13週年紀念。十多年來,Gate.io已從一個不斷發展的數字資產平台演變為世界上最著名和最值得信賴的加密貨幣交易所之一。這個週年紀念不僅是對時間的慶祝,更是對韌性、創新和在不斷變化的金融格局中持續增長的證明。
自成立以來,Gate.io始終致力於提供安全、透明和高效的交易服務。在一個常常充滿波動性和不確定性的行業中,該平台通過優先考慮用戶安全、技術進步和合規性,成功建立了強大的信譽。多年來,它推出了包括現貨交易、期貨、質押、NFT和Web3服務在內的廣泛產品,成為初學者和專業交易者的一站式生態系統。
13週年慶祝活動彰顯了數百萬用戶參與該平台成功的歷程。Gate.io的全球覆蓋範圍已大幅擴大,為許多國家和地區的用戶提供服務。這種增長反映了全球數字資產和區塊鏈技術採用率的不斷提高。該交易所還通過提供人們訪問去中心化金融工具的機會,在促進金融包容性方面發揮了重要作用。
創新始終是Gate.io使命的核心。從推出新的交易功能到支持新興區塊鏈項目,該平台不斷適應市場趨勢。它對研究和開發的關注使其能夠在競爭激烈的加密貨幣行業中保持領先地位。週年慶祝活動預計將包括令人興奮的活動、獎勵、交易競賽和社區活動,為用戶提供積極參與和受益的機會。
Gate.io旅
查看原文自成立以來,Gate.io始終致力於提供安全、透明和高效的交易服務。在一個常常充滿波動性和不確定性的行業中,該平台通過優先考慮用戶安全、技術進步和合規性,成功建立了強大的信譽。多年來,它推出了包括現貨交易、期貨、質押、NFT和Web3服務在內的廣泛產品,成為初學者和專業交易者的一站式生態系統。
13週年慶祝活動彰顯了數百萬用戶參與該平台成功的歷程。Gate.io的全球覆蓋範圍已大幅擴大,為許多國家和地區的用戶提供服務。這種增長反映了全球數字資產和區塊鏈技術採用率的不斷提高。該交易所還通過提供人們訪問去中心化金融工具的機會,在促進金融包容性方面發揮了重要作用。
創新始終是Gate.io使命的核心。從推出新的交易功能到支持新興區塊鏈項目,該平台不斷適應市場趨勢。它對研究和開發的關注使其能夠在競爭激烈的加密貨幣行業中保持領先地位。週年慶祝活動預計將包括令人興奮的活動、獎勵、交易競賽和社區活動,為用戶提供積極參與和受益的機會。
Gate.io旅


- 讚賞
- 1
- 1
- 轉發
- 分享
楚老魔:
馬年發大財 🐴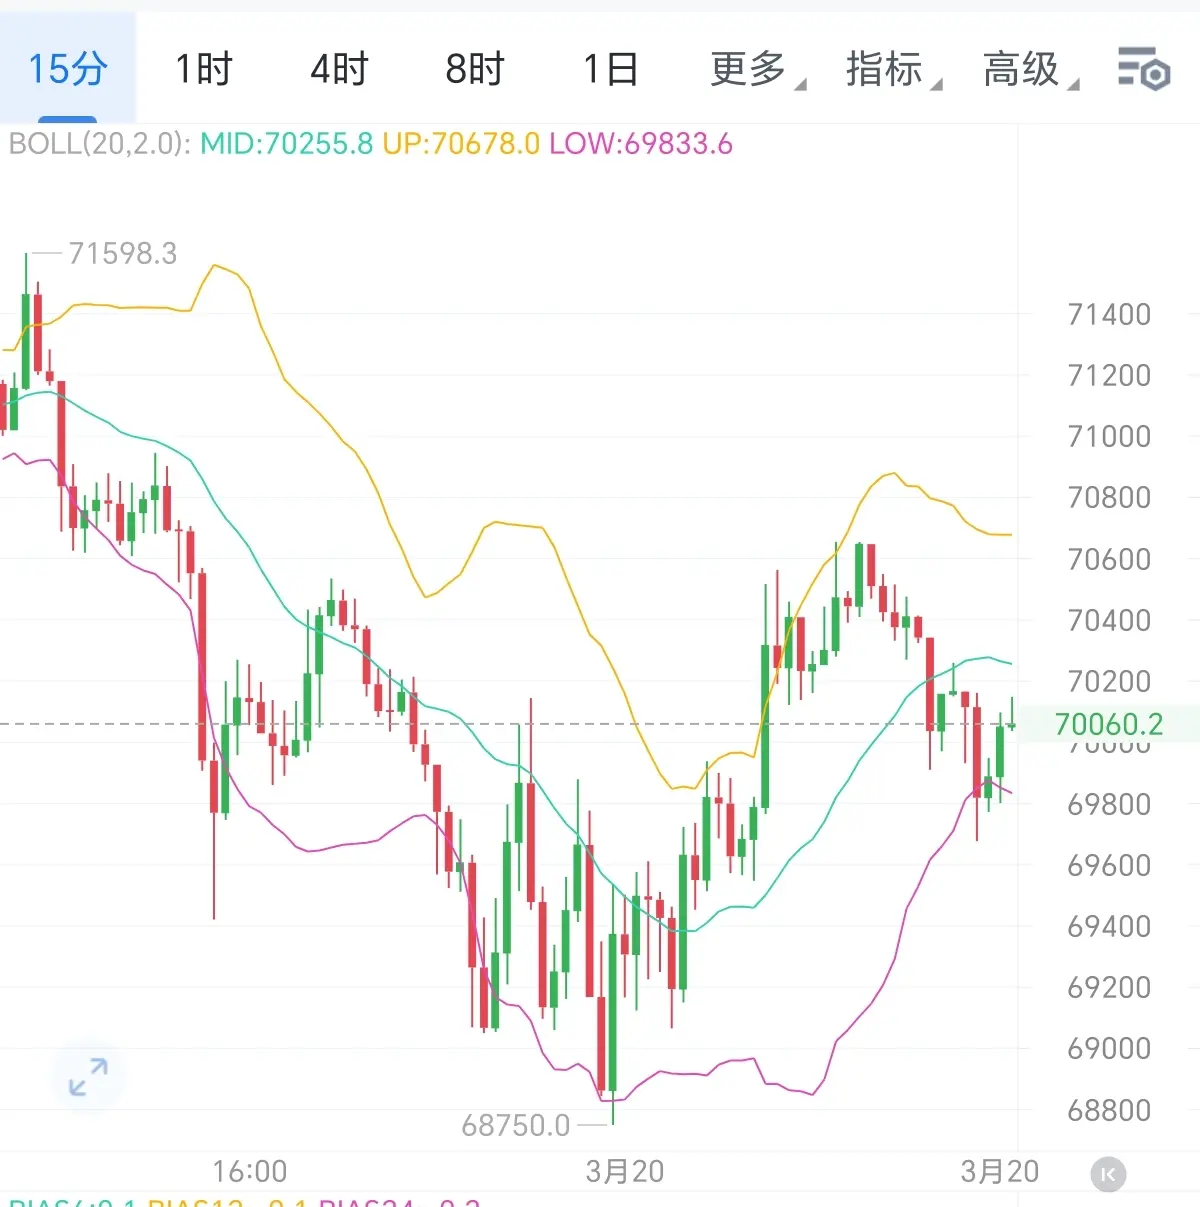
- 讚賞
- 按讚
- 留言
- 轉發
- 分享
Celebrating Gate's Thirteenth Anniversary
Thirteen years of wind and rain forged brilliance, Gate sets sail and rides the waves.
With unwavering original intent welcoming the tide, pioneer technology dares to take responsibility.
On-chain ecosystem unfolds grand vision, wallets and payments navigate all waters.
Security as shield with thousand-fold locks, transparent reserves showcase credibility.
Millions of global users gather, reputation flourishes across five continents and four seas.
Cross-border collaborations amplify momentum, Red Bull and Inter Milan share glory.
Web3 opens a new chapt
查看原文Thirteen years of wind and rain forged brilliance, Gate sets sail and rides the waves.
With unwavering original intent welcoming the tide, pioneer technology dares to take responsibility.
On-chain ecosystem unfolds grand vision, wallets and payments navigate all waters.
Security as shield with thousand-fold locks, transparent reserves showcase credibility.
Millions of global users gather, reputation flourishes across five continents and four seas.
Cross-border collaborations amplify momentum, Red Bull and Inter Milan share glory.
Web3 opens a new chapt


- 讚賞
- 1
- 1
- 轉發
- 分享
链策研习社一靖哥:
江郎才盡😂這回有機會精選了嘛加載更多
加入 4000萬 人匯聚的頭部社群
⚡️ 與 4000萬 人一起參與加密貨幣熱潮討論
💬 與喜愛的頭部創作者互動
👍 查看感興趣的內容
熱門話題
查看更多1669.29萬 熱度
54.23萬 熱度
254.07萬 熱度
1.96萬 熱度
44.37萬 熱度
熱門 Gate Fun
查看更多- 市值:$0.1持有人數:10.00%
- 市值:$0.1持有人數:10.00%
- 市值:$0.1持有人數:10.00%
- 市值:$0.1持有人數:10.00%
- 市值:$2313.79持有人數:10.00%
最新消息
查看更多置頂
📢 Gate 廣場創作者衝榜火熱開啟!
發文贏獎勵,瓜分 1,500 USDT 總獎池 🔥
活動採用 曝光、互動、交易三重積分制——獲得更多曝光、贏得用戶互動、帶動真實交易,每一項都能為你累積積分,讓優質內容被看見、被獎勵。
✅ 總榜大獎:Top 10 創作者分享 1,050 USDT
✅ 新人 & 回歸激勵:5 位潛力作者各得 30 USDT
✅ 深度內容獎:6 篇優質長文各獲 50 USDT
📅 活動時間:3 月 19 日 - 4 月 4 日
📍 報名鏈接:https://www.gate.com/questionnaire/7494
📄 活動詳情:https://www.gate.com/zh/announcements/article/50265
原創內容、深度思考、真實互動——讓創作更有價值。
#Gate广场 #GateSquare #创作者冲榜 #内容挖矿福利加码,Gate 廣場明星帶單交易員三期招募開啟!
入駐發帖 · 瓜分 $30,000 月度獎池 & 千萬級流量扶持!
如何參與:
1️⃣ 報名成為跟單交易員:https://www.gate.com/copytrading/lead-trader-registration/futures
2️⃣ 報名活動:https://www.gate.com/questionnaire/7355
3️⃣ 入駐 Gate 廣場,持續發布交易相關原創內容
豐厚獎勵等你拿:
首發優質內容即得 $30 跟單體驗金
每雙周瓜分 $10,000U 內容獎池
Top 10 交易員額外瓜分 $20,000U 登榜獎池
精選帖推流、首頁推薦、周度明星交易員曝光
詳情:https://www.gate.com/announcements/article/50291Gate Booster 第 4 期:發帖瓜分 1,500 $USDT
🔹 發布 TradFi 黃金福袋原創內容,可得 15 $USDT,名額有限先到先得
🔹 本期支持 X、YouTube 發布原創內容
🔹 無需複雜操作,流程清晰透明
🔹 流程:申請成為 Booster → 領取任務 → 發布原創內容 → 回鏈登記 → 等待審核及發獎
📅 任務截止時間:03月20日16:00(UTC+8)
立即領取任務:https://www.gate.com/booster/10028?pid=allPort&ch=KTag1BmC
更多詳情:https://www.gate.com/announcements/article/50203🤖 尋找 Gate 廣場 AI 評測官!$50,000 懸賞令發布!
發帖聊 AI,獎金拿到手軟!新人首帖獎勵翻倍,單帖最高 200U!
📝 立即報名:https://www.gate.com/questionnaire/7477
1️⃣ 發帖得紅包,單帖最高 100U!
2️⃣ Top 體驗分享官:帶 #Gate广场AI测评官 聊技巧,贏國米球衣!
3️⃣ 收益率 PK 王:曬 AI 收益截圖,贏 Gate 定制運動套裝!
4️⃣ 深度好文額外加碼 30U 每篇張榜公布!
💬 來 Gate 廣場,把握行業新趨勢:https://www.gate.com/post
時間:3/12 18:00 – 3/27 24:00 (UTC+8)
詳情:https://www.gate.com/announcements/article/50206Gate 廣場內容挖礦獎勵繼續升級!無論您是創作者還是用戶,挖礦新人還是頭部作者都能贏取好禮獲得大獎。現在就進入廣場探索吧!
創作者享受最高60%創作返佣
創作者獎勵加碼1500USDT:更多新人作者能瓜分獎池!
觀眾點擊交易組件交易贏大禮!最高50GT等新春壕禮等你拿!
詳情:https://www.gate.com/announcements/article/49802