Прогноз цены DRV на 2025 год: анализ рыночных тенденций и перспектив роста для инвесторов
Введение: рыночная позиция DRV и инвестиционная привлекательность
Derive (DRV) — инновационный проект, перенесший рынок опционов на блокчейн и занявший лидирующие позиции с момента запуска. К 2025 году капитализация Derive составляет 36,61 млн долларов США, в обращении — примерно 854 025 584 токена, текущая цена — около 0,04287 долларов США. Этот актив, признанный «лидером рынка ончейн-опционов», играет все более заметную роль в развитии децентрализованных финансов (DeFi) и рынке ончейн-деривативов.
В статье представлен подробный анализ динамики цен Derive в 2025–2030 годах: учитываются исторические тенденции, баланс спроса и предложения, развитие экосистемы и макроэкономические факторы. Материал содержит профессиональные прогнозы и практические инвестиционные стратегии для инвесторов.
I. История цены DRV и текущая рыночная ситуация
Динамика цены DRV: исторический обзор
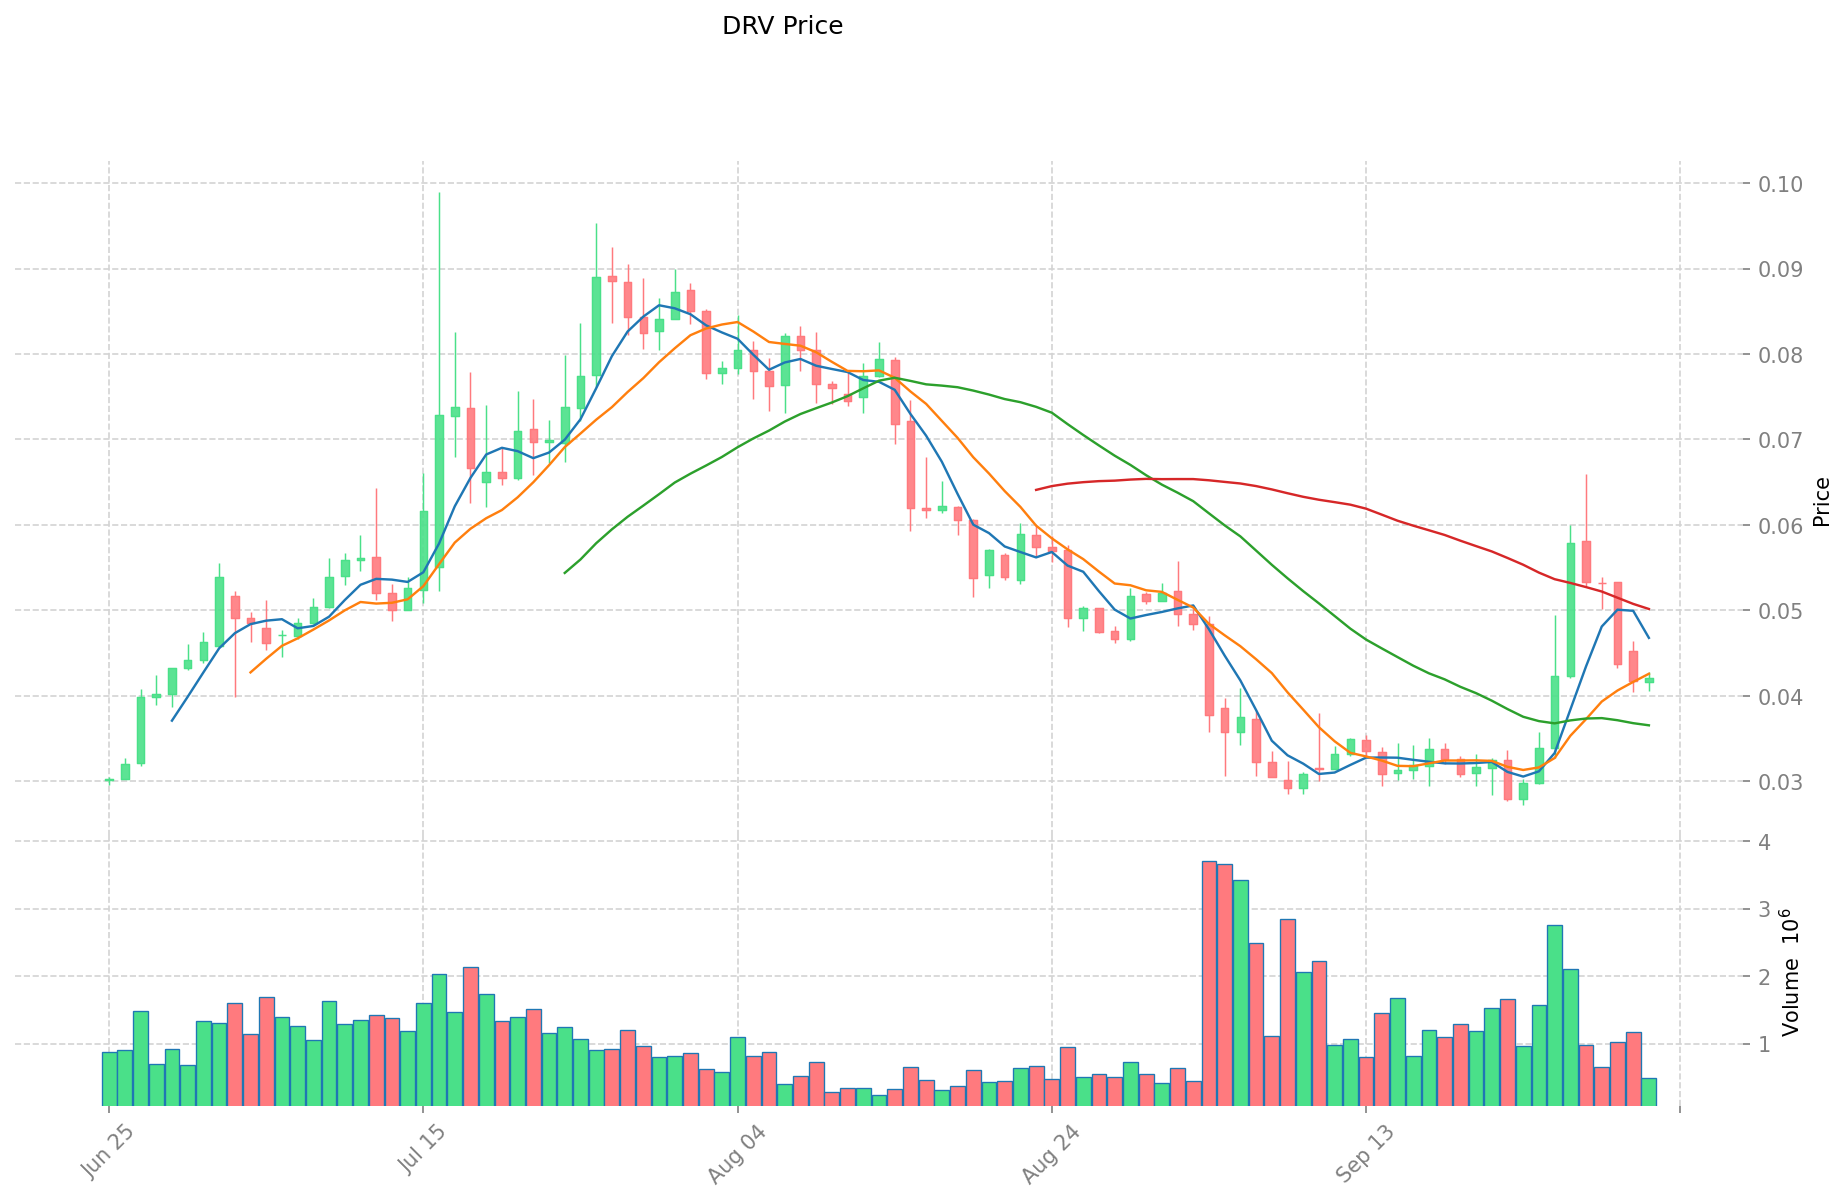
- 2025 (январь): 15 января DRV достиг исторического максимума — 0,9 долларов США
- 2025 (апрель): 7 апреля токен зафиксировал исторический минимум — 0,01155 долларов США
- 2025 (октябрь): DRV проходит фазу восстановления, текущая цена — 0,04287 долларов США
Текущая рыночная ситуация DRV
На 2 октября 2025 г. DRV торгуется по 0,04287 долларов США. В краткосрочной перспективе токен демонстрирует положительный импульс: рост на 1,84% за последний час и на 3,4% за 24 часа. Особенно выражено недельное движение — рост на 26,97% за 7 дней. Однако в месяц и год наблюдаются негативные тенденции: снижение на 13,01% за 30 дней и падение на 92,38% по сравнению с аналогичным периодом прошлого года.
Текущая капитализация DRV — 36 612 076,79 долларов США, что соответствует 827 позиции в общем рейтинге криптовалют. В обращении — 854 025 584 токена DRV из максимального объема в 1 000 000 000, коэффициент обращения — 85,4%. Суточный объем торгов — 22 086,01 долларов США, что свидетельствует об умеренной рыночной активности.
Нажмите, чтобы посмотреть актуальную цену DRV
Индикатор рыночных настроений DRV
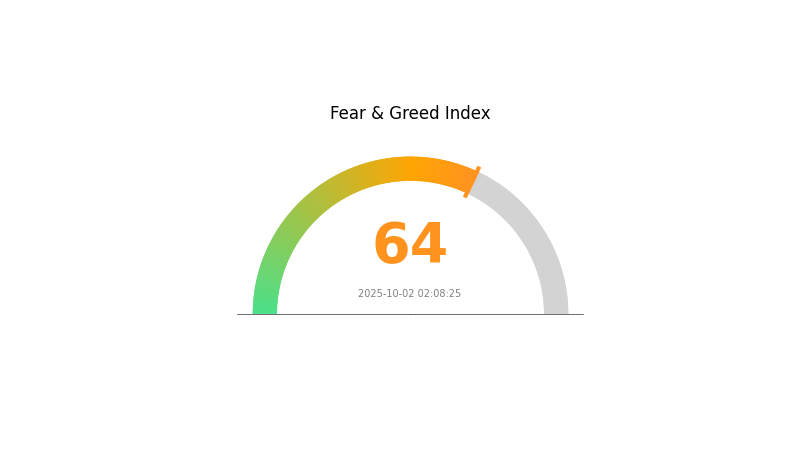
02 октября 2025 г. Индекс страха и жадности: 64 (Жадность)
Нажмите, чтобы посмотреть Индекс страха и жадности
В настоящий момент на криптовалютном рынке преобладает жадность — индекс достиг отметки 64. Это отражает рост оптимизма среди инвесторов и может способствовать дальнейшему росту цен. Однако важно проявлять осторожность: крайняя жадность часто приводит к рыночным коррекциям. Трейдерам рекомендуется фиксировать прибыль или хеджировать позиции, поскольку настроения могут быстро меняться. Следите за ситуацией и управляйте рисками. Gate.com предлагает инструменты для анализа текущих рыночных условий.
Структура владения токенами DRV
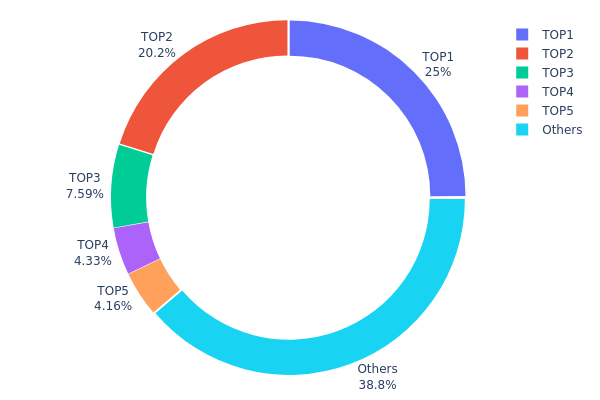
Анализ распределения токенов DRV показывает высокую концентрацию среди крупнейших адресов. Лидирующий держатель владеет 24,98% всего предложения, второй по объему — 20,16%. На эти два адреса приходится свыше 45% токенов DRV. Совокупно пять крупнейших адресов владеют 61,2% предложения, что свидетельствует о значительной централизации.
Такая концентрация вызывает опасения относительно рыночной манипуляции и волатильности: любые крупные транзакции этих держателей могут существенно изменить рыночную ситуацию. Высокая централизация также повышает риски внезапных изменений структуры предложения и снижает устойчивость ончейн-экосистемы DRV.
38,8% токенов распределены между остальными адресами, что указывает на относительно низкую степень децентрализации. Это может привести к колебаниям цены и снижению ликвидности для розничных участников. Мониторинг действий крупных адресов крайне важен для оценки будущих движений и состояния экосистемы DRV.
Нажмите, чтобы посмотреть актуальное распределение DRV
| Топ | Адрес | Количество токенов | Доля (%) |
|---|---|---|---|
| 1 | 0x2cde...48f00c | 82 728,86K | 24,98% |
| 2 | 0x246d...649fcf | 66 778,12K | 20,16% |
| 3 | 0xad30...72ff97 | 25 124,94K | 7,58% |
| 4 | 0xf0f2...3b5d56 | 14 343,25K | 4,33% |
| 5 | 0xd0cf...c0c641 | 13 770,64K | 4,15% |
| - | Остальные | 128 353,55K | 38,8% |
II. Ключевые факторы, влияющие на цену DRV в будущем
Макроэкономическая среда
- Влияние монетарной политики: решения центральных банков будут формировать глобальную экономику и рыночные настроения.
- Защитные свойства от инфляции: устойчивость DRV в период инфляции может стать важным фактором для инвесторов.
- Геополитические риски: неопределенность, протекционизм и международная напряженность способны усилить глобальные риски и изменить структуру спроса.
Техническое развитие и развитие экосистемы
- Технологические новшества: развитие электротранспорта для отдыха и литий-ионных аккумуляторов трансформирует отрасль, потенциально влияя на рынок DRV.
- Экосистемные приложения: рост располагаемых доходов, популярность автомобильных поездок и увеличение численности среднего класса в Северной Америке, Европе и Азиатско-Тихоокеанском регионе — ключевые драйверы расширения рынка.
III. Прогноз цены DRV на 2025–2030 годы
Прогноз на 2025 год
- Консервативный прогноз: 0,03044 – 0,04287 долларов США
- Нейтральный прогноз: 0,04287 – 0,05273 долларов США
- Оптимистичный прогноз: 0,05273 – 0,06259 долларов США (при благоприятных условиях и росте внедрения)
Прогноз на 2027–2028 годы
- Ожидаемая рыночная фаза: вероятен рост с увеличением волатильности
- Прогнозируемый диапазон цен:
- 2027: 0,03303 – 0,0679 долларов США
- 2028: 0,03807 – 0,07034 долларов США
- Ключевые драйверы: технологические инновации, расширение признания рынка, стратегические партнерства
Долгосрочный прогноз на 2030 год
- Базовый сценарий: 0,06055 – 0,08295 долларов США (при стабильном росте и внедрении)
- Оптимистичный сценарий: 0,08295 – 0,10451 долларов США (при ускоренном внедрении и благоприятной конъюнктуре)
- Трансформационный сценарий: выше 0,10451 долларов США (при появлении революционных кейсов и массовой интеграции)
- 31 декабря 2030 г.: DRV — 0,08295 долларов США (рост на 93% относительно 2025 года, что указывает на высокий потенциал роста)
| Год | Максимальная цена (прогноз) | Средняя цена (прогноз) | Минимальная цена (прогноз) | Динамика (%) |
|---|---|---|---|---|
| 2025 | 0,06259 | 0,04287 | 0,03044 | 0 |
| 2026 | 0,0696 | 0,05273 | 0,02742 | 23 |
| 2027 | 0,0679 | 0,06117 | 0,03303 | 42 |
| 2028 | 0,07034 | 0,06453 | 0,03807 | 50 |
| 2029 | 0,09846 | 0,06743 | 0,05732 | 57 |
| 2030 | 0,10451 | 0,08295 | 0,06055 | 93 |
IV. Профессиональные стратегии инвестирования и управления рисками для DRV
Инвестиционная стратегия DRV
(1) Стратегия долгосрочного владения
- Рекомендована для: инвесторов с высокой толерантностью к риску и долгосрочным горизонтом
- Практические советы:
- Покупайте DRV во время рыночных коррекций
- Устанавливайте минимальный срок владения — от 1 до 2 лет
- Храните токены в аппаратном кошельке
(2) Активная торговая стратегия
- Технические инструменты:
- Скользящие средние — определяют тренды и точки разворота
- Индекс относительной силы (RSI) — оценивает состояния перекупленности/перепроданности
- Важные аспекты свинг-трейдинга:
- Отслеживайте корреляцию DRV с основными криптовалютами
- Используйте строгие стоп-лоссы для ограничения потенциальных убытков
Фреймворк управления рисками DRV
(1) Принципы распределения активов
- Консервативные инвесторы: 1–3%
- Агрессивные инвесторы: 5–10%
- Профессиональные инвесторы: 10–15%
(2) Методы хеджирования рисков
- Опционные стратегии: используйте пут-опционы для защиты от снижения стоимости
- Диверсификация: распределяйте инвестиции между различными блокчейн-проектами
(3) Решения по безопасному хранению
- Рекомендуемый горячий кошелек: Gate Web3 Wallet
- Холодное хранение: аппаратные кошельки для долгосрочного хранения
- Меры безопасности: двухфакторная аутентификация, сложные уникальные пароли
V. Потенциальные риски и вызовы для DRV
Рыночные риски DRV
- Волатильность: резкие ценовые колебания, характерные для криптовалютного рынка
- Ликвидность: ограниченный объем торгов может привести к проскальзыванию цен
- Конкуренция: новые проекты опционов могут подорвать позиции DRV
Регуляторные риски DRV
- Регуляторная неопределенность: изменения в крипторегулировании могут ограничить деятельность DRV
- Трансграничное соответствие: различия международных норм могут затруднить глобальное распространение
- Налогообложение: неясность в отношении налогообложения токенов DRV в различных странах
Технические риски DRV
- Уязвимости смарт-контрактов: угрозы эксплуатации ошибок в коде
- Масштабируемость: перегрузка сети в периоды высокого спроса
- Интероперабельность: сложности интеграции с другими блокчейн-сетями
VI. Заключение и практические рекомендации
Оценка инвестиционного потенциала DRV
DRV обладает потенциалом на развивающемся рынке ончейн-опционов, однако сталкивается с высокой конкуренцией и неопределенностью регулирования. Краткосрочная волатильность неизбежна; долгосрочная перспектива зависит от рыночного принятия и технологических инноваций.
Рекомендации по инвестированию в DRV
✅ Новичкам: рассматривайте небольшие долгосрочные позиции после тщательного изучения проекта
✅ Опытным инвесторам: используйте стратегию усреднения и строгое управление рисками
✅ Институциональным инвесторам: включайте DRV в диверсифицированный криптопортфель, учитывая его уникальные рыночные преимущества
Варианты участия в DRV
- Спотовая торговля: покупка токенов DRV на Gate.com
- Стейкинг: участие в программах стейкинга DRV (при наличии)
- Интеграция с DeFi: изучайте возможности использования DRV в протоколах децентрализованных финансов
Инвестиции в криптовалюты сопряжены с крайне высокими рисками. Данный материал не является инвестиционной рекомендацией. Решения должны приниматься с учетом индивидуальной толерантности к риску, рекомендуется консультация с профильным финансовым специалистом. Никогда не инвестируйте больше, чем готовы потерять.
FAQ
Является ли DRV выгодной долгосрочной инвестицией?
DRV не рекомендуется для долгосрочного инвестирования. Инструмент ориентирован на краткосрочные сделки и предоставляет кредитное плечо к динамике рынка недвижимости.
Каков прогноз цены акций Nvidia на 2025 год?
По текущим прогнозам, цена акций Nvidia может достичь 200,52 долларов США за акцию к 30 октября 2025 года, что соответствует росту на 7,47% от текущих значений.
Насколько волатильна акция DRV?
Акция DRV отличается высокой волатильностью, дневное изменение достигает 10,22%. Как 3-кратный ETF, инструмент может демонстрировать значительные ценовые скачки за короткое время, что делает его крайне рискованным вложением.
Что такое DRV coin?
DRV — это Web3-криптовалюта на блокчейне Solana, известная быстрыми и дешевыми транзакциями. Она использует возможности Solana для эффективных переводов цифровых активов и работы децентрализованных приложений.
Пригласить больше голосов
Содержание
Введение: рыночная позиция DRV и инвестиционная привлекательность
I. История цены DRV и текущая рыночная ситуация
II. Ключевые факторы, влияющие на цену DRV в будущем
III. Прогноз цены DRV на 2025–2030 годы
IV. Профессиональные стратегии инвестирования и управления рисками для DRV
V. Потенциальные риски и вызовы для DRV
VI. Заключение и практические рекомендации
FAQ

