2025 ZKJ Price Prediction: Analyzing Market Trends and Potential Growth Factors
Introduction: ZKJ's Market Position and Investment Value
Polyhedra Network (ZKJ), as a pioneering project in Zero-Knowledge (ZK) Proofs for the Web3 industry, has made significant strides since its inception. As of 2025, Polyhedra Network's market capitalization stands at $21,443,066, with a circulating supply of approximately 401,555,555 tokens, and a price hovering around $0.0534. This asset, known as the "ZK Bridge innovator," is playing an increasingly crucial role in blockchain interoperability and scalability.
This article will provide a comprehensive analysis of Polyhedra Network's price trends from 2025 to 2030, combining historical patterns, market supply and demand, ecosystem development, and macroeconomic factors to offer professional price predictions and practical investment strategies for investors.
I. ZKJ Price History Review and Current Market Status
ZKJ Historical Price Evolution Trajectory
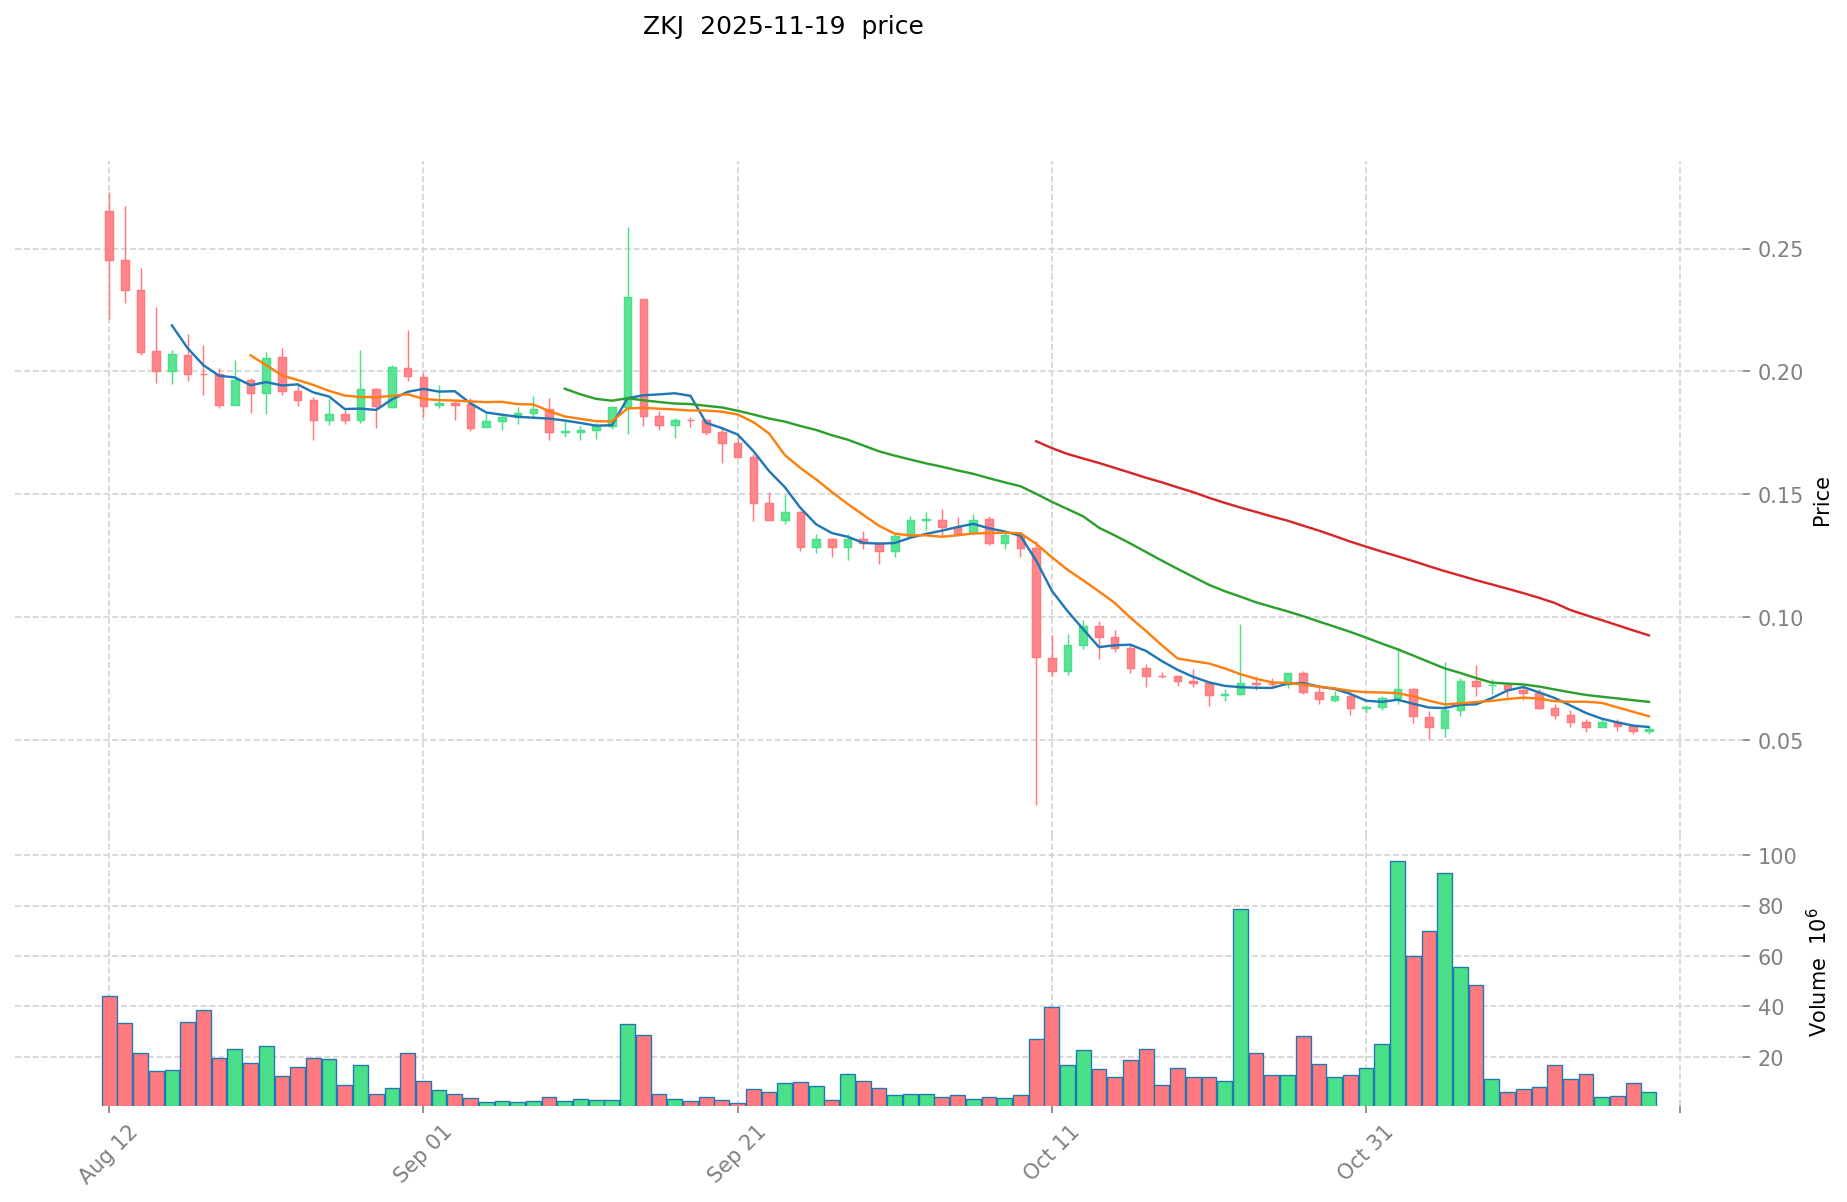
- 2024: ZKJ reached its all-time high of $100 on March 19, marking a significant milestone for the project.
- 2025: The market experienced a downturn, with ZKJ price dropping to its all-time low of $0.02323 on October 10.
ZKJ Current Market Situation
As of November 19, 2025, ZKJ is trading at $0.0534, with a 24-hour trading volume of $206,177.44. The token has seen a slight increase of 0.98% in the last 24 hours. However, it has experienced significant declines over longer periods, with a 17.01% decrease in the past week and a 30.01% drop over the last month. The most dramatic decline is visible in the yearly performance, with a 95.25% decrease from the previous year.
ZKJ's market capitalization currently stands at $21,443,066.64, ranking it 893rd in the overall cryptocurrency market. The circulating supply is 401,555,555 ZKJ tokens, which represents 40.16% of the total supply of 1,000,000,000 ZKJ. The fully diluted market cap is $53,400,000.
The token is currently trading significantly below its all-time high, indicating a challenging market environment for ZKJ. Despite the recent 24-hour gain, the overall trend remains bearish across multiple timeframes.
Click to view the current ZKJ market price
ZKJ Market Sentiment Indicator
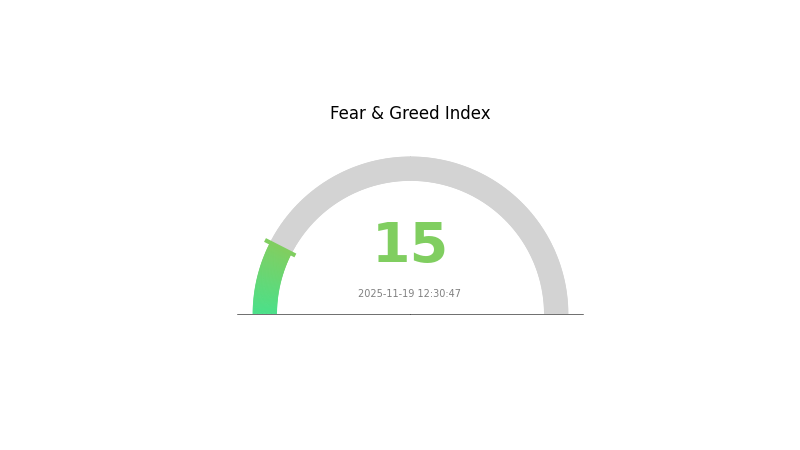
2025-11-19 Fear and Greed Index: 15 (Extreme Fear)
Click to view the current Fear & Greed Index
The crypto market is currently gripped by extreme fear, with the sentiment index plummeting to a mere 15. This stark reading indicates a significant level of anxiety among investors, potentially signaling an oversold market. While such extreme fear often precedes market bottoms, it's crucial to approach with caution. Savvy traders might see this as an opportunity to accumulate, adhering to the adage "be fearful when others are greedy, and greedy when others are fearful." However, always remember to conduct thorough research and manage risks prudently in these volatile times.
ZKJ Holdings Distribution
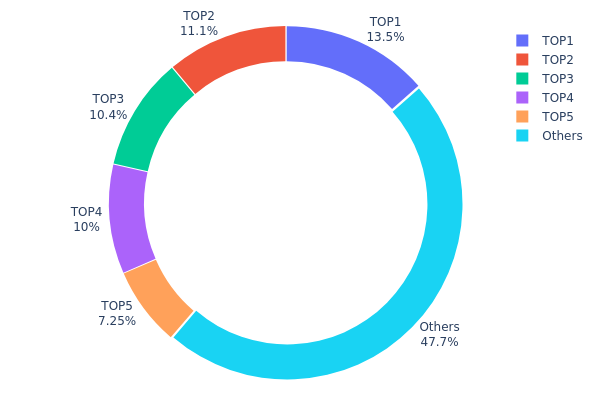
The address holdings distribution chart provides insights into the concentration of ZKJ tokens among different wallet addresses. Analysis of the data reveals a significant concentration of ZKJ tokens among the top holders. The top five addresses collectively control 52.27% of the total supply, with the largest holder possessing 13.53% of all tokens.
This level of concentration raises concerns about potential market manipulation and price volatility. With over half of the supply controlled by just five addresses, there is a risk of large-scale sell-offs or coordinated actions that could significantly impact ZKJ's market dynamics. The high concentration also suggests a lower degree of decentralization, which may be viewed unfavorably by some investors seeking more widely distributed token ecosystems.
However, it's worth noting that 47.73% of tokens are held by addresses outside the top five, indicating some level of distribution among smaller holders. This balance between major stakeholders and a broader base of smaller holders will be crucial to monitor for assessing the long-term stability and decentralization of the ZKJ network.
Click to view the current ZKJ Holdings Distribution
| Top | Address | Holding Qty | Holding (%) |
|---|---|---|---|
| 1 | 0x74df...34274a | 121805.56K | 13.53% |
| 2 | 0xe434...f1b6d8 | 100000.00K | 11.11% |
| 3 | 0xdb1a...4cee12 | 93194.44K | 10.35% |
| 4 | 0x6e41...113eb9 | 90277.78K | 10.03% |
| 5 | 0xb833...194d58 | 65277.78K | 7.25% |
| - | Others | 429444.44K | 47.73% |
II. Core Factors Affecting ZKJ's Future Price
Market Dynamics
- Supply and Demand: The balance between supply and demand is a primary driver of ZKJ's price.
- Market Liquidity: The ease with which ZKJ can be bought or sold affects its price stability.
Institutional and Whale Activity
- Large Address Operations: Actions of major holders or "whales" can significantly impact ZKJ's price movements.
Market Sentiment
- Investor Sentiment: Overall market mood and investor expectations play a crucial role in price fluctuations.
- Public Opinion: Media coverage and social media discussions can influence ZKJ's perceived value.
III. ZKJ Price Prediction for 2025-2030
2025 Outlook
- Conservative prediction: $0.03096 - $0.05338
- Neutral prediction: $0.05338 - $0.06432
- Optimistic prediction: $0.06432 - $0.07527 (requires favorable market conditions)
2026-2027 Outlook
- Market phase expectation: Gradual growth and consolidation
- Price range forecast:
- 2026: $0.05467 - $0.07526
- 2027: $0.05304 - $0.08724
- Key catalysts: Increased adoption and technological advancements
2028-2030 Long-term Outlook
- Base scenario: $0.07851 - $0.11349 (assuming steady market growth)
- Optimistic scenario: $0.11349 - $0.13080 (assuming accelerated adoption)
- Transformative scenario: $0.13080 - $0.16343 (assuming breakthrough innovations)
- 2030-12-31: ZKJ $0.16343 (potential peak)
| 年份 | 预测最高价 | 预测平均价格 | 预测最低价 | 涨跌幅 |
|---|---|---|---|---|
| 2025 | 0.07527 | 0.05338 | 0.03096 | 0 |
| 2026 | 0.07526 | 0.06432 | 0.05467 | 20 |
| 2027 | 0.08724 | 0.06979 | 0.05304 | 30 |
| 2028 | 0.11385 | 0.07851 | 0.06438 | 46 |
| 2029 | 0.1308 | 0.09618 | 0.05098 | 79 |
| 2030 | 0.16343 | 0.11349 | 0.08739 | 112 |
IV. Professional Investment Strategies and Risk Management for ZKJ
ZKJ Investment Methodology
(1) Long-term Holding Strategy
- Suitable for: Investors with a high-risk tolerance and belief in the long-term potential of zero-knowledge technology
- Operation suggestions:
- Accumulate ZKJ tokens during market dips
- Set price targets for partial profit-taking
- Store tokens securely in a hardware wallet
(2) Active Trading Strategy
- Technical analysis tools:
- Moving Averages: Use to identify trend directions and potential reversal points
- Relative Strength Index (RSI): Monitor overbought and oversold conditions
- Key points for swing trading:
- Monitor zkBridge adoption rates and transaction volumes
- Stay informed about Polyhedra Network's partnerships and integrations
ZKJ Risk Management Framework
(1) Asset Allocation Principles
- Conservative investors: 1-3% of crypto portfolio
- Aggressive investors: 5-10% of crypto portfolio
- Professional investors: Up to 15% of crypto portfolio
(2) Risk Hedging Solutions
- Diversification: Spread investments across multiple ZK-focused projects
- Stop-loss orders: Implement to limit potential losses
(3) Secure Storage Solutions
- Hot wallet recommendation: Gate Web3 Wallet
- Cold storage solution: Transfer to a hardware wallet for long-term holdings
- Security precautions: Enable two-factor authentication, use strong passwords, and regularly update software
V. Potential Risks and Challenges for ZKJ
ZKJ Market Risks
- High volatility: ZKJ price may experience significant fluctuations
- Competition: Other ZK-proof projects may gain market share
- Adoption concerns: Slow integration of zkBridge technology could impact token value
ZKJ Regulatory Risks
- Uncertain regulatory landscape: Potential for increased scrutiny of ZK technologies
- Cross-chain compliance: Regulatory challenges in managing multi-chain transactions
- Token classification: Risk of ZKJ being classified as a security in some jurisdictions
ZKJ Technical Risks
- Smart contract vulnerabilities: Potential for exploits in the zkBridge protocol
- Scalability challenges: Possible limitations in handling increased transaction volumes
- Interoperability issues: Complications in integrating with new blockchain networks
VI. Conclusion and Action Recommendations
ZKJ Investment Value Assessment
Polyhedra Network's ZKJ token presents a high-risk, high-reward opportunity in the emerging zero-knowledge proof sector. While the project's zkBridge technology shows promise for improving blockchain interoperability, investors should be aware of the significant market volatility and potential regulatory challenges.
ZKJ Investment Recommendations
✅ Beginners: Consider small, experimental positions after thorough research ✅ Experienced investors: Implement dollar-cost averaging strategy with strict risk management ✅ Institutional investors: Explore strategic partnerships and conduct in-depth technical due diligence
ZKJ Trading Participation Methods
- Spot trading: Available on Gate.com and other supported exchanges
- Staking: Participate in available staking programs to earn passive income
- DeFi integration: Explore decentralized finance protocols that support ZKJ tokens
Cryptocurrency investments carry extremely high risks, and this article does not constitute investment advice. Investors should make decisions carefully based on their own risk tolerance and are advised to consult professional financial advisors. Never invest more than you can afford to lose.
FAQ
What happened to the ZKJ coin?
The ZKJ coin crashed 63% after a major holder sold off. The price has since remained low, impacting investor confidence.
What is the price prediction for ZK in 2030?
Based on statistical models, ZK is projected to reach around $0.0024 by mid-2030 and approximately $0.003 by the end of 2030.
Which coin will reach $1 in 2030?
Bitcoin is projected to reach $1 million by 2030, based on market analysis and valuation frameworks similar to those used for companies like Uber.
Is ZKJ listed on Binance?
Yes, ZKJ is listed on Binance Alpha, a part of Binance's ecosystem, as of 2025-11-19.
Share
Content
Introduction: ZKJ's Market Position and Investment Value
I. ZKJ Price History Review and Current Market Status
II. Core Factors Affecting ZKJ's Future Price
III. ZKJ Price Prediction for 2025-2030
IV. Professional Investment Strategies and Risk Management for ZKJ
V. Potential Risks and Challenges for ZKJ
VI. Conclusion and Action Recommendations
FAQ

