Datos en cadena en Web3
Web3 es la próxima generación de Internet, con un enfoque descentralizado y orientado al usuario para la propiedad de los datos. La tecnología Blockchain es la base de muchas aplicaciones Web3 actuales. Este capítulo comienza con la definición y clasificación de los datos en cadena, analiza su valor y proporciona recomendaciones prácticas.
¿Qué son los datos en cadena?
Los datos en cadena se refieren a los datos que se registran en una cadena de bloques. Debido a que una cadena de bloques es una base de datos distribuida, los datos en la cadena están disponibles públicamente y cualquiera puede acceder a ellos.
Web3 y web2 son versiones diferentes de la World Wide Web, siendo web3 la versión más reciente y avanzada. Algunas diferencias clave entre los dos incluyen lo siguiente:
Web3 está descentralizado, mientras que web2 está centralizado. Esto significa que en web3, los datos y los servicios los proporciona una red distribuida de nodos, en lugar de una sola entidad. Esto hace que web3 sea más resistente y menos vulnerable a la censura o al fracaso, pero también más complejo y más difícil de controlar.
Web3 se basa en la tecnología blockchain, mientras que web2 se basa en la arquitectura tradicional cliente-servidor. Esto significa que en web3, los datos se almacenan y transfieren utilizando algoritmos criptográficos, en lugar de ser almacenados y transferidos por un servidor central. Esto hace que web3 sea más seguro y transparente, pero también más lento y costoso.
Web3 se enfoca en habilitar nuevos tipos de aplicaciones y servicios, mientras que web2 se enfoca en mejorar las aplicaciones y servicios existentes. Esto significa que web3 es más experimental y con visión de futuro, mientras que web2 es más maduro y establecido.

Estas diferencias tienen implicaciones sobre cómo se analizan los datos en cada entorno. En web3, el análisis de datos se centra más en comprender el comportamiento de las redes descentralizadas y la tecnología blockchain subyacente. Esto a menudo implica el uso de técnicas avanzadas como el aprendizaje automático y el análisis de redes para identificar patrones y tendencias en los datos. En web2, el análisis de datos está más centrado en comprender el comportamiento de los usuarios y las aplicaciones que utilizan. Esto a menudo implica el uso de técnicas tradicionales como el análisis estadístico y la visualización de datos para comprender el comportamiento del usuario e identificar tendencias e información.
Para realizar análisis de datos en cadena, deberá recopilar y organizar los datos relevantes y luego utilizar herramientas y técnicas como la visualización de datos y el análisis estadístico para identificar patrones y tendencias. Esto puede ayudarlo a comprender mejor el comportamiento de la red blockchain y sus usuarios, así como a hacer predicciones sobre la dirección futura del mercado. En algunos casos, es posible que también desee utilizar técnicas de aprendizaje automático para automatizar el proceso de análisis e identificar patrones más complejos en los datos.
Categorías de datos en cadena
Hay dos categorías de datos en cadena:
- Datos sin procesar
- Abstraído
Seleccionamos tales categorías porque, de hecho, todas las métricas calculadas son solo abstracciones sobre datos sin procesar. Los datos sin procesar en cadena se refieren a los datos sin procesar que se registran en la cadena de bloques. Estos datos incluyen información sobre transacciones individuales, como el remitente y el destinatario de la transacción y la cantidad de criptomoneda que se transfirió. Los datos económicos, por otro lado, se derivan de los datos sin procesar e incluyen información sobre la oferta y la demanda de una criptomoneda en particular, así como su capitalización de mercado y volumen de negociación.

Los datos económicos no son solo una abstracción de los datos sin procesar, sino que se calculan utilizando una variedad de técnicas y métricas. Por ejemplo, la capitalización de mercado se calcula multiplicando la oferta total de una criptomoneda por su precio actual, y el volumen de negociación se calcula sumando el número total de transacciones durante un período de tiempo determinado. Otras métricas, como la velocidad del dinero y la relación entre el valor de la red y la transacción, se pueden calcular mediante fórmulas más complejas que tienen en cuenta varios factores, como el número de transacciones y la actividad general de la red.
En general, los datos económicos brindan una visión de alto nivel del mercado de criptomonedas y pueden ser útiles para comprender las tendencias del mercado y tomar decisiones de inversión. Sin embargo, es importante tener en cuenta que los datos económicos no siempre son una representación precisa o completa del mercado subyacente y deben utilizarse con precaución.
Distintas soluciones analíticas
Centralización vs descentralización
Existen varias soluciones diferentes para indexar datos en cadena, incluidas opciones tanto centralizadas como descentralizadas. Las soluciones centralizadas generalmente involucran una sola entidad que recopila y organiza los datos, mientras que las soluciones descentralizadas usan una red distribuida de nodos para indexar los datos. Algunos ejemplos de soluciones de indexación incluyen exploradores de bloques, que permiten a los usuarios buscar y explorar la cadena de bloques, y servicios de indexación, que proporcionan API y otras herramientas para que los desarrolladores accedan y analicen datos en cadena.
Es posible hacer una solución analítica descentralizada utilizando la tecnología blockchain, pero dependería de los requisitos y restricciones específicos del sistema. Un beneficio potencial de usar un enfoque descentralizado es que puede ayudar a garantizar la integridad y seguridad de los datos que se analizan. Sin embargo, los sistemas descentralizados también pueden ser más complejos de diseñar e implementar, y pueden requerir recursos adicionales en términos de potencia informática y almacenamiento. En términos de rendimiento, un sistema descentralizado puede ser más lento que una solución centralizada en algunos casos, pero esto dependerá de una variedad de factores, como los algoritmos específicos y las estructuras de datos que se utilizan, así como el diseño general del sistema. En última instancia, la decisión de utilizar un enfoque descentralizado dependerá de las necesidades y objetivos específicos de la solución analítica.
¿Qué se puede hacer con los datos de la cadena de bloques?
Hay muchas metodologías diferentes que se pueden aplicar dentro del análisis de datos en cadena. Algunos ejemplos comunes incluyen:
Análisis descriptivo
Análisis descriptivo, que implica resumir y describir los datos, y puede incluir cosas como calcular estadísticas básicas y generar visualizaciones. Este tipo de análisis es útil para obtener una imagen general de los datos y puede ayudar a identificar tendencias y patrones.

Análisis exploratorio
Análisis exploratorio, que implica una exploración más profunda de los datos y puede incluir elementos como la agrupación en clústeres y la reducción de la dimensionalidad. Este tipo de análisis es útil para descubrir patrones y relaciones ocultos en los datos, y puede ayudar a generar hipótesis e ideas para futuras investigaciones.


Análisis inferencial
Análisis inferencial, que implica el uso de técnicas estadísticas para hacer inferencias sobre una población en función de una muestra de los datos. Dentro de este tipo de análisis se suelen aplicar diferentes métodos estadísticos. Esto puede incluir métodos para calcular cosas como la media, la mediana, la moda y la desviación estándar, así como herramientas para probar hipótesis y realizar análisis de regresión. Este tipo de análisis es útil para hacer predicciones y generalizaciones sobre los datos y puede ayudar a identificar tendencias y patrones que no son inmediatamente obvios.


Análisis predictivo
Análisis predictivo que implica el uso de algoritmos de aprendizaje automático para hacer predicciones sobre eventos o resultados futuros basados en los datos. Este tipo de análisis se puede usar para identificar tendencias y patrones en los datos, y se puede usar para hacer predicciones o recomendaciones. Por lo general, se incluyen técnicas como el agrupamiento, la clasificación y la regresión, que se pueden usar para identificar patrones y relaciones en los datos.

La metodología específica utilizada para el análisis de datos en cadena dependerá de los objetivos y requisitos del análisis, así como de la naturaleza de los datos en sí.
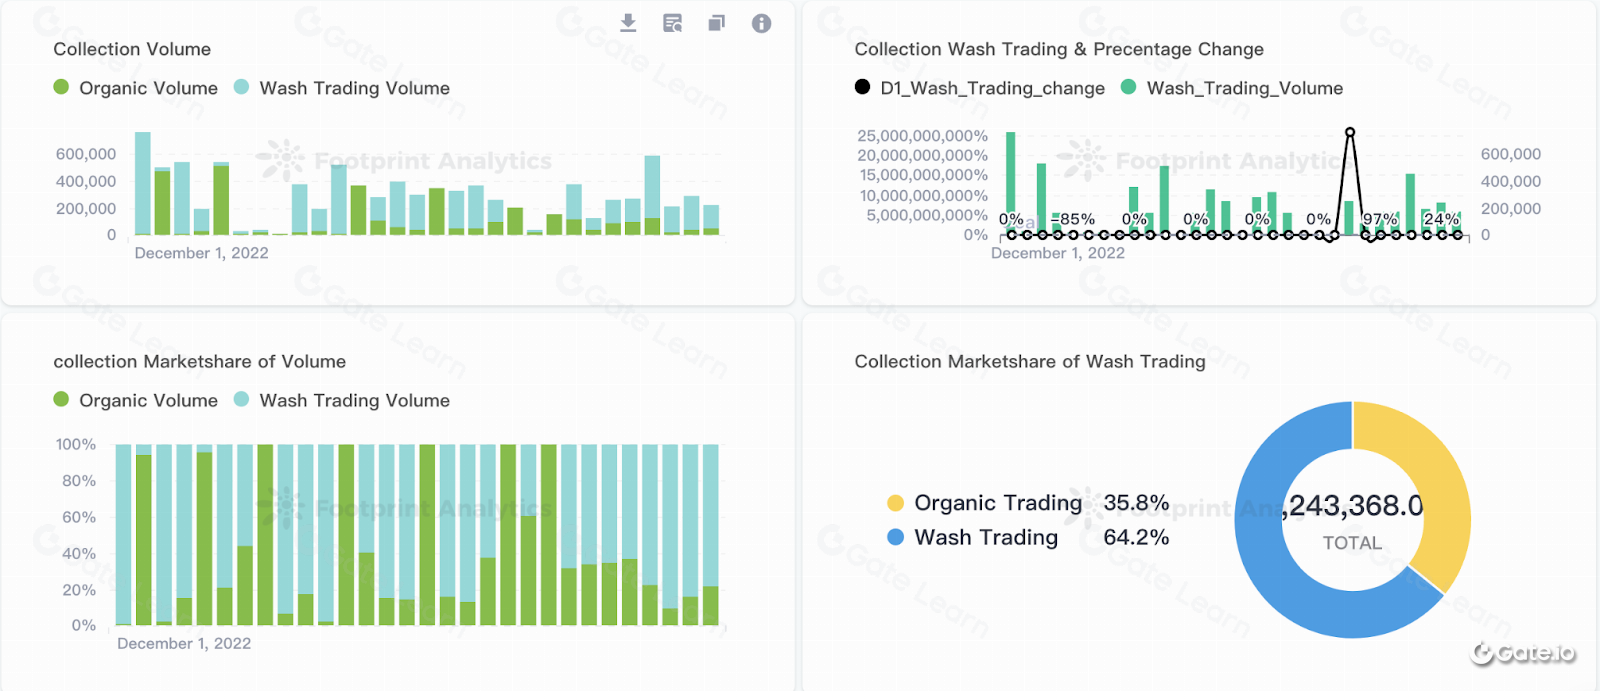
Hablemos de la visualización de datos. Es una herramienta analítica común que se puede utilizar para representar datos complejos en un formato visual. Esto puede incluir herramientas como tablas, gráficos y mapas, que pueden ayudar a identificar tendencias y patrones en los datos. Por ejemplo, un gráfico de líneas podría usarse para mostrar la tendencia del precio de una criptomoneda en particular a lo largo del tiempo, mientras que un gráfico de barras podría usarse para comparar la capitalización de mercado de diferentes criptomonedas. Las herramientas de visualización de datos también se pueden utilizar para crear visualizaciones interactivas, que permiten a los usuarios explorar los datos con mayor profundidad e interactuar con ellos en tiempo real. Esto puede ser útil para identificar relaciones y patrones que pueden no ser inmediatamente obvios al observar los datos sin procesar.

Uno puede preguntarse: ¿por qué debo usar herramientas de visualización cuando los exploradores ya brindan información exhaustiva? Las herramientas de visualización de datos y los exploradores de bloques son herramientas que se pueden usar para analizar datos en cadena, pero tienen diferentes propósitos y brindan diferentes tipos de información.

Las herramientas de visualización de datos se centran en representar los datos en un formato visual, lo que puede facilitar la comprensión e identificación de tendencias y patrones. Por el contrario, los exploradores de bloques son herramientas en línea que permiten a los usuarios navegar por la cadena de bloques y ver información sobre bloques, transacciones y direcciones específicas. Proporcionan una interfaz fácil de usar para acceder a los datos de la cadena de bloques e interactuar con ellos, pero normalmente no incluyen funciones avanzadas de análisis o visualización. En general, las herramientas de visualización de datos se pueden usar en combinación con los exploradores de bloques para obtener una comprensión más completa de los datos en la cadena de bloques.
Web3; Ciencia de los datos; oportunidades de trabajo
Hay cuatro cosas en las que pensar al discutir el futuro de la Web 3 y la ciencia de datos:
Web 3 pondrá a disposición más oportunidades laborales para científicos de datos y otros profesionales de datos. Esto se debe al hecho de que las organizaciones que se preparan para adoptar Web 3 tendrán una gran necesidad de personas con amplia experiencia en análisis de datos, interpretación y creación de productos y servicios utilizando los datos disponibles mientras incorporan AI y ML en la ecuación.

Los usuarios y los científicos de datos se beneficiarán financieramente de la Web 3. Las empresas tendrán la opción de comprar datos directamente de los usuarios (permitiendo a los propietarios de datos vender sus datos a quien quieran), combinar y combinar estos nuevos conjuntos de datos con conjuntos de datos existentes para mejorar el aprendizaje. modelos, y luego vender los nuevos conocimientos en el mercado abierto.
Los científicos de datos pueden aplicar IA para comprender más a fondo las necesidades particulares de los clientes en la Web 3. Las empresas de datos pueden crear modelos de lenguaje que brinden "comprensión semántica" porque la Web 3 es individual o está enfocada en el usuario, y debido a que los datos están vinculados a la interacción del usuario, pueden luego crear soluciones que se adapten específicamente al usuario. Las empresas de datos también pueden extraer conocimientos de los datos sin procesar y luego transformar esos conocimientos en mejores recomendaciones de productos que pueden mejorar la experiencia del cliente principalmente en función de las expectativas del cliente.
Los científicos de datos tendrán un impacto mucho mayor en la economía global en la era Web 3. Se convertirán en las nuevas "neuronas" que pueden ayudar a crear contenido o modelos de IA que pueden coordinarse con otros modelos de IA y abordar problemas más complicados o riesgos potenciales para empresas u organizaciones.


