


Shiba Inu (SHIB) Price Hasn_t Done This in 9 Months
SHIB markets have been under sellers’ control for at least 8 of the past 9 days, indicating a win for bears.
The charts indicate that in the past 8 of 9 days, the daily candles have been closing as red. On Aug. 13, the chart shows the first red candle stick, with the daily low reported to be $0.00001013.
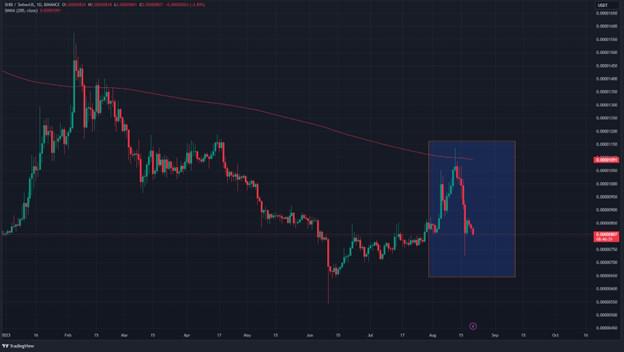
Last Happened 9 Months Ago
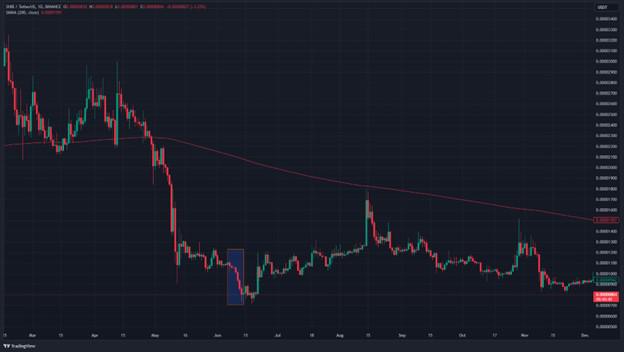
Shiba Inu last reported a trend 9 months ago, between Nov. 5 and 13. In this period, 8 of 9 daily candlesticks were red.
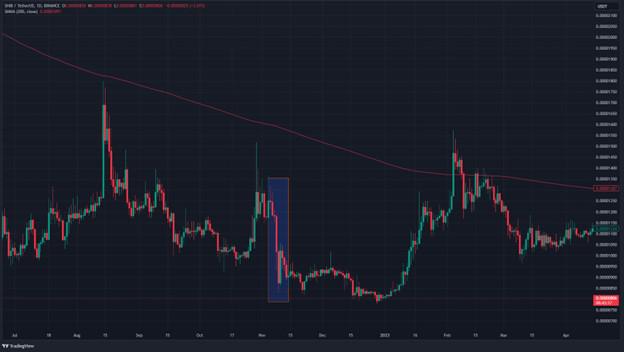
Is SHIB at a Local Bottom?
A look at the market charts indicates a reduction in the selling volumes of SHIB as the pattern ensues. Between 18th and 21st, the selling volumes have been diminishing. Analysts suggest that this reduction in selling volumes could mean that SHIB is already at its local bottom.
However, SHIB could still go lower to crash the levels at $0.0000077, $0.0000069, and $0.0000064. Initially a strong support level, the $0.000009 mark is now a tough resistance.