Penelitian Gate: Lebih dari 5 Juta BTC dalam Kerugian; Tinjauan Token Teratas yang Mendapatkan Momentum di Tengah Penurunan Pasar
Pengantar
Laporan kuantitatif dwimingguan ini (27 Maret – 10 April) menawarkan analisis data multidimensional pasar kripto, dengan fokus pada metrik kunci untuk Bitcoin dan Ethereum serta peristiwa likuidasi di pasar derivatif. Perhatian khusus diberikan pada koreksi pasar terkini yang dipicu oleh gejolak kebijakan tarif dan tanda-tanda pemulihan struktural yang muncul.
Abstrak
- BTC melonjak kembali ke $82,000, sementara ETH hanya pulih sekitar $1,600, menunjukkan performa yang relatif lebih lemah.
- ETH menunjukkan volatilitas yang lebih tinggi daripada BTC selama dua minggu terakhir, menunjukkan fluktuasi harga yang lebih kuat.
- Rasio long-short BTC secara bertahap pulih selama tahap awal pemulihan namun tetap di bawah level awal April, menunjukkan pemulihan kepercayaan pasar yang terbatas.
- Volume likuidasi harian rata-rata di pasar derivatif mencapai $380 juta, naik 90% dari periode sebelumnya.
- Lebih dari 5 juta BTC saat ini berada dalam posisi rugi, mendekati tingkat yang terlihat pada beberapa dasar lokal sebelumnya.
- Beberapa token mengalami lonjakan volume perdagangan selama penjualan panik, menunjukkan pola pemulihan yang didorong oleh volume klasik.
Ikhtisar Pasar
1. Analisis Volatilitas Bitcoin & Ethereum
Selama dua minggu terakhir, dipengaruhi oleh perkembangan kebijakan tarif, BTC menunjukkan pola penurunan ke samping awal → penurunan tajam → rebound cepat. Harga turun lebih dari 15%, tetapi pemulihan selanjutnya sangat kuat, menunjukkan adanya perang tarik-menarik antara bullish dan bearish. Saat ini, BTC sebagian besar telah mendapatkan kembali posisi yang hilang selama penurunan awal April. ETH dengan cermat mengikuti pergerakan BTC, meskipun dengan penurunan sedikit lebih besar, turun sebanyak 30% dari puncak hingga lembah. Tidak seperti BTC, ETH belum kembali ke level tertinggi awal April.
Grafik 1: BTC memantul ke $82,000, sementara ETH hanya pulih sekitar $1,600, mencerminkan kelemahan relatif
Sejak awal April, volatilitas pasar secara keseluruhan telah meningkat secara signifikan. Baik BTC maupun ETH telah mengalami kenaikan volatilitas yang tajam, menandakan pergeseran cepat dalam sentimen dari kehati-hatian menjadi spekulasi aktif. Data menunjukkan bahwa volatilitas BTC secara perlahan meningkat dari 0.0025 pada 28 Maret menjadi 0.0261 pada 1 April, kemudian melonjak menjadi 0.0460 pada malam 2 April. Terus meningkat menjadi 0.0345 dan 0.0442 pada 9 dan 10 April, berturut-turut, membentuk puncak volatilitas lokal. Volatilitas ETH bahkan lebih mencolok — melonjak dari 0.0047 di akhir Maret menjadi 0.0488 pada 2 April, mencapai 0.0724 pada 7 April, dan lebih lanjut melonjak menjadi 0.0812 pada 10 April. Hal ini mencerminkan bagaimana emosi pasar seringkali diperkuat dalam aset beta tinggi selama periode volatilitas yang tinggi.
Grafik 2: ETH menunjukkan volatilitas yang lebih tinggi secara konsisten daripada BTC, menunjukkan fluktuasi harga yang lebih kuat
2. Analisis Rasio Ukuran Pengambil Posisi Panjang/Pendek Bitcoin dan Ethereum (LSR)
Dari tanggal 27 Maret hingga 6 April, rasio long/short baik BTC maupun ETH menunjukkan tren menurun yang stabil. Hal ini mencerminkan sentimen bullish yang melemah dan sentimen bearish yang memperkuat diri di tengah penurunan harga yang terus berlanjut. Rasio long/short BTC turun dari 0,97 pada 27 Maret menjadi 0,91 pada 6 April, di mana harganya turun dari $85,823 menjadi $77,151. ETH mengalami pergeseran sentimen yang lebih tajam — rasionya turun dari 1,00 menjadi 0,91, dengan harga merosot dari $1,987 menjadi $1,537. Hal ini menunjukkan bahwa investor ETH beralih menjadi bearish dengan lebih cepat. Rasio long/short tetap relatif rendah sepanjang penurunan, menunjukkan sentimen hati-hati dan minat beli yang lemah, dengan posisi short yang mengambil kendali.
Antara 7 dan 10 April, baik BTC maupun ETH mulai memantul, tetapi rasio long/short keduanya sangat berbeda. Rasio long/short BTC secara bertahap meningkat dari 0.99 menjadi 1.01 selama pemantulan awal, dan melonjak menjadi 0.91 pada 10 April. Namun, hal ini masih di bawah level awal April, menyoroti pemulihan yang terbatas dalam kepercayaan pasar. Sebaliknya, rasio long/short ETH mencapai 1.03 pada 9 April namun turun tajam menjadi 0.85 pada 10 April, meskipun harga memantul ke $1,628. Hal ini menunjukkan bahwa momentum bullish di ETH kurang berkelanjutan, dengan tekanan dari sisi short tetap dominan. Secara keseluruhan, struktur long/short BTC tampak lebih tangguh, sementara ETH menunjukkan sensitivitas yang lebih besar terhadap perubahan sentimen. Oleh karena itu, strategi perdagangan untuk ETH mungkin memerlukan kontrol waktu yang lebih ketat dan manajemen risiko yang lebih disiplin.[3]
Grafik 3: Rasio long/short BTC pulih secara bertahap selama pemulihan awal tetapi tetap di bawah level awal April, menunjukkan pemulihan kepercayaan yang terbatas
Grafik 4: Momentum bullish jangka pendek ETH terlihat lebih lemah, dengan tekanan yang lebih kuat dari sentimen bearish
3. Analisis Minat Terbuka
Menurut data CoinGlass, minat terbuka BTC dan ETH mengikuti pola struktural penurunan, diikuti dengan pemulihan mulai 27 Maret, dengan sangat mirip dengan pergerakan harga. Minat terbuka BTC berada pada $54.77 miliar pada tanggal 27 Maret, secara bertahap turun seiring dengan harga mencapai titik terendah lokal $50.95 miliar pada tanggal 7 April, dan turun lebih jauh menjadi $50.8 miliar pada tanggal 8 April — total penurunan sebesar 7.2%. Minat terbuka ETH turun tajam, jatuh dari $21.49 miliar menjadi $17.04 miliar selama periode yang sama — penurunan 20.7% — mencerminkan deleveraging yang lebih signifikan dalam posisi ETH selama fase koreksi.
Dari 9 hingga 10 April, ketika harga BTC dan ETH melonjak tajam, minat terbuka juga pulih seiring, menunjukkan aliran leverage sisi panjang yang diperbarui. Minat terbuka BTC pulih menjadi $55.68 miliar pada 9 April dan bertahan di $55.36 miliar pada 10 April — peningkatan bersih hampir $4.8 miliar dalam dua hari. Minat terbuka ETH juga melonjak menjadi $18.41 miliar pada 9 April, dan sedikit mengendur menjadi $17.94 miliar pada 10 April, mempertahankan tingkat yang relatif tinggi. Ini menunjukkan pemulihan kepercayaan bullish jangka pendek. Namun, pemulihan minat terbuka ETH tertinggal di belakang BTC, menyoroti preferensi investor yang berkelanjutan untuk aset kap besar yang lebih tahan banting. Secara keseluruhan, tren minat terbuka tetap erat terkait dengan aksi harga. Trader harus tetap berhati-hati terhadap potensi risiko likuidasi yang terkait dengan penumpukan OI yang cepat. [4]
Grafik 5. Minat terbuka ETH turun sebanyak 20,7%, menunjukkan pengurangan leverage yang lebih agresif selama penurunan
4. Analisis Tingkat Pendanaan
Tingkat pendanaan untuk kedua BTC dan ETH telah menunjukkan fluktuasi yang sering dengan kecenderungan lemah secara keseluruhan, menunjukkan perputaran leverage yang meningkat dan divergensi jelas dalam sentimen pasar di tengah momentum harga yang kurang menarik. Tingkat pendanaan BTC berulang kali menjadi negatif selama periode tersebut, mencapai titik terendah di dekat -0,01%, mencerminkan dominasi sementara oleh pendanaan sisi pendek dan periode ekspektasi bearish yang jelas. Sementara itu, tingkat pendanaan ETH tetap dalam kisaran yang lebih sempit, dengan fluktuasi yang lebih kecil dibandingkan dengan BTC, menunjukkan penempatan leverage yang lebih terkendali dan sentimen spekulatif yang relatif ringan di pasar ETH.
Menariknya, meskipun harga BTC dan ETH mengalami rebound pada 9 April, tingkat pendanaan gagal menguat secara bersamaan. Sebaliknya, mereka sering mundur segera setelah mencapai puncak jangka pendek, menandakan bahwa reli tersebut kekurangan dukungan berkelanjutan dari posisi panjang yang di-leverage. Pasar tetap dalam permainan tarik-menarik antara bull dan bear, dengan aliran pendanaan belum menunjukkan konsensus arah. Hal ini menunjukkan ketidakpastian yang berlanjut dalam aksi harga jangka pendek.
Grafik 6. Tingkat pendanaan BTC turun ke wilayah negatif beberapa kali, menunjukkan dominasi sisi pendek selama periode tertentu
5. Tren Likuidasi Kontrak Cryptocurrency
Menurut data CoinGlass, likuidasi total di pasar derivatif kripto telah tetap tinggi dan volatile sejak 26 Maret. Lonjakan signifikan terjadi pada 6 April dan 8 April, dengan likuidasi long mencapai $740 juta dan likuidasi short mencapai $370 juta, masing-masing. Pergerakan tajam ini mencerminkan likuidasi dua sisi yang luas yang dipicu oleh gejolak harga yang intens.
Posisi long mengalami kerugian yang jauh lebih besar daripada posisi short, terutama sekitar 6 April, ketika koreksi terkait tarif menyebabkan pembongkaran paksa leverage bullish yang substansial. Hal ini menunjukkan bahwa pemulihan kurang mendapat dukungan beli yang berkelanjutan, dengan banyak investor yang mengejar reli pada level yang lebih tinggi dengan cepat mencapai ambang batas stop-loss. Sebaliknya, likuidasi short lebih terkonsentrasi selama pemulihan lokal, menyoroti terus berputarnya pasar dan ketakutan ketinggalan di antara trader jangka pendek.
Secara keseluruhan, volume likuidasi telah meningkat dibandingkan dengan pertengahan Maret. Risiko leverage di pasar tetap tinggi, dan pemulihan sentimen sepenuhnya kemungkinan akan memerlukan konfirmasi lebih lanjut melalui aksi harga yang berkelanjutan dan volume perdagangan.[7]
Grafik 7. Dari 26 Maret hingga 10 April, volume likuidasi harian rata-rata di pasar derivatif mencapai $380 juta, naik 90% dari level sebelumnya
6. 25,8% dari Pasokan Bitcoin Sekarang Merugi
Menurut data CryptoQuant, sekitar 25,8% dari pasokan Bitcoin yang beredar — setara dengan 5.124.348 BTC — saat ini disimpan dengan kerugian. Saat BTC turun dari level tertinggi baru-baru ini sekitar $88.500 menjadi rendah sekitar $74.000 selama dua minggu terakhir, proporsi pasokan yang merugi tajam meningkat. Tingkat ini dapat dibandingkan dengan yang terlihat selama beberapa penurunan besar pada tahun 2024.
Seperti yang terlihat dalam grafik, rasio ini secara historis telah mencapai tingkat yang mirip di dekat zona dasar lokal, menunjukkan bahwa sentimen pasar telah memasuki periode stres tinggi. Banyak pemegang jangka pendek sekarang berada dalam kondisi merugi, yang mengakibatkan tekanan jual yang didorong oleh kapitulasi dan peningkatan likuidasi, kedua-duanya adalah fitur yang menentukan dari lingkungan pasar saat ini. Namun, perlu dicatat bahwa secara historis, tingkat kerugian pasokan yang tinggi juga sering bersamaan dengan akumulasi bertahap oleh investor jangka panjang, seringkali berfungsi sebagai titik referensi untuk fase dasar yang signifikan secara struktural.
Dari sudut pandang perilaku on-chain, ketika lebih dari seperempat pasokan Bitcoin mengalami kerugian, pasar biasanya sedang mengalami deleveraging dan pembersihan emosional. Meskipun bukan sinyal dasar yang pasti, metrik ini memberikan wawasan pembalikan siklikal dengan keandalan moderat.
Grafik 8. Sekitar 25,8% dari pasokan Bitcoin — 5.124.348 BTC — saat ini dipegang dengan kerugian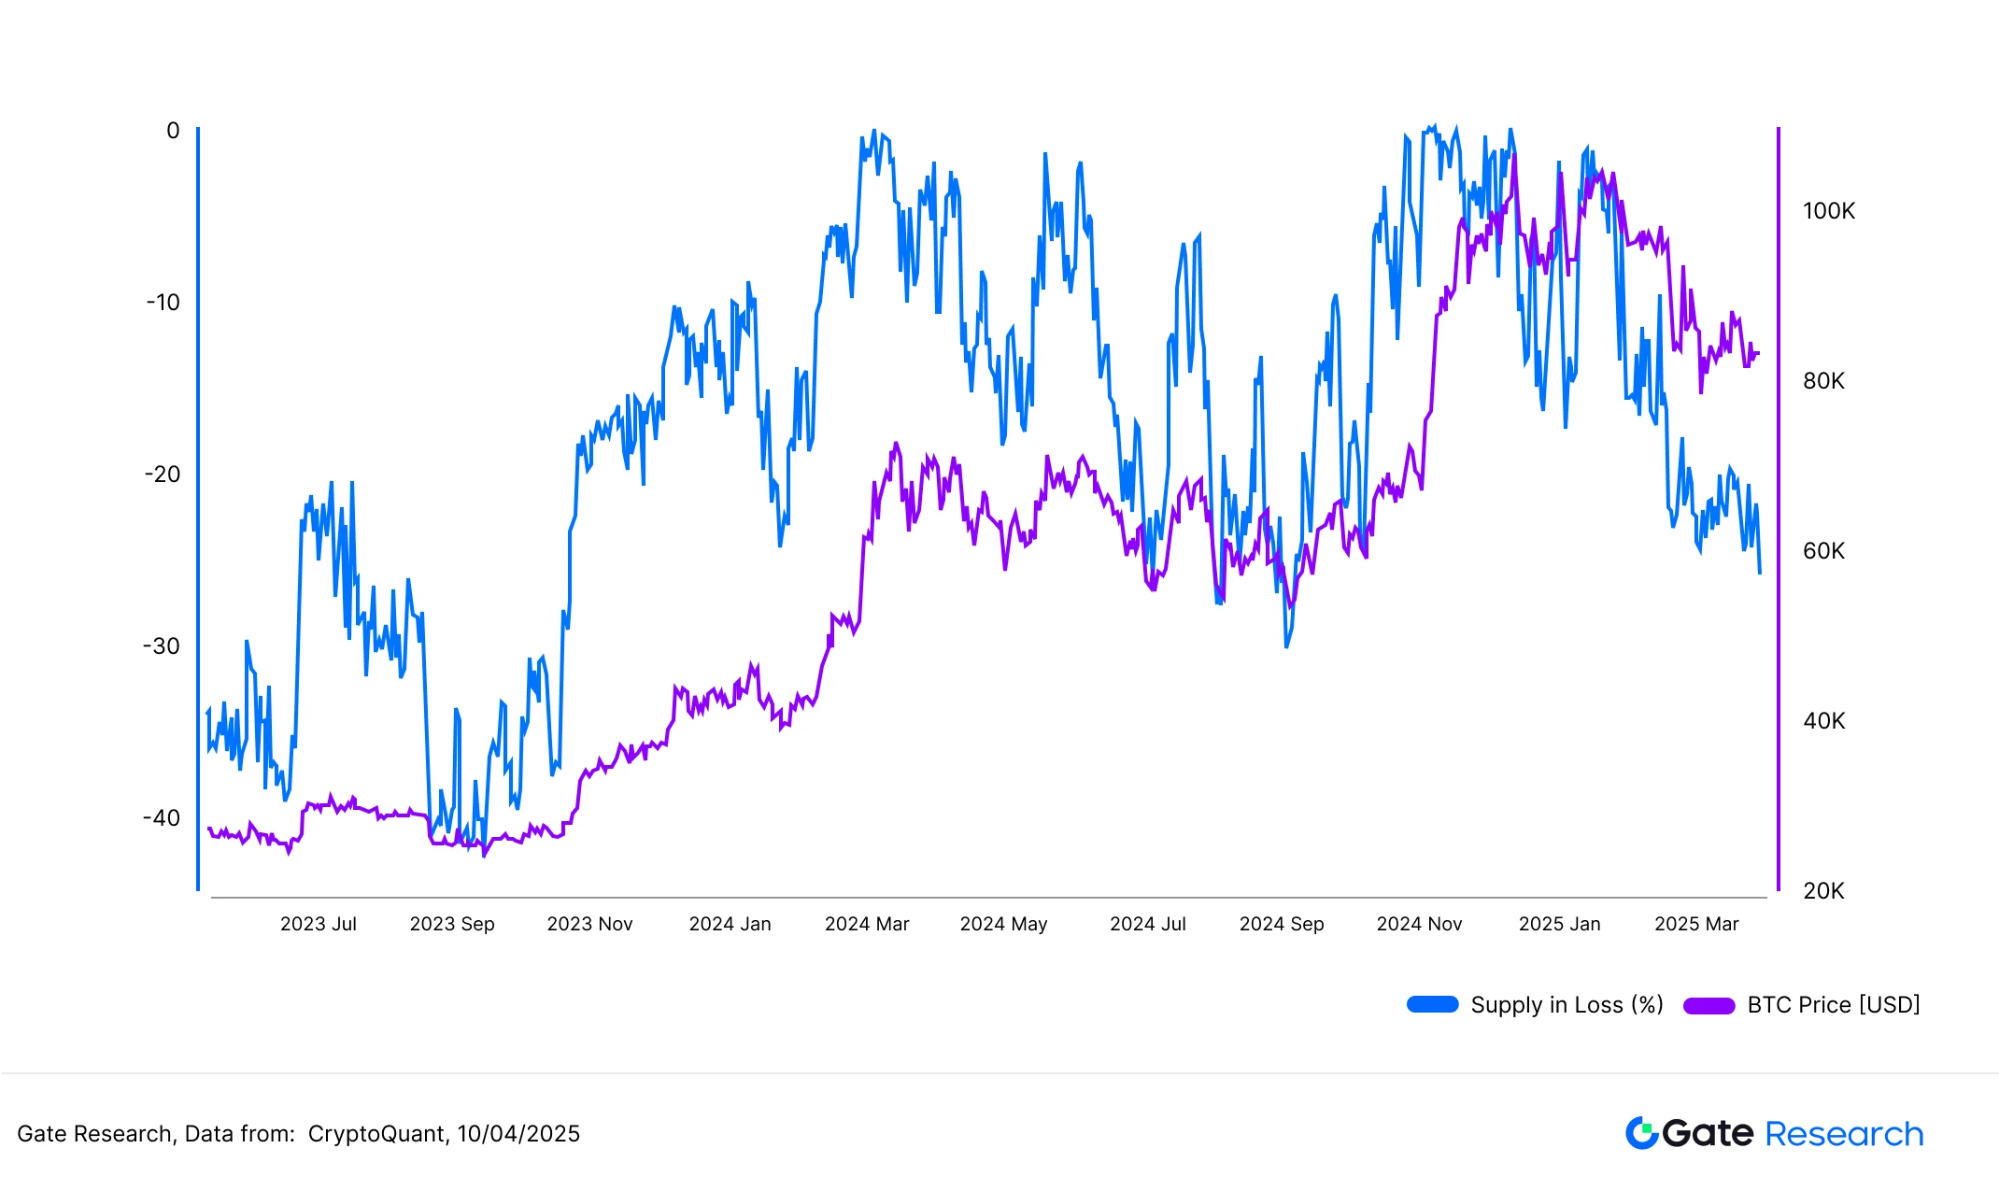
Analisis Koreksi Pasar dan Pemulihan
(Disclaimer: Semua ramalan dalam artikel ini didasarkan pada data historis dan tren pasar yang diamati. Mereka hanya untuk tujuan informasi dan tidak boleh dianggap sebagai saran investasi atau jaminan kinerja masa depan. Investor harus sepenuhnya menilai risiko dan berhati-hati saat membuat keputusan investasi.
Pada 7 April, pasar kripto mengalami penurunan tajam. Menurut data CoinGecko, Bitcoin jatuh ke titik terendah intraday sekitar $74.600, sementara sebagian besar token utama mencatat kerugian dua digit. Kapitalisasi pasar secara keseluruhan turun sekitar 7% dalam satu hari. Secara statistik, harga terendah rata-rata terjadi sekitar pukul 14:00 (UTC+8) pada 7 April.
Pemicu dari koreksi ini adalah pengumuman Presiden AS Donald Trump pada 2 April tentang kebijakan “tarif timbal balik” baru. Mulai 5 April, AS memberlakukan tarif impor pada 18 ekonomi, termasuk China, yang meningkatkan ketegangan perdagangan global. Hal ini memicu sentimen risiko di seluruh pasar global, yang mengakibatkan penjualan bersama baik di saham maupun crypto. Namun, ketika pemerintahan mengumumkan penangguhan implementasi tarif selama 90 hari pada 9 April, sentimen pasar dengan cepat pulih, dan harga mulai pulih dari posisi terendah mereka.
1. Gambaran Penurunan Harga: 3–7 April
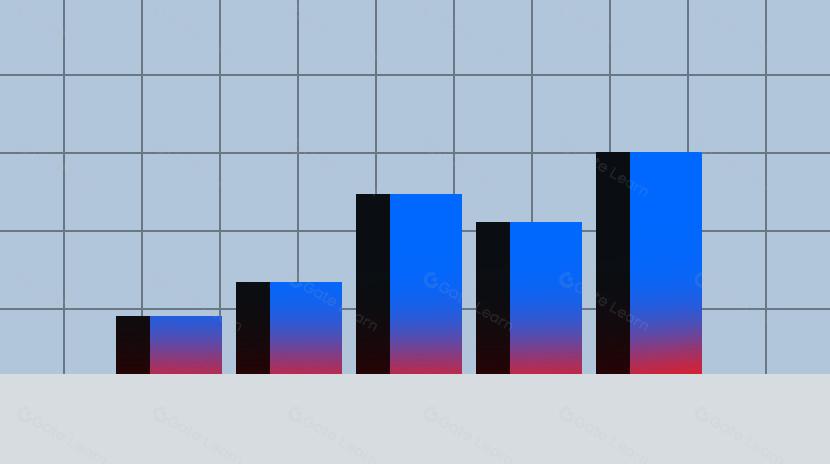
Kami menganalisis rata-rata penarikan di seluruh segmen kapitalisasi pasar yang berbeda untuk 500 token teratas antara 3 April dan 7 April. Penurunan rata-rata keseluruhan adalah 13,74%, dengan variasi yang relatif kecil di seluruh kelompok kapitalisasi pasar.
Token yang berada di peringkat 201–300 berdasarkan kapitalisasi pasar mengalami penurunan terbesar, rata-rata turun 14,31%. Sebaliknya, token yang berada di peringkat 101–200 menunjukkan ketahanan relatif, dengan penurunan rata-rata sebesar 12,97%. Secara keseluruhan, ukuran kapitalisasi pasar tidak signifikan memengaruhi skala penurunan, menunjukkan koreksi yang merata daripada penarikan mundur yang didorong secara struktural oleh sektor-sektor tertentu atau kelompok aset. Keseragaman ini menegaskan sifat sistemik dari volatilitas pasar. Ketika terjadi guncangan makro yang lebih luas, sebagian besar aset cenderung turun bersama-sama, dengan modal keluar dari pasar secara komprehensif daripada selektif.
Grafik 9. Penurunan rata-rata di seluruh pasar adalah 13.74%, dengan variasi minimal di seluruh segmen kapitalisasi pasar, menunjukkan koreksi yang disinkronkan
1.1 20 Besar Pemenang dan Pecundang
Selama putaran koreksi pasar ini, beberapa token menunjukkan perbedaan kinerja yang signifikan, dengan kerugian tajam dan keuntungan yang mencolok terjadi secara bersamaan. Lima terbesar yang mengalami kerugian adalah AI16Z (-38,08%), KET (-32,00%), IBERA (-31,77%), MEW (-31,39%), dan BERA (-31,30%). Sebagian besar di antaranya adalah proyek-proyek baru atau aset yang sangat sensitif terhadap sentimen pasar, menyebabkan penurunan besar selama penurunan.
Sebaliknya, beberapa token berhasil mencetak keuntungan meskipun tren bearish secara keseluruhan. Performa terbaik termasuk FUN (+100.00%), SAROS (+48.95%), LAYER (+11.85%), USUAL (+11.57%), dan OKB (+8.56%). Kenaikan tajam FUN mungkin disebabkan oleh adopsi yang meningkat dalam aplikasi game dan perjudian. Tim proyek baru-baru ini memperluas integrasi saluran pembayaran, meluncurkan serangkaian kemitraan promosi, dan menjaga kehadiran komunitas yang sangat aktif — semua berkontribusi pada lonjakan perhatian pasar dan arus modal.
Secara keseluruhan, proyek-proyek dengan narasi yang kuat atau mekanisme insentif yang dirancang dengan baik menunjukkan potensi yang lebih besar untuk menonjol di tengah volatilitas. Selain itu, momentum yang didorong oleh hype dan sentimen perdagangan jangka pendek menciptakan peluang untuk keuntungan yang besar dalam token-tokn tertentu.
Grafik 10. Proyek-proyek baru dan aset yang sensitif terhadap sentimen menunjukkan polarisasi yang nyata selama koreksi ini, dengan penurunan yang signifikan di antara yang paling tertinggal
Analisis Kinerja 1.2 dari 100 Token Kap Pasar Teratas
Di antara 100 token teratas berdasarkan kapitalisasi pasar, penurunan terbesar teramati pada token blockchain Layer 1 dan token platform yang sedang berkembang. Aset-aset ini biasanya memiliki beta yang lebih tinggi, artinya harganya lebih fluktuatif dan rentan terhadap penjualan selama kepanikan atau episode penyempitan likuiditas. Karena sifatnya yang 'pertumbuhan tinggi, risiko tinggi', mereka seringkali menjadi yang pertama dijual di pasar turun, mengakibatkan penurunan lebih besar daripada token yang lebih mapan.
Sebaliknya, token dengan kerugian relatif lebih kecil cenderung memiliki fundamental atau dukungan ekosistem yang lebih kuat. Tidak termasuk stablecoin, lima token teratas yang paling tangguh dari 100 token teratas adalah OKB, FTN, WBT, ATOM, dan DEXE. Perlu dicatat, OKB menentang tren menurun dan mencatat keuntungan +3,53%, menjadikannya penampil yang menonjol selama koreksi. FTN dan WBT juga mencatat penurunan terbatas, sementara ATOM dan DEXE menjaga kerugian mereka di bawah 5%, menunjukkan tingkat perlindungan downside. Banyak dari token-token ini terkait dengan kasus penggunaan dunia nyata atau ekosistem yang kuat. Misalnya, beberapa terintegrasi erat dengan bursa besar, menikmati basis pengguna yang stabil dan dukungan struktural. ATOM, sebagai aset inti dalam ekosistem lintas-rantai, mendapatkan manfaat dari posisi teknis dan efek jaringan, memberikan kualitas pertahanan.
Secara keseluruhan, token dengan utilitas yang jelas atau dukungan ekosistem yang kuat cenderung menarik modal selama periode volatilitas tinggi. Aset-aset ini sering berfungsi sebagai "tempat perlindungan" selama koreksi, mencerminkan preferensi pasar yang relatif untuk tindakan defensif.
Grafik 11. Di antara 100 token dengan kapitalisasi pasar teratas, penurunan paling signifikan terjadi pada Layer 1 dan token platform yang sedang berkembang.
Di antara 100 token dengan kapitalisasi pasar teratas, token-token dengan penurunan yang lebih kecil umumnya memiliki dasar yang lebih kuat atau dukungan ekosistem
2. Hubungan Antara Kapitalisasi Pasar dan Kinerja Harga
Untuk lebih memeriksa hubungan antara kapitalisasi pasar token dan besarnya koreksi harga, kami membuat grafik sebar menggunakan 500 token teratas berdasarkan kapitalisasi pasar. Setiap titik mewakili satu token, dengan sumbu X menunjukkan peringkat kapitalisasi pasar (1 adalah yang terbesar) dan sumbu Y menunjukkan perubahan harga (%) antara 3 April dan 7 April.
Secara keseluruhan, tidak ada korelasi linear yang jelas antara peringkat kapitalisasi pasar dan penurunan harga. Sebagian besar token mengalami penurunan yang terkumpul dalam kisaran -10% hingga -25%, menunjukkan kinerja yang relatif seragam di berbagai segmen kapitalisasi pasar selama koreksi ini, tanpa adanya perbedaan yang mencolok berdasarkan ukuran.
Namun, perlu dicatat bahwa token dengan kapitalisasi lebih kecil cenderung menunjukkan volatilitas yang lebih tinggi terhadap tepi luar distribusi. Beberapa token berperingkat lebih rendah mengalami kerugian melebihi -40%, sementara yang lain rebound lebih dari 50% dalam jangka waktu singkat, menggarisbawahi eksposur risiko tinggi yang terkait dengan aset berkapitalisasi rendah. Ini menunjukkan bahwa kapitalisasi pasar bukanlah penentu utama kinerja selama penurunan ini. Sebaliknya, pola tersebut mencerminkan "aksi jual berbasis luas" yang didorong oleh sentimen sistemik, daripada faktor struktural atau berbasis kapitalisasi yang terisolasi.
Grafik 13. Tidak ada hubungan linear yang kuat yang diamati antara peringkat kapitalisasi pasar dan penarikan. Sebagian besar token mengalami kerugian dalam kisaran -10% hingga -25%
3. Analisis Rebound: Siapa yang Pulih Cepat Setelah Penurunan
Untuk melengkapi pandangan struktural dari koreksi pasar baru-baru ini, kami melacak kinerja harga pasca-dasar dari token-token setelah level terendah pada 7 April untuk mengidentifikasi "pantulan jenuh beli" dan "pembalikan V-shaped." Sebagian besar token mengalami pemulihan yang moderat, dengan keuntungan yang terkonsentrasi dalam kisaran 0% hingga 20%. Namun, beberapa token menonjol - seperti ARDR dan GAS - yang melonjak lebih dari 50%, menunjukkan momentum rebound yang kuat setelah penjualan tajam.
Tidak kalah penting, beberapa token menunjukkan pola klasik pembalikan berbentuk VDitandai dengan penarikan sebelumnya yang melebihi 30%, diikuti oleh lonjakan tajam lebih dari 20% dalam waktu singkat. Token-token ini terutama aset berkapitalisasi kecil hingga menengah dengan volatilitas yang lebih tinggi, sehingga membuatnya lebih rentan terhadap perubahan sentimen dan spekulasi tematis.
Grafik 14. Sebagian besar token mengalami pemulihan dalam kisaran 0%–20%, namun beberapa seperti ARDR dan GAS melonjak lebih dari 50%, menunjukkan dinamika pemulihan oversold yang kuat
Melihat komposisi token yang rebound, selain sektor naratif panas (seperti AI, Layer 2s, ekosistem Layer 1, dan token meme), aset terkait infrastruktur tertentu seperti ARDR dan GAS juga tampil baik. Meskipun mendapat perhatian pasar yang lebih sedikit, token-token ini mungkin telah menarik modal karena dasar teknis atau penilaian undervaluasi yang dirasakan, memicu pemulihan harga yang cepat. Hal ini menunjukkan bahwa pemulih yang kuat dapat berasal dari tema spekulatif dan peningkatan fundamental, mencerminkan campuran posisi modal yang beragam di pasar saat ini.
Selain itu, banyak pemulih teratas adalah token dengan kapitalisasi pasar yang lebih rendah, yang menguatkan bahwa sementara aset small-cap cenderung menunjukkan volatilitas downside yang lebih tinggi, mereka juga menawarkan elastisitas upside yang lebih besar selama pemulihan jangka pendek.
Tabel di bawah ini menyoroti 10 token teratas berdasarkan persentase rebound selama siklus ini, yang semuanya mencatat kenaikan melebihi 35%. FARTCOIN dan ARDR memimpin dengan rebound lebih dari 60%. Daftar ini mencakup token seperti ARDR (-29,4%) dan MOG (-30,07%), yang mengalami koreksi sebelumnya yang dalam, serta token seperti FARTCOIN (-1,04%) dan UXLINK (+1,75%) yang mengalami penurunan relatif kecil — menunjukkan bahwa kinerja rebound tidak secara ketat terkait dengan besarnya penurunan harga sebelumnya.
Grafik 15. 10 token teratas berdasarkan kekuatan rebound kali ini, dengan FARTCOIN dan ARDR masing-masing mengalami kenaikan lebih dari 60%
Secara ringkas, fase rebound ini menunjukkan karakteristik struktural yang kuat. Meskipun pemulihan pasar secara keseluruhan agak minim, beberapa token small- dan mid-cap menunjukkan ketahanan yang luar biasa. Apakah didorong oleh narasi spekulatif, perkembangan fundamental, atau katalis teknis, aset-aset ini menunjukkan potensi pemulihan yang cepat ketika fokus pasar dan modal sejalan. Selain itu, kekuatan rebound tidak semata-mata bergantung pada kerugian sebelumnya — beberapa token dengan penurunan terbatas masih mencatatkan kenaikan yang signifikan, menunjukkan bahwa dinamika pemulihan jangka pendek lebih dipengaruhi oleh aliran modal dan sentimen daripada faktor teknis murni.
Secara keseluruhan, siklus koreksi dan rebound mengungkapkan divergensi yang jelas dalam kinerja. Beberapa token kap kecil rebound dengan tajam setelah penjualan volume tinggi, menjelaskan dinamika 'oversold sama dengan kesempatan', yang mungkin menjadi indikator berharga untuk perilaku modal selama periode stres pasar di masa depan.
4. Pengamatan tentang Token dengan Lonjakan Volume yang Tidak Biasa
Kenaikan Volume Lipat 4.1
Berdasarkan analisis pemulihan, kami lebih lanjut memeriksa perubahan volume perdagangan pada tanggal 7 April — dasar lokal pasar — untuk mengidentifikasi token-token yang mengalami lonjakan volume yang abnormal. Dengan menggunakan volume harian rata-rata dari tanggal 3 April hingga 6 April sebagai dasar, kami menghitung perkalian peningkatan volume masing-masing token pada tanggal 7 April untuk menilai apakah terjadi aktivitas yang abnormal selama penjualan besar-besaran.
Khususnya, lima token teratas dengan lonjakan volume terbesar terutama adalah aset terkait infrastruktur atau lintas rantai — termasuk OSETH (token staking cair di Ethereum), CLBTC dan STBTC (aset Bitcoin lintas rantai), VENOM (token Layer 1 baru), dan STRAX (token platform blockchain tingkat perusahaan). Meskipun proyek-proyek ini bukan bagian dari narasi arus utama saat ini, mereka melihat lonjakan volume perdagangan yang tidak biasa selama koreksi pasar. Ini mungkin mencerminkan aksi jual yang didorong oleh kepanikan, akumulasi skala besar oleh paus di level yang lebih rendah, atau ledakan aktivitas perdagangan jangka pendek yang terkonsentrasi.
Meskipun lonjakan volume tidak selalu sesuai dengan pemulihan harga yang langsung, mereka sering menandakan aktivitas modal yang meningkat dan minat pasar yang tumbuh, menunjukkan nilai perdagangan jangka pendek yang potensial. Gerakan seperti itu memerlukan observasi yang berkelanjutan.
Grafik 16. Lima token teratas dengan lonjakan volume terbesar pada dasarnya adalah aset terkait infrastruktur dan lintas-rantai
4.2 Volume Increase Multiples vs. Rebound Performance
Kami membuat grafik sebar membandingkan kelipatan peningkatan volume (sumbu-X) pada tanggal 7 April dengan persentase lonjakan harga (sumbu-Y) untuk menjelajahi hubungan antara lonjakan volume dan aksi harga.
Dari grafik, kita melihat bahwa token-token seperti FARTCOIN, GAS, dan ARDR mengalami pertumbuhan volume yang meledak dan memberikan pemulihan kuat lebih dari 60%, menggambarkan pola pemulihan yang dipimpin oleh volume. Sebaliknya, token-token seperti OSETH, VENOM, dan STRAX mengalami peningkatan yang signifikan dalam volume perdagangan namun hanya mengalami pemulihan yang moderat, menunjukkan tingkat penyerapan namun keterbatasan potensi keuntungan.
Secara keseluruhan, meskipun lonjakan volume tidak menjamin rebound harga, ketika dilihat bersama data rebound, jelas berfungsi sebagai sinyal penting dari aliran modal jangka pendek. Oleh karena itu, lonjakan volume dapat digunakan sebagai indikator tambahan untuk memantau momentum pemulihan pasar.
Grafik 17. Token seperti FARTCOIN, GAS, dan ARDR tidak hanya mengalami lonjakan volume yang signifikan pada 7 April tetapi juga mencatat pemulihan yang kuat lebih dari 60%
5. Ringkasan Analisis
Secara keseluruhan, siklus pasar ini menunjukkan ‘dislokasi volume-harga’ yang jelas setelah penurunan tajam, mengungkapkan karakteristik struktural dalam beberapa token di bawah kondisi ekstrim. Lonjakan abnormal dalam volume perdagangan mencerminkan perilaku pasar yang terkonsentrasi dalam lingkungan volatilitas tinggi, baik disebabkan oleh penjualan panik atau akumulasi strategis, sering menandakan titik infleksi potensial dalam aksi harga selanjutnya.
Beberapa token mengalami peningkatan volume perdagangan yang signifikan dan memberikan rebound yang kuat, sesuai dengan profil aset pemulihan yang dipimpin oleh volume. Biasanya, ini menunjukkan elastisitas modal yang lebih tinggi dan perhatian pasar yang lebih besar. Yang lain, meskipun mengalami peningkatan volume yang signifikan, gagal untuk rebound secara signifikan dan mungkin masih mengalami rotasi posisi atau konsolidasi, memerlukan analisis lebih lanjut berdasarkan pola teknis dan fundamental.
Bagi para trader, menggabungkan dinamika volume dengan momentum harga dapat membantu mengidentifikasi peluang-peluang berpotensi tinggi selama tahap awal pemulihan pasar. Pasca volatilitas ekstrem, lonjakan volume yang tidak biasa seringkali berfungsi sebagai indikator utama aliran modal dan preferensi arah.
Saat sentimen pasar stabil dan ketidakpastian makro mereda, pasar mungkin akan beralih ke ‘fase rotasi sektorUntuk meningkatkan pengambilan keputusan yang progresif, disarankan untuk memantau dengan cermat interaksi antara aliran modal dan tema yang didorong oleh narasi. Pendekatan rasional dan hati-hati tetap penting, terutama dalam mengelola risiko downside.
Kesimpulan
Antara 27 Maret dan 10 April, pasar fluktuatif di tengah volatilitas yang meningkat dan perdagangan yang dipicu sentimen intens. Harga BTC dan ETH mengalami fluktuasi tajam, disertai dengan volatilitas yang meningkat, tingkat pendanaan, dan likuidasi yang meningkat — semua menunjukkan sentimen pasar yang fluktuatif dalam jangka pendek. Data rasio long/short dan minat terbuka menunjukkan bahwa posisi leverage di sekitar ETH tetap sangat sensitif. Meskipun ada beberapa tanda-tanda awal stabilisasi, pasar masih dalam fase pembersihan emosional dan ketidakpastian arah, dengan risiko jangka pendek hingga menengah yang belum sepenuhnya teratasi.
Selama koreksi ini, beberapa token mengalami lonjakan volume yang tidak normal selama penurunan dan dengan cepat mengalami pemulihan kuat, membentuk pola pemulihan yang dipimpin oleh volume. Dislokasi volume-harga ini menyoroti rotasi modal struktural di bawah kondisi ekstrim. Secara keseluruhan, pasar nampaknya memasuki fase rotasi sektoral dan divergensi. Investor disarankan untuk membuat keputusan yang rasional dan berhati-hati, menggabungkan sinyal data multi-dimensi dan kerangka manajemen risiko yang kokoh.
Referensi:
- Gate.com,https://www.Gate.com/trade/BTC_USDT
- Gate.com,https://www.Gate.com/trade/ETH_USDT
- Gelas koin,https://www.coinglass.com/LongShortRatio
- Coinglass,https://www.coinglass.com/BitcoinOpenInterest?utm_source=chatgpt.com
- Gate.com,https://www.Gate.com/futures_market_info/BTC_USD/capital_rate_history
- Gate.com,https://www.Gate.com/futures/introduction/funding-rate-history?from=USDT-M&contract=ETH_USDT
- Coinglass,https://www.coinglass.com/pro/futures/Liquidations
- X,https://x.com/Cointelegraph/status/1909456331062288805
- CoinGecko,https://www.coingecko.com/
- X,https://x.com/FUNtoken_io
Penelitian Gate
Gate Research adalah platform riset blockchain dan kripto yang komprehensif, menyediakan pembaca dengan konten yang mendalam, termasuk analisis teknis, wawasan terkini, tinjauan pasar, riset industri, ramalan tren, dan analisis kebijakan makroekonomi.
Klik Tautanuntuk mempelajari lebih lanjut
Penafian
Investasi di pasar cryptocurrency melibatkan risiko tinggi, dan disarankan pengguna melakukan riset independen dan memahami sepenuhnya sifat aset dan produk yang mereka beli sebelum membuat keputusan investasi apapun. Gate.com tidak bertanggung jawab atas kerugian atau kerusakan yang disebabkan oleh keputusan investasi tersebut.
Bagikan


Artikel Terkait

Cara Terbaik Membaca Grafik Mata Uang Kripto
Bagaimana Menggunakan API untuk Memulai Perdagangan Kuantitatif

Riset gate: Tinjauan Pasar Cryptocurrency 2024 dan Ramalan Trend 2025
Panduan Pengguna Perdagangan Spot Grid (Versi Dasar)
Riset gate: Laporan Pendanaan Industri Web3 - November 2024