Post content & earn content mining yield
placeholder
gatefun
gatefun
Curating my ultimate stash of 100x moonshot gems!
NEXT BULL RUN CRYPTO WATCHLIST
$CKOM $RET $BETA $VRA $ALCX $PEPE $BONK $HOLD $POND #Dogecoin #Pepe2 $WEB $HOT $GEO $WSM $WTC $DEXO $CAT
Got more winners? Drop 'em below ⬇️⬇️⬇️
VRA-0.86%
ALCX-4.99%
PEPE2.82%
post-image
  • Reward
  • Comment
  • Repost
  • Share
ETH 2052 short sleep order, only eat meat; SOL sleep order at 84.6, eat more meat
ETH3.11%
SOL4.27%
View Original
post-image
post-image
  • Reward
  • 1
  • Repost
  • Share
Dawn0vip:
The 2053 level is incredible.
Bitcoin continues to flow out: Over the past 7 days, more than 44,000 BTC have left centralized exchanges — are whales quietly accumulating?
gate liveLIVE
298
live-coin
  • Reward
  • Comment
  • Repost
  • Share
王者荣耀
王者荣耀
王者荣耀
gatekol
Created By@Xiamu
Subscription Progress
0.00%
MC:
$0
More Tokens
🇺🇸 SCOTT BESSENT: "IF YOU'RE ON PUBLIC ASSISTANCE, YOU CAN NO LONGER WIRE MONEY OUT OF THE COUNTRY!"
post-image
post-image
  • Reward
  • Comment
  • Repost
  • Share
🕵️ It's now estimated that Michael Saylor’s strategy has already accumulated over 800 #BTC today. Free Academy & VIP Access
#crypto
BTC3.58%
post-image
  • Reward
  • Comment
  • Repost
  • Share
$ARPA ‌ /USDT Short Trade Signal
Current Price: $0.00984
24h High: $0.00999 | 24h Low: $0.00961
Trade Setup (Reversal / Pullback)
Entry Zone: $0.00983 – $0.00995
Target 1: $0.00970
Target 2: $0.00955
Target 3: $0.00940
Stop Loss: $0.01000
Analysis
ARPA is up 0.92% but showing signs of stalling near resistance at $0.00999. MA(7), MA(25), and MA(99) are tightly clustered around $0.00983–$0.00988, indicating equilibrium. Price rejection at the high suggests weakening momentum. Volume averages remain steady but not expanding, hinting at distribution rather than accumulation.
ARPA1.76%
post-image
  • Reward
  • Comment
  • Repost
  • Share
I realize you have a question: Are you this adorable these days, or are you adorable every day?
View Original
post-image
post-image
post-image
post-image
post-image
post-image
post-image
  • Reward
  • Comment
  • Repost
  • Share
$RESOLV Signal】Long + 1H Breakout and Retest Confirmation
$RESOLV The 1H timeframe has entered a healthy retracement after a strong rally, with the price testing the key EMA support zone. The 4H timeframe shows a clear upward trend, with the price firmly above all major moving averages and strong momentum. Currently, the 1-hour RSI has fallen from overbought territory to a healthy level, preparing for another push higher. Market depth data indicates that buy orders remain substantial, and open interest remains stable, suggesting that the rally is not purely driven by short covering, with inst
RESOLV17.56%
BTC3.58%
ETH3.11%
SOL4.27%
View Original
post-image
  • Reward
  • Comment
  • Repost
  • Share
On Monday, March 9, 2026, US stock markets experienced a shocking start to the day with massive losses at the opening. Shares traded on Wall Street saw hundreds of billions of dollars evaporate in the first few minutes, causing concern in global markets.
As markets opened, sharp declines were observed in major indices such as the S&P 500, Dow Jones, and Nasdaq. Social media sources and financial circles reported that more than $580 billion in market value evaporated in the opening session. Some analyses suggested this figure exceeded $900 billion, causing deep concern in the markets.
This sudd
post-image
User_anyvip
#GlobalStocksBroadlyDecline
As global markets are shaken by geopolitical tensions and economic uncertainty, recent developments, grouped under the hashtag "GlobalStocksBroadlyDecline," are deepening investor anxiety. Successive declines once again highlight the delicate balance of the world economy.
Here's the story behind this downward trend in global markets:
Rising Tension Clouds from the Middle East: The recent escalation of tensions in the Middle East, particularly concerns about a potential conflict between the US and Iran, has created a veritable tsunami effect on the markets. Oil prices rising above $100 per barrel, increasing energy costs, and rising inflationary pressures have led to sharp declines in global stock markets. This has negatively impacted many sectors, including the luxury industry.
Blood Loss in Asian Markets: One of the fastest and harshest impacts of developments in the Middle East has been seen in Asian markets. South Korea's KOSPI index experienced one of its worst days of the year, falling by as much as 8%, while Japan's Nikkei 225 index also dropped by 7.6%, reaching its lowest levels in two months. Other Asian stock markets, such as Hong Kong and Shanghai, showed similar declines.
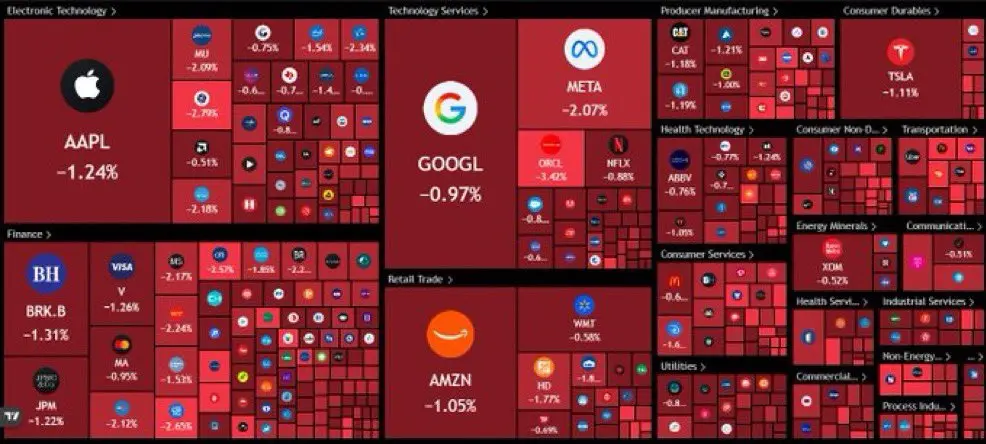
Anxious Waiting in the US and Europe: A similar picture prevails on Wall Street. The Dow Jones Industrial Average experienced declines of up to 1200 points in a short period, wiping out all its gains for 2026 and falling below the 50,000-point threshold. European stock markets also felt the effects of this sell-off, starting the week with declines. Weak labor market data and rising oil prices are increasing pressure on the US economy, fueling inflation and recession fears.
The Turkish economy is not immune to these global fluctuations. It is stated that inflation expectations have been disrupted, economic confidence has decreased despite increased credit volumes, and the manufacturing sector is experiencing one of the worst crises in its history. The government's announcement of a package of austerity and economic measures is seen as a precaution against the potential effects of a global war.
Investor Psychology and Opportunities: Markets are driven not only by numbers but also by investor psychology. While panic selling and uncertainty accelerate declines, some analysts view these periods as "buying opportunities" for long-term investors.
In light of these developments, the complex fabric of global markets presents a story where geopolitical risks, economic data, and investor behavior are intertwined. Whether tensions will ease in the coming period, the actions of central banks, and the trajectory of economic indicators will continue to be the main factors determining the direction of the markets. Whether a financial crisis is on the horizon, or whether these declines are a sharp correction, will become clearer over time.
repost-content-media
  • Reward
  • 3
  • Repost
  • Share
boş_adam1vip:
To The Moon 🌕
View More
🔹 BTC drops below $66,000! $340 million in liquidations as oil prices surge and the U.S. dollar rebounds strongly
gate liveLIVE
1,424
  • Reward
  • Comment
  • Repost
  • Share
ChatGPT failed the test even when I tested it. But Claude did initially the same mistake but then got the correct answer after showing the aftermath of letting the pen go with the right hand.
Claude:
The left hand is gripping the pen somewhere near the middle or with enough friction that it simply holds the pen in place. When you release one end, if the grip is firm enough, the pen just... stays. Static friction from the left hand is greater than the torque gravity exerts on the free end. No pendulum, no drama.
This reveals something important about how both ChatGPT and I reasoned:
We jumped
post-image
  • Reward
  • Comment
  • Repost
  • Share
BTC – The next move is crucial!
Bitcoin is currently trading in the $67K–$69K range, showing signs of consolidation after recent volatility. The market is waiting for a strong breakout to trigger the next big move.
📊 Bullish Scenario:
If BTC breaks through the $70K–$72K resistance, momentum could push the price toward $74K–$75K in the short term. Strong buying volume and institutional interest may support this move.
📉 Bearish Scenario:
If Bitcoin fails to hold the $65K support, we may see a pullback to $62K–$60K, where major buyers might step in.
🔥 Key Levels:
• Support: $65K / $62K
• Res
BTC3.58%
ETH3.11%
View Original
post-image
post-image
  • Reward
  • Comment
  • Repost
  • Share
馬币火
馬币火
Malaysian Ringgit
gatefun
Created By@CryptoKing2026
Listing Progress
100.00%
MC:
$2K
More Tokens
3.10 Morning Bitcoin Outlook: Three Rebounds and Pullbacks Signal a Top! Clear High-Altitude Strategy at 69,000-69,500
From the four-hour chart, recent prices have repeatedly surged and pulled back, with frequent spike-like formations, indicating that bullish momentum is clearly weakening. The price has attempted to break through near 69,500 three times but has failed to do so effectively, quickly retreating after each surge, leaving long upper shadows. This is a typical sign of heavy selling pressure above and a lack of bullish strength. Spike-like formations are essentially false breakouts,
BTC3.58%
View Original
post-image
  • Reward
  • Comment
  • Repost
  • Share
Buy Setup Logic $XAUT
1️⃣ Identify the Demand Zone
First, look at the red support zone around 5040.
Why this zone is important:
Price previously rejected strongly from this level
Buyers entered here before
So this becomes a demand / support zone
This means institutions may buy again from this level.
2️⃣ Liquidity Grab
Before a big move, the market usually takes liquidity.
In this chart:
Price drops slightly below the support
This triggers sell stop orders
Weak traders think breakdown is happening
But actually this is often smart money collecting liquidity.
This is called Sell Side Liquidity S
XAUT1.22%
post-image
post-image
  • Reward
  • Comment
  • Repost
  • Share
$DEXE Signal】Long - 1H breakout pullback confirmation, main force clearly intends to support the market
$DEXE The 1H timeframe has experienced a volume-driven rally and is currently in a healthy pullback phase, with the price consolidating strongly above 4.6. The 4H timeframe has formed a clear upward trend, with the price firmly above all key moving averages, indicating a stable bullish pattern. The current 1-hour chart shows that buy orders remain substantial, and open interest remains stable, suggesting that the main capital has not exited the market but is actively supporting the price at
DEXE18.96%
BTC3.58%
ETH3.11%
SOL4.27%
View Original
post-image
  • Reward
  • Comment
  • Repost
  • Share
#FirstTradeOfTheWeek Bitcoin ($BTC) continues to remain the dominant cryptocurrency in the global digital asset market, and its price movements are closely watched by traders and investors worldwide. As of now, Bitcoin is trading around the $68,000–$69,000 range, showing moderate bullish momentum after recovering from recent corrections. The current market structure suggests that Bitcoin is consolidating before its next major move, with both bullish and bearish scenarios possible depending on market catalysts.
From a technical analysis perspective, Bitcoin is holding above a strong support zon
BTC3.58%
post-image
  • Reward
  • Comment
  • Repost
  • Share
$ZEC
See if we get this setup.
ZEC7.81%
post-image
  • Reward
  • Comment
  • Repost
  • Share
Kazakhstan Invests 350 Million in Cryptos with Its Gold Reserves - #kazakhstan #kazakhstanmise #mise
View Original
post-image
  • Reward
  • Comment
  • Repost
  • Share
Last night, the key level of 2030 was repeatedly mentioned. A breakout would suggest looking for a short position near the resistance around 2055. As expected, after the positive news, the market surged to 2053 in the late night, then continued to decline back to around 2000#微策略再砸12.8亿美元增持BTC .
BTC3.58%
View Original
post-image
TradingKingGaoYuliangvip
The market continues to fluctuate upward, facing short-term resistance at the 120-hour moving average and the four-hour dense trading zone. The key battleground is at 2030. After multiple retests and pullbacks under pressure, a successful breakthrough of 2030 could target around 2055. The short-term trend remains relatively strong. Once the market forms a top pattern, consider entering short positions.
repost-content-media
  • Reward
  • 2
  • Repost
  • Share
huangjinshizivip:
Saw last night that the blonde was going to speak, so I quickly cancelled all my pending orders. Fortunately I wasn't trading crude oil, a large number of people who went long on crude oil got wiped out this morning.
View More
Iran's new announcement has shocked the entire world.
"From now on, missiles with less than 1 ton of warhead will not be launched."
Meaning each missile will carry at least 1 ton of explosive.
Just think about it.
In the past 10 days, Iran was launching missiles with 500–750 kilograms of warhead. The world thought they were weakening. The number of missiles also decreased from 350 on the first day to 15 on the eighth day.
But in reality, they were not weakening.
They were learning.
→ 10 days of observing which missiles get intercepted
→ 10 days of mapping Patriot radar signatur
View Original
post-image
post-image
  • Reward
  • Comment
  • Repost
  • Share
Load More

Join 40M users in our growing community

⚡️ Join 40M users in the crypto craze discussion
💬 Engage with your favorite top creators
👍 See what interests you