2025 ASM Price Prediction: Analyzing Market Trends and Potential Growth Factors for Assemble Protocol
Introduction: ASM's Market Position and Investment Value
Assemble AI (ASM), as a pioneer in Web 3.0 journalism, has made significant strides since its inception in 2019. As of 2025, ASM's market capitalization has reached $16,333,872, with a circulating supply of approximately 1,509,600,000 tokens, and a price hovering around $0.01082. This asset, hailed as the "AI-powered Web 3.0 News Revolutionizer," is playing an increasingly crucial role in delivering and analyzing cryptocurrency and global economic trends.
This article will comprehensively analyze ASM's price trends from 2025 to 2030, combining historical patterns, market supply and demand, ecosystem development, and macroeconomic factors to provide investors with professional price predictions and practical investment strategies.
I. ASM Price History Review and Current Market Status
ASM Historical Price Evolution
- 2021: Initial launch, price reached all-time high of $0.64514 on April 26
- 2022: Market downturn, price experienced significant decline
- 2023-2024: Gradual recovery and stabilization period
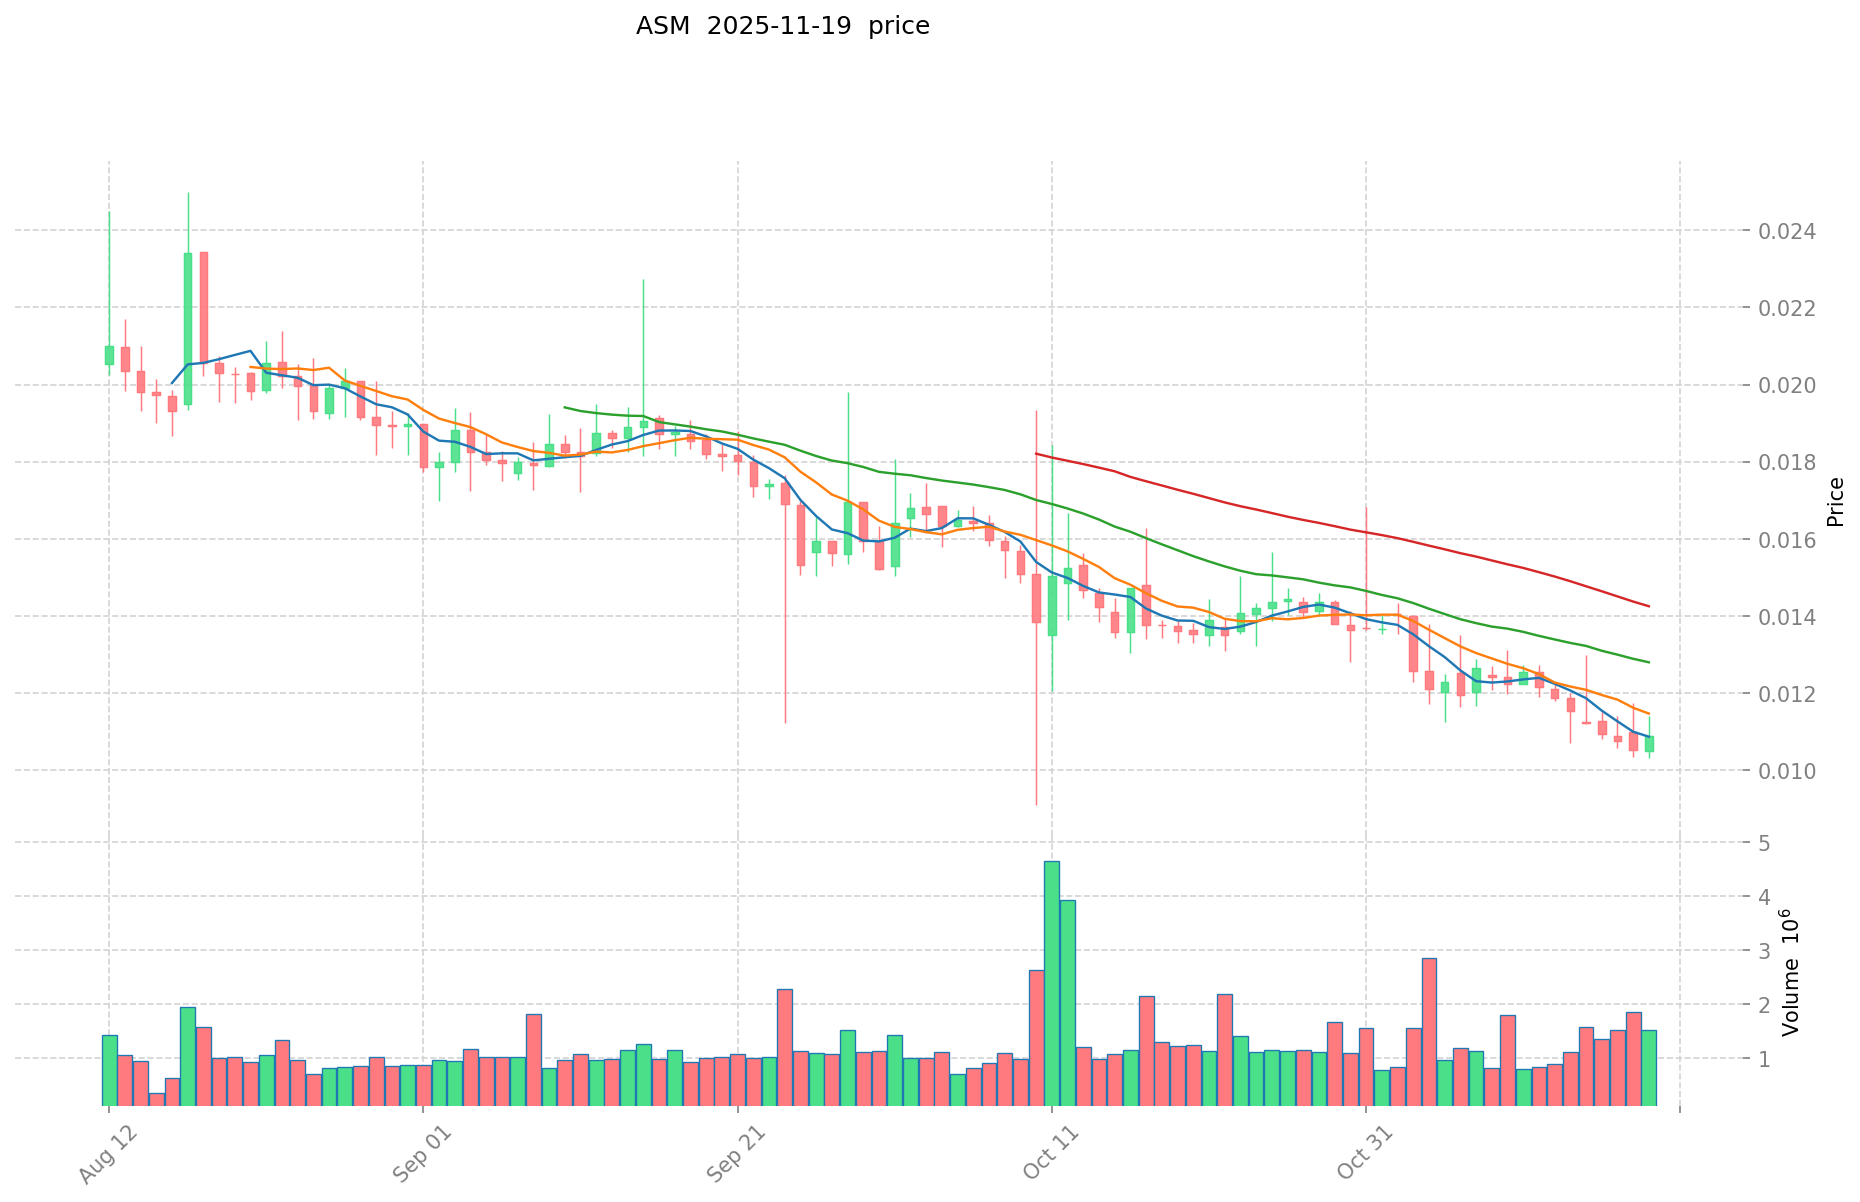
ASM Current Market Situation
As of November 20, 2025, ASM is trading at $0.01082. The token has shown a slight increase of 0.56% in the last 24 hours, indicating short-term positive momentum. However, the longer-term trends reveal a more challenging picture. Over the past week, ASM has declined by 9.59%, and the 30-day performance shows a substantial drop of 21.42%. The yearly performance is even more stark, with a 64.34% decrease, reflecting significant long-term bearish pressure.
The current price is substantially below its all-time high of $0.64514, achieved on April 26, 2021. With a market cap of $16,333,872 and a circulating supply of 1,509,600,000 ASM, the token ranks 993rd in the overall cryptocurrency market. The fully diluted valuation stands at $32,460,000, with a total supply cap of 3,000,000,000 ASM.
Despite recent short-term gains, the overall market sentiment for ASM remains cautious, as indicated by the longer-term price trends. The token's performance will likely be influenced by broader market conditions and the progress of Assemble's AI agent, News3 (NS3), in revolutionizing Web 3.0 journalism.
Click to view the current ASM market price
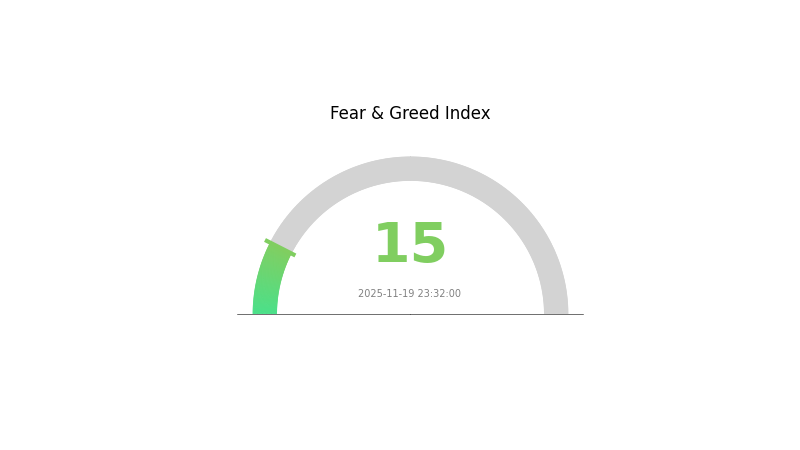
ASM Market Sentiment Indicator
2025-11-19 Fear and Greed Index: 15 (Extreme Fear)
Click to view the current Fear & Greed Index
The crypto market is currently experiencing extreme fear, with the sentiment index at a low of 15. This indicates high levels of uncertainty and risk aversion among investors. During such periods, assets are often undervalued as panic selling occurs. However, this could also present potential buying opportunities for contrarian investors who believe in the long-term potential of cryptocurrencies. As always, it's crucial to conduct thorough research and consider your risk tolerance before making any investment decisions.
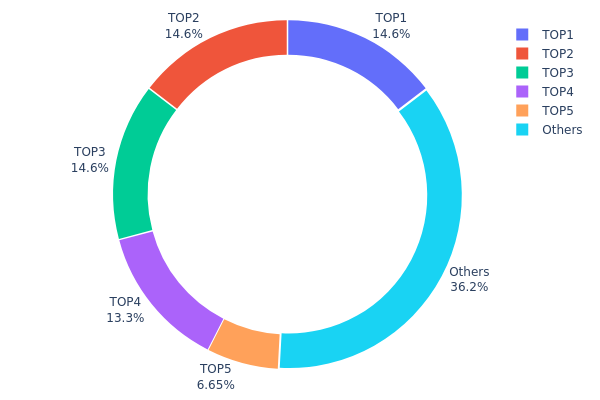
ASM Holdings Distribution
The address holdings distribution chart for ASM reveals a significantly concentrated token distribution among top holders. The top five addresses collectively control 63.76% of the total supply, with the largest holder possessing 14.63%. This high concentration raises concerns about potential market manipulation and price volatility.
The top three addresses each hold approximately 14.58% of the supply, indicating a relatively balanced distribution among major stakeholders. However, the cumulative holdings of these top addresses suggest a centralized structure that could impact market dynamics. The substantial concentration in few hands may lead to increased price sensitivity to large transactions and could potentially affect the token's liquidity and overall market stability.
While 36.24% of tokens are distributed among other addresses, the current distribution pattern indicates a low level of decentralization. This structure may pose challenges to the project's goal of achieving a widely distributed and equitable token ecosystem, potentially impacting governance decisions and long-term sustainability of the ASM network.
Click to view the current ASM Holdings Distribution
| Top | Address | Holding Qty | Holding (%) |
|---|---|---|---|
| 1 | 0x3f9d...e87734 | 219519.21K | 14.63% |
| 2 | 0xc1f9...5c5e46 | 218775.63K | 14.58% |
| 3 | 0x997a...2e3af5 | 218775.63K | 14.58% |
| 4 | 0x1c17...e4b9af | 199865.43K | 13.32% |
| 5 | 0x0621...754d68 | 99762.39K | 6.65% |
| - | Others | 543301.70K | 36.24% |
II. Core Factors Affecting ASM's Future Price
Supply Mechanism
- Market Volatility: High volatility is a significant characteristic of the cryptocurrency market, including ASM. Prices can experience dramatic fluctuations in short periods, potentially leading to substantial gains or losses for investors.
Institutional and Large Holder Dynamics
- Enterprise Adoption: Adoption of ASM by notable companies could significantly impact its price and market perception.
Macroeconomic Environment
- Inflation Hedging Properties: ASM's performance in inflationary environments may influence its attractiveness as an investment asset.
- Geopolitical Factors: International situations and conflicts can affect the broader cryptocurrency market, including ASM.
Technological Development and Ecosystem Building
- Technical Innovation: Ongoing technological advancements in ASM's platform could drive future price movements.
- Ecosystem Applications: The development of major DApps or ecosystem projects on ASM's network may contribute to its value proposition and adoption.
III. ASM Price Prediction for 2025-2030
2025 Outlook
- Conservative prediction: $0.00581 - $0.01076
- Neutral prediction: $0.01076 - $0.0127
- Optimistic prediction: $0.0127 - $0.015 (requires positive market sentiment and project developments)
2027-2028 Outlook
- Market stage expectation: Potential growth phase with increasing adoption
- Price range forecast:
- 2027: $0.01287 - $0.01449
- 2028: $0.01023 - $0.01795
- Key catalysts: Technological advancements, partnerships, and market expansion
2029-2030 Long-term Outlook
- Base scenario: $0.01598 - $0.01886 (assuming steady market growth)
- Optimistic scenario: $0.01886 - $0.02174 (assuming strong project performance and market conditions)
- Transformative scenario: $0.02174 - $0.025 (assuming breakthrough innovations and mass adoption)
- 2030-11-20: ASM $0.01886 (potential 74% increase from 2025)
| 年份 | 预测最高价 | 预测平均价格 | 预测最低价 | 涨跌幅 |
|---|---|---|---|---|
| 2025 | 0.0127 | 0.01076 | 0.00581 | 0 |
| 2026 | 0.01536 | 0.01173 | 0.01138 | 8 |
| 2027 | 0.01449 | 0.01355 | 0.01287 | 25 |
| 2028 | 0.01795 | 0.01402 | 0.01023 | 29 |
| 2029 | 0.02174 | 0.01598 | 0.01023 | 47 |
| 2030 | 0.0198 | 0.01886 | 0.01037 | 74 |
IV. Professional Investment Strategies and Risk Management for ASM
ASM Investment Methodology
(1) Long-term Holding Strategy
- Target investors: Value investors and AI technology enthusiasts
- Operation suggestions:
- Accumulate ASM tokens during market dips
- Set price alerts for significant market movements
- Store tokens in a secure hardware wallet
(2) Active Trading Strategy
- Technical analysis tools:
- Moving Averages: Use to identify trends and potential entry/exit points
- Relative Strength Index (RSI): Monitor overbought/oversold conditions
- Key points for swing trading:
- Monitor News3 (NS3) development updates and adoption rates
- Track overall market sentiment towards AI and Web 3.0 projects
ASM Risk Management Framework
(1) Asset Allocation Principles
- Conservative investors: 1-3% of crypto portfolio
- Moderate investors: 3-5% of crypto portfolio
- Aggressive investors: 5-10% of crypto portfolio
(2) Risk Hedging Solutions
- Diversification: Spread investments across different AI and Web 3.0 projects
- Stop-loss orders: Implement to limit potential losses
(3) Secure Storage Solutions
- Hot wallet recommendation: Gate Web3 Wallet
- Cold storage solution: Hardware wallet for long-term holdings
- Security precautions: Enable two-factor authentication, use strong passwords, and regularly update software
V. Potential Risks and Challenges for ASM
ASM Market Risks
- High volatility: Cryptocurrency market fluctuations can lead to significant price swings
- Competition: Other AI and Web 3.0 projects may outperform ASM
- Adoption risk: Slow uptake of News3 (NS3) could impact ASM's value
ASM Regulatory Risks
- Uncertain regulations: Changes in cryptocurrency regulations could affect ASM's operations
- Cross-border compliance: Varying international regulations may limit global expansion
- AI governance: Future AI regulations could impact News3 (NS3) development
ASM Technical Risks
- Smart contract vulnerabilities: Potential security breaches in the ASM token contract
- AI performance issues: News3 (NS3) may not meet performance expectations
- Scalability challenges: Potential limitations in handling increased user demand
VI. Conclusion and Action Recommendations
ASM Investment Value Assessment
ASM presents a unique value proposition in the AI-driven Web 3.0 space, with potential for long-term growth. However, short-term volatility and adoption risks should be carefully considered.
ASM Investment Recommendations
✅ Beginners: Start with small, regular investments to understand the market dynamics ✅ Experienced investors: Consider a balanced approach, combining long-term holding with strategic trading ✅ Institutional investors: Conduct thorough due diligence on the Assemble Protocol team and technology before significant investments
ASM Trading Participation Methods
- Spot trading: Buy and sell ASM tokens on Gate.com
- Staking: Participate in staking programs if available to earn passive income
- DeFi integration: Explore decentralized finance opportunities involving ASM tokens
Cryptocurrency investments carry extremely high risks, and this article does not constitute investment advice. Investors should make decisions carefully based on their own risk tolerance and are advised to consult professional financial advisors. Never invest more than you can afford to lose.
FAQ
Is assemble AI a good investment?
Assemble AI shows bullish trends, making it a potentially good investment. Technical analysis suggests favorable market conditions for growth.
Will hamster kombat reach $1?
While Hamster Kombat has seen significant growth, it hasn't reached $1 yet. Analysts suggest potential for further increase, but no confirmed $1 target exists as of now.
Does API3 have a future?
API3 shows promise, with analysts projecting $8-$15 by 2030. Despite challenges, its long-term outlook appears positive for patient investors.
Is ASm a good stock to buy?
ASM is considered a strong buy by analysts, with a 12-month price target of $5.27, indicating potential growth. However, always research thoroughly before investing.
Share
Content
Introduction: ASM's Market Position and Investment Value
I. ASM Price History Review and Current Market Status
II. Core Factors Affecting ASM's Future Price
III. ASM Price Prediction for 2025-2030
IV. Professional Investment Strategies and Risk Management for ASM
V. Potential Risks and Challenges for ASM
VI. Conclusion and Action Recommendations
FAQ

