2025 OBOL Price Prediction: Analyzing Growth Potential and Market Trends for the Decentralized Staking Protocol
Introduction: OBOL's Market Position and Investment Value
Obol (OBOL), as a decentralized infrastructure network for Web3, has been making significant strides since its inception. As of 2025, Obol's market capitalization stands at $7,847,878, with a circulating supply of approximately 132,700,000 tokens, and a price hovering around $0.05914. This asset, often referred to as the "foundation for decentralized systems," is playing an increasingly crucial role in powering the next generation of decentralized infrastructure.
This article will provide a comprehensive analysis of Obol's price trends from 2025 to 2030, combining historical patterns, market supply and demand, ecosystem development, and macroeconomic factors to offer professional price predictions and practical investment strategies for investors.
I. OBOL Price History Review and Current Market Status
OBOL Historical Price Evolution
- 2025 May: OBOL reached its all-time high of $0.4211, marking a significant milestone for the project
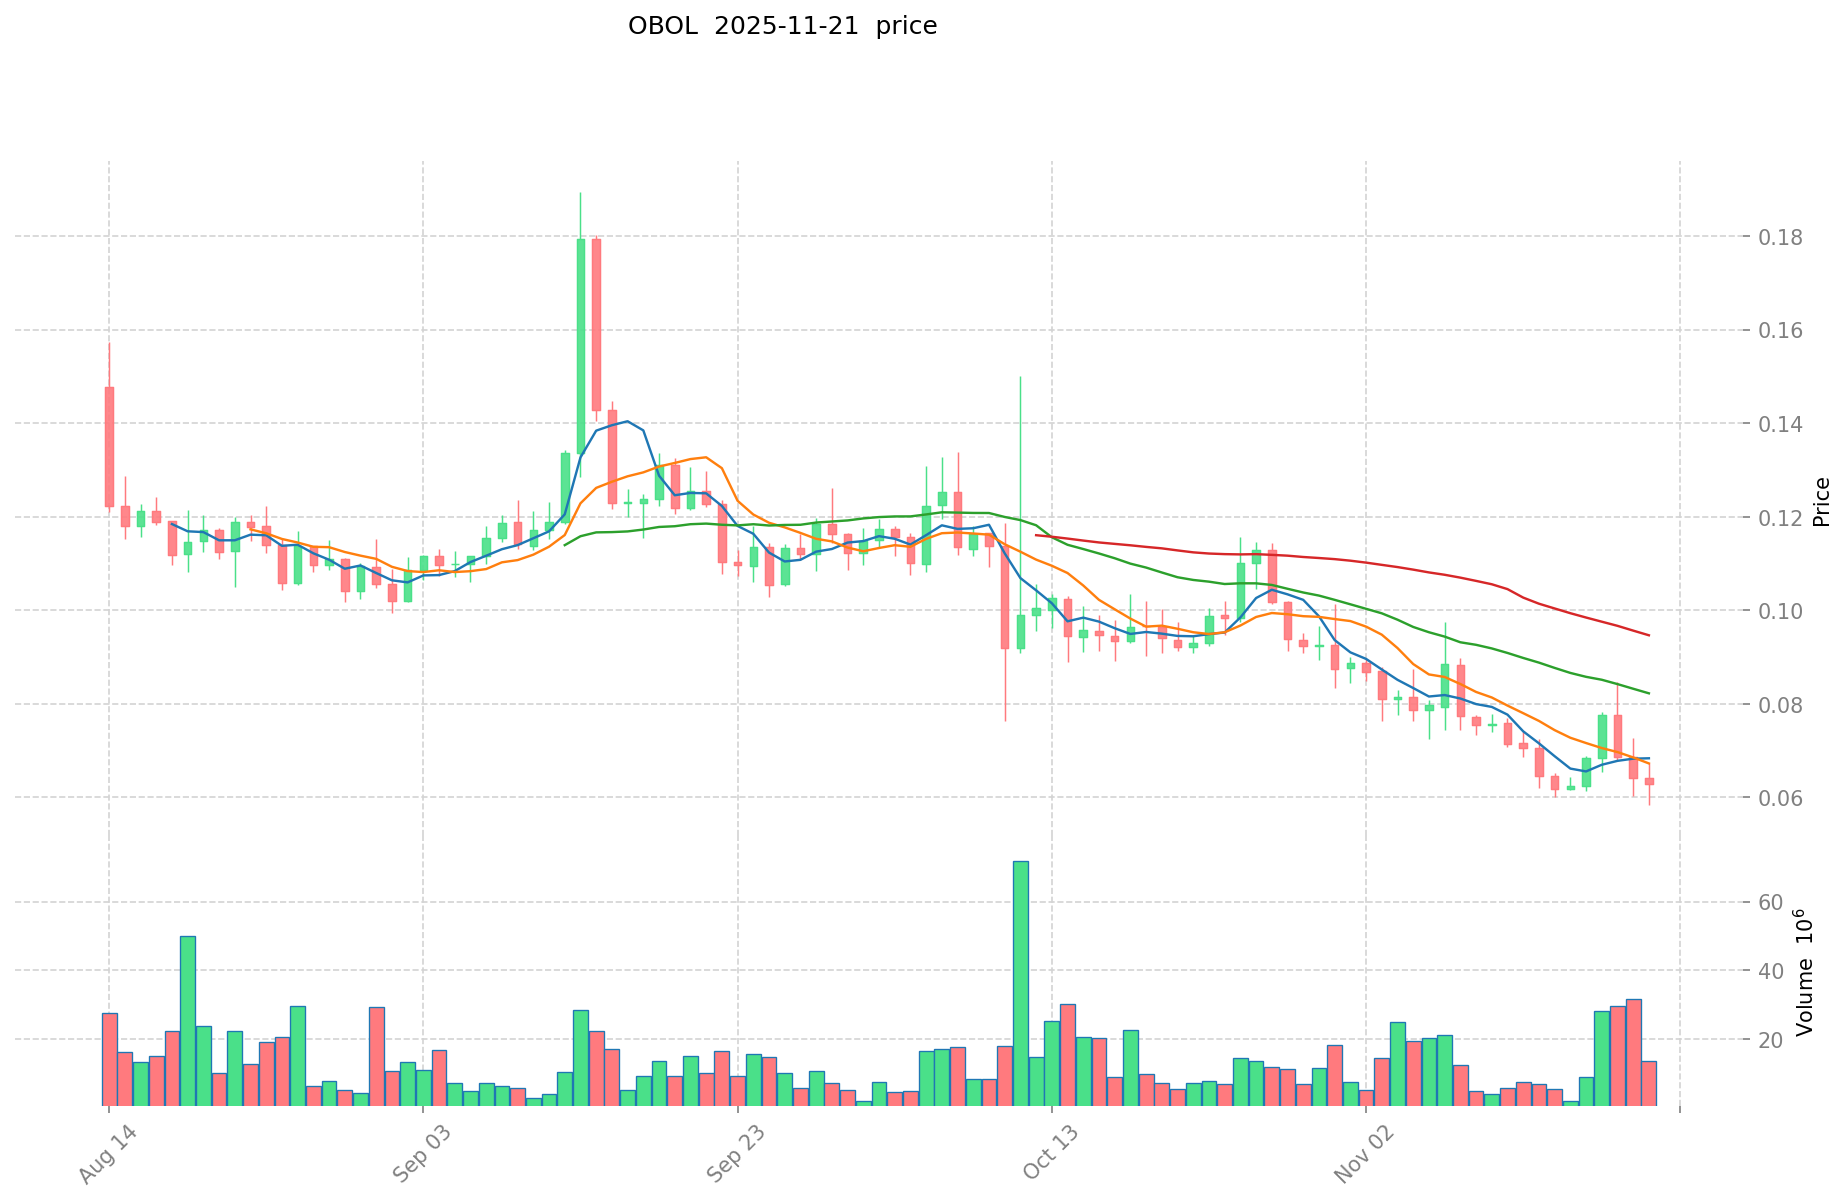
- 2025 November: The price experienced a sharp decline, reaching its all-time low of $0.05659 on November 21
OBOL Current Market Situation
As of November 21, 2025, OBOL is trading at $0.05914, representing a 24-hour decrease of 6.79%. The token's market capitalization stands at $7,847,878, with a circulating supply of 132,700,000 OBOL. The trading volume over the past 24 hours is $1,010,260.97. OBOL has experienced significant price volatility, with a 37.1% decrease over the past 30 days and an 86.066% decline over the past year. The current price is 85.96% below its all-time high, indicating a bearish trend in the market.
Click to view the current OBOL market price
OBOL Market Sentiment Indicator
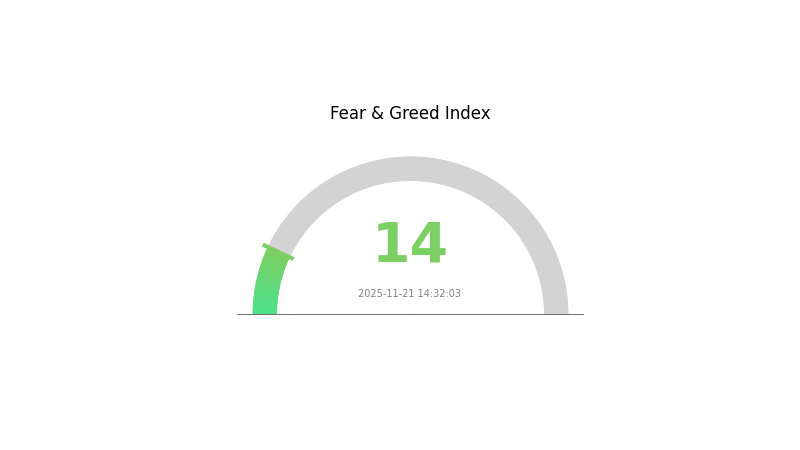
2025-11-21 Fear and Greed Index: 14 (Extreme Fear)
Click to view the current Fear & Greed Index
The crypto market is gripped by extreme fear today, with the Fear and Greed Index plummeting to a mere 14. This level of pessimism often signals a potential buying opportunity for contrarian investors. However, it's crucial to approach with caution and conduct thorough research. Remember, market sentiment can shift rapidly. Stay informed, diversify your portfolio, and consider using Gate.com's advanced trading tools to navigate these turbulent waters.
OBOL Holdings Distribution
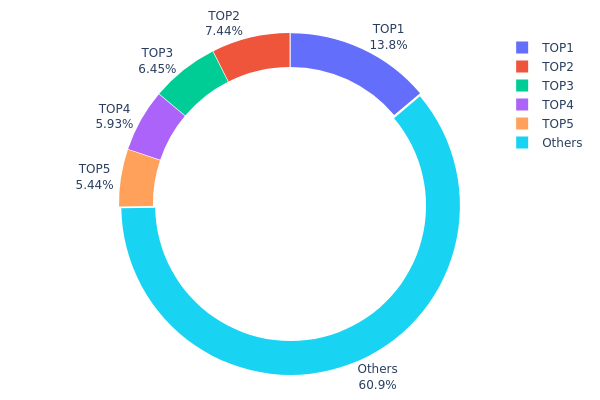
The address holdings distribution data provides insights into the concentration of OBOL tokens among different addresses. Analysis of this data reveals a moderate level of concentration in OBOL's token distribution. The top address holds 13.83% of the total supply, with the next four largest holders accounting for 7.43%, 6.45%, 5.92%, and 5.44% respectively. Collectively, the top five addresses control 39.07% of the total OBOL supply.
While this level of concentration is notable, it does not necessarily indicate excessive centralization. The fact that 60.93% of tokens are distributed among "Others" suggests a relatively wide distribution beyond the top holders. This distribution pattern may contribute to market stability, as no single address has overwhelming control. However, it's important to note that significant price movements could still occur if any of the top holders decide to liquidate their positions.
The current distribution reflects a balance between concentrated holdings and wider participation, which could be seen as a positive sign for OBOL's market structure and potential for decentralization. However, continued monitoring of this distribution is crucial to assess any shifts that might impact market dynamics or token governance.
Click to view the current OBOL Holdings Distribution
| Top | Address | Holding Qty | Holding (%) |
|---|---|---|---|
| 1 | 0xaefd...fef5fb | 69186.76K | 13.83% |
| 2 | 0x42d2...c1fa72 | 37181.36K | 7.43% |
| 3 | 0x872a...6eb205 | 32255.03K | 6.45% |
| 4 | 0xdc8a...e4c374 | 29637.31K | 5.92% |
| 5 | 0x1986...f5d227 | 27215.13K | 5.44% |
| - | Others | 304524.40K | 60.93% |
II. Core Factors Affecting OBOL's Future Price
Macroeconomic Environment
- Inflation Hedging Properties: As a cryptocurrency, OBOL may potentially serve as a hedge against inflation in certain economic conditions. However, its effectiveness as an inflation hedge would depend on various factors and market dynamics.
Technical Development and Ecosystem Building
- Ecosystem Applications: OBOL is likely to have some decentralized applications (DApps) or ecosystem projects built on its platform, which could contribute to its utility and adoption. The specifics of these applications would need to be researched further for accurate information.
III. OBOL Price Prediction for 2025-2030
2025 Outlook
- Conservative forecast: $0.04995 - $0.05947
- Neutral forecast: $0.05947 - $0.07077
- Optimistic forecast: $0.07077 - $0.08207 (requires positive market sentiment and project developments)
2026-2027 Outlook
- Market phase expectation: Potential growth phase with increasing adoption
- Price range prediction:
- 2026: $0.03751 - $0.10049
- 2027: $0.07707 - $0.12331
- Key catalysts: Project milestones, ecosystem expansion, and overall crypto market recovery
2028-2030 Long-term Outlook
- Base scenario: $0.10447 - $0.12609 (assuming steady project growth and market stability)
- Optimistic scenario: $0.12609 - $0.15131 (assuming strong project performance and favorable market conditions)
- Transformative scenario: $0.15131+ (assuming breakthrough innovations and widespread adoption)
- 2030-11-21: OBOL $0.12609 (potential 113% increase from 2025 levels)
| 年份 | 预测最高价 | 预测平均价格 | 预测最低价 | 涨跌幅 |
|---|---|---|---|---|
| 2025 | 0.08207 | 0.05947 | 0.04995 | 0 |
| 2026 | 0.10049 | 0.07077 | 0.03751 | 19 |
| 2027 | 0.12331 | 0.08563 | 0.07707 | 44 |
| 2028 | 0.13686 | 0.10447 | 0.08462 | 76 |
| 2029 | 0.13152 | 0.12066 | 0.10377 | 104 |
| 2030 | 0.15131 | 0.12609 | 0.07818 | 113 |
IV. OBOL Professional Investment Strategy and Risk Management
OBOL Investment Methodology
(1) Long-term Holding Strategy
- Suitable for: Investors with a high risk tolerance and long-term perspective
- Operation suggestions:
- Accumulate OBOL tokens during market dips
- Set price alerts for significant price movements
- Store tokens in secure, non-custodial wallets
(2) Active Trading Strategy
- Technical analysis tools:
- Moving Averages: Use to identify trends and potential reversal points
- Relative Strength Index (RSI): Monitor overbought/oversold conditions
- Key points for swing trading:
- Monitor trading volume for trend confirmation
- Set stop-loss orders to limit potential losses
OBOL Risk Management Framework
(1) Asset Allocation Principles
- Conservative investors: 1-3% of crypto portfolio
- Aggressive investors: 5-10% of crypto portfolio
- Professional investors: Up to 15% of crypto portfolio
(2) Risk Hedging Solutions
- Diversification: Spread investments across multiple crypto assets
- Stop-loss orders: Implement to limit potential losses
(3) Secure Storage Solutions
- Hot wallet recommendation: Gate Web3 Wallet
- Cold storage solution: Hardware wallet for long-term holdings
- Security precautions: Enable two-factor authentication, use strong passwords
V. Potential Risks and Challenges for OBOL
OBOL Market Risks
- High volatility: OBOL price may experience significant fluctuations
- Limited liquidity: May impact ability to execute large trades quickly
- Competition: Other projects in the decentralized infrastructure space
OBOL Regulatory Risks
- Uncertain regulatory environment: Potential for new regulations affecting OBOL
- Cross-border compliance: Varying regulations across different jurisdictions
- Tax implications: Evolving tax laws related to cryptocurrency transactions
OBOL Technical Risks
- Smart contract vulnerabilities: Potential for exploits or bugs in the code
- Scalability challenges: Ability to handle increased network demand
- Technological obsolescence: Risk of being surpassed by newer technologies
VI. Conclusion and Action Recommendations
OBOL Investment Value Assessment
OBOL presents a unique value proposition in the decentralized infrastructure space, with potential for long-term growth. However, short-term volatility and regulatory uncertainties pose significant risks.
OBOL Investment Recommendations
✅ Beginners: Consider small, experimental positions after thorough research
✅ Experienced investors: Implement dollar-cost averaging strategy with strict risk management
✅ Institutional investors: Conduct comprehensive due diligence and consider as part of a diversified crypto portfolio
OBOL Trading Participation Methods
- Spot trading: Buy and sell OBOL tokens on Gate.com
- Staking: Participate in OBOL staking programs if available
- DeFi integration: Explore OBOL's potential use in decentralized finance protocols
Cryptocurrency investments carry extremely high risks, and this article does not constitute investment advice. Investors should make decisions carefully based on their own risk tolerance and are advised to consult professional financial advisors. Never invest more than you can afford to lose.
FAQ
Which coin will reach $1 in 2030?
While it's difficult to predict, OBOL has potential to reach $1 by 2030 due to its innovative technology and growing adoption in the Web3 space.
Does Polkastarter have a future?
Yes, Polkastarter has a promising future. As a leading launchpad for cross-chain token pools and auctions, it continues to innovate and adapt to the evolving DeFi landscape, attracting quality projects and investors.
Can Solana reach $1000 in 2025?
Yes, Solana could potentially reach $1000 in 2025. With its high-speed blockchain and growing ecosystem, Solana has the potential for significant price appreciation, especially if crypto market conditions remain favorable.
How much is Obol token worth?
As of November 2025, Obol token is worth approximately $2.50. The price has shown steady growth over the past year, reflecting increased adoption and positive market sentiment in the Web3 ecosystem.
Share
Content
Introduction: OBOL's Market Position and Investment Value
I. OBOL Price History Review and Current Market Status
II. Core Factors Affecting OBOL's Future Price
III. OBOL Price Prediction for 2025-2030
IV. OBOL Professional Investment Strategy and Risk Management
V. Potential Risks and Challenges for OBOL
VI. Conclusion and Action Recommendations
FAQ

