2025 TURTLE Price Prediction: Navigating the Crypto Seas with Cautious Optimism
Introduction: TURTLE's Market Position and Investment Value
Turtle (TURTLE) as the first Distribution Protocol that monetizes Web3 activity, has been playing an increasingly crucial role in aligning incentives among key DeFi players since its inception. As of 2025, TURTLE's market capitalization has reached $11,789,687, with a circulating supply of approximately 154,700,000 tokens, and a price hovering around $0.07621. This asset, hailed as the "DeFi Safeguarding Layer," is making significant contributions in the field of decentralized finance.
This article will provide a comprehensive analysis of TURTLE's price trends from 2025 to 2030, combining historical patterns, market supply and demand, ecosystem development, and macroeconomic factors to offer professional price predictions and practical investment strategies for investors.
I. TURTLE Price History Review and Current Market Status
TURTLE Historical Price Evolution
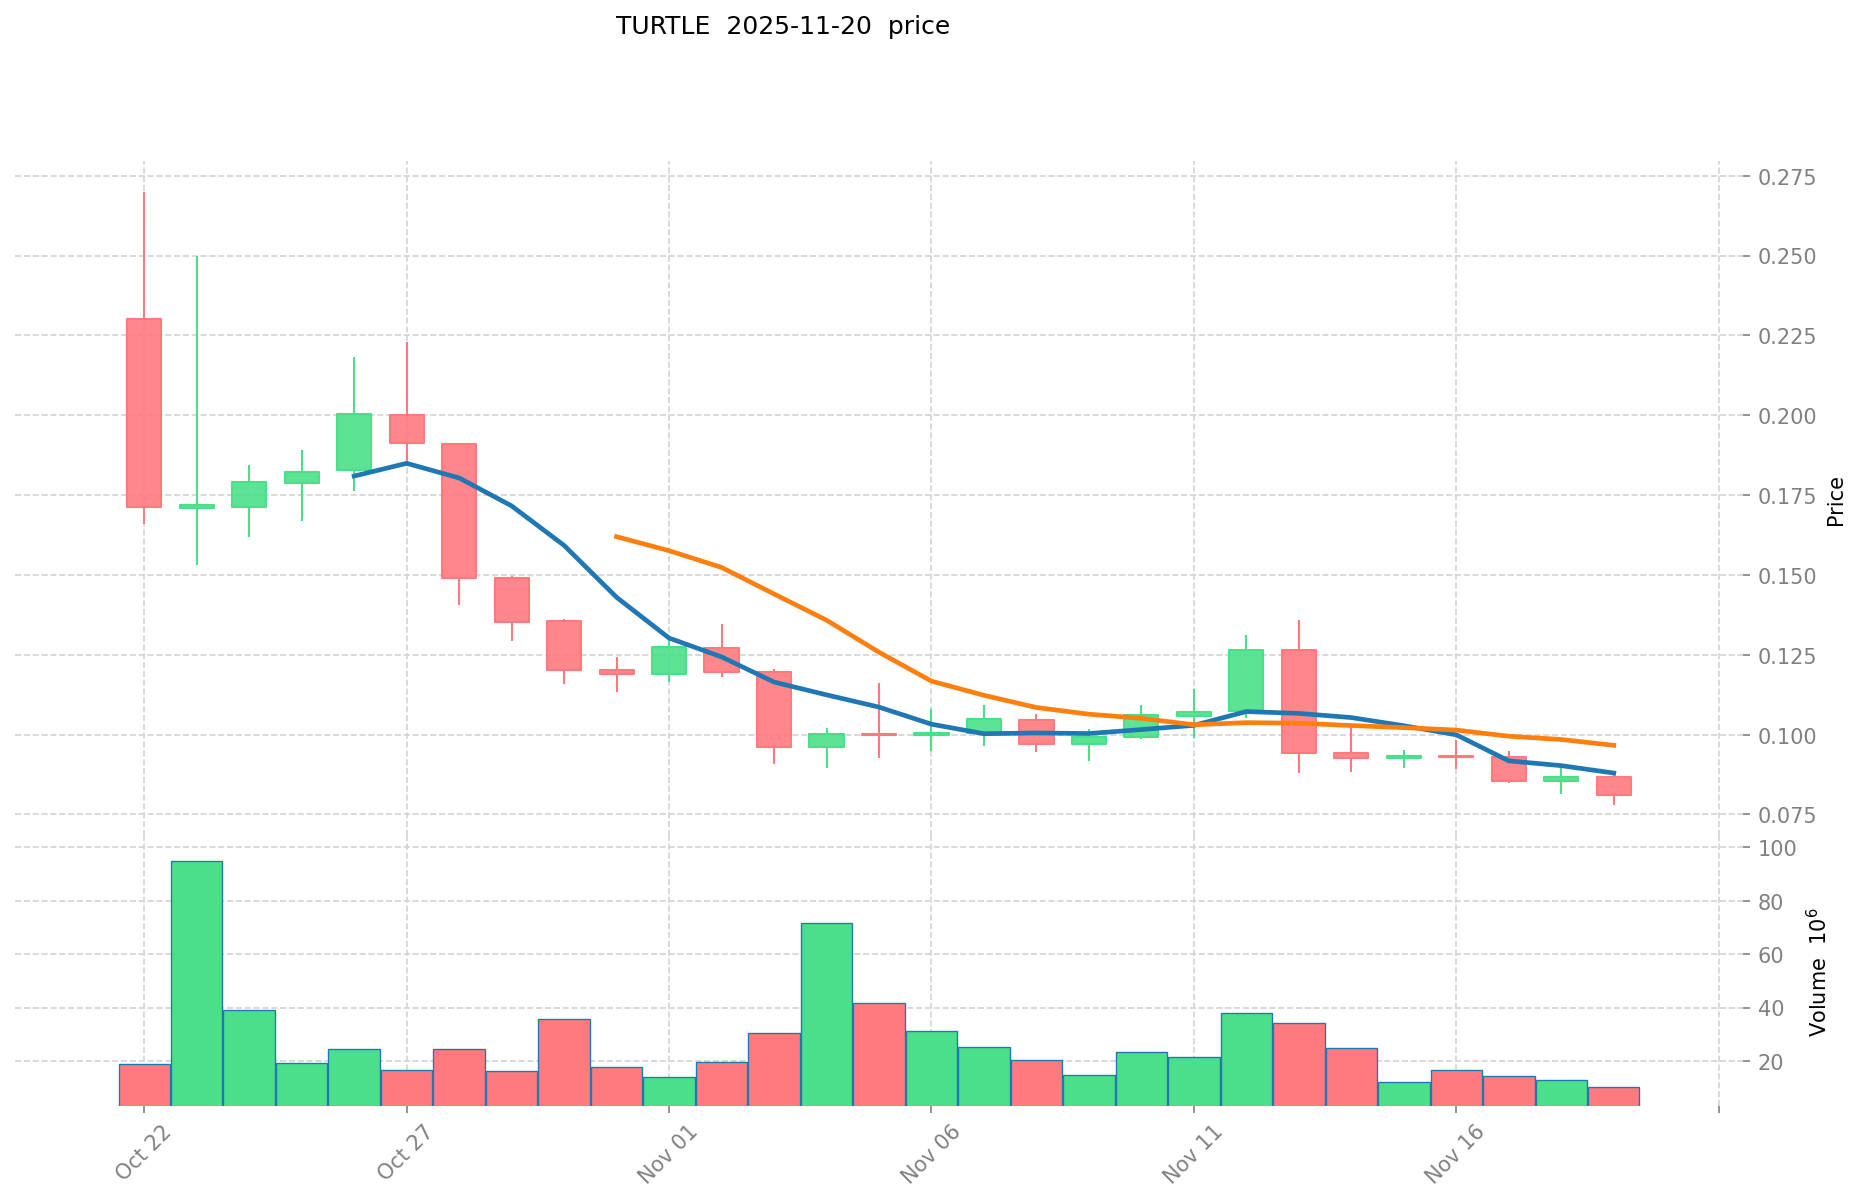
- 2025: TURTLE launched, price reached all-time high of $0.26998 on October 22
- 2025: Market correction, price dropped to all-time low of $0.07547 on November 20
TURTLE Current Market Situation
As of November 21, 2025, TURTLE is trading at $0.07621, representing a 24-hour decline of 4.97%. The current price is significantly below its all-time high, indicating a bearish trend. The token's market capitalization stands at $11,789,687, with a circulating supply of 154,700,000 TURTLE out of a total supply of 1,000,000,000. The fully diluted market cap is $76,210,000.
TURTLE has experienced substantial price volatility recently, with a 20.03% decrease over the past week. The 24-hour trading volume is $987,402.85, suggesting moderate market activity. The token's market dominance is relatively low at 0.0024%, indicating it's a small-cap cryptocurrency in the overall market.
Click to view the current TURTLE market price
TURTLE Market Sentiment Indicator
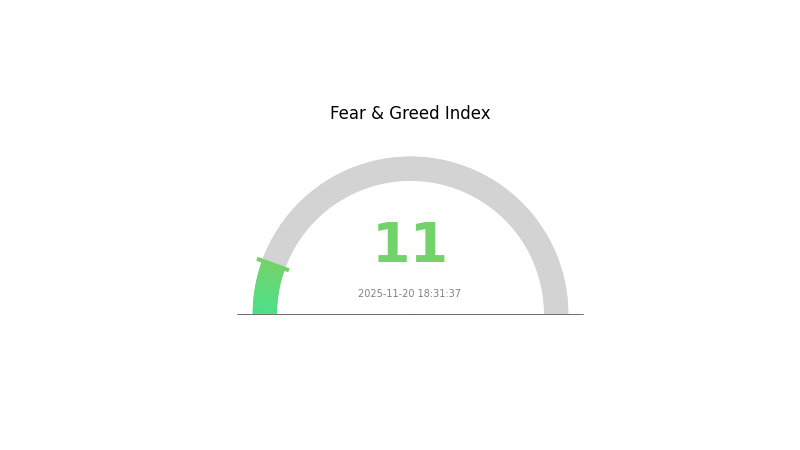
2025-11-20 Fear and Greed Index: 11 (Extreme Fear)
Click to view the current Fear & Greed Index
The crypto market is experiencing extreme fear, with the sentiment index plummeting to 11. This indicates a highly pessimistic outlook among investors. During such periods, assets are often undervalued, potentially presenting buying opportunities for contrarian investors. However, caution is advised as market volatility may persist. It's crucial to conduct thorough research and consider your risk tolerance before making investment decisions. Remember, market sentiment can shift rapidly, and past performance doesn't guarantee future results.
TURTLE Holdings Distribution
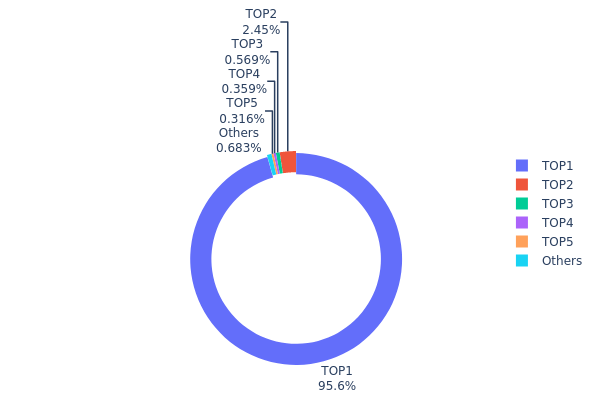
The address holdings distribution data for TURTLE reveals a highly concentrated ownership structure. The top address holds an overwhelming 95.62% of the total supply, equivalent to 666,000,000 TURTLE tokens. This extreme concentration raises significant concerns about centralization and potential market manipulation.
The second-largest holder possesses only 2.45% of the supply, while the remaining top 5 addresses collectively account for less than 2% of the total. This stark imbalance in token distribution suggests a lack of decentralization and could potentially lead to increased price volatility. The dominance of a single address holding such a large percentage of tokens may also impact market liquidity and create barriers for new investors to acquire significant positions.
From a market structure perspective, this concentration poses risks to the overall stability and fairness of TURTLE's ecosystem. It may deter potential investors and limit the token's ability to achieve widespread adoption. The current distribution pattern indicates a need for improved token dispersion to enhance the project's long-term viability and reduce the risk of market manipulation.
Click to view the current TURTLE Holdings Distribution
| Top | Address | Holding Qty | Holding (%) |
|---|---|---|---|
| 1 | 0x2e03...7f25b2 | 666000.00K | 95.62% |
| 2 | 0x28c6...f21d60 | 17073.25K | 2.45% |
| 3 | 0x0d07...b492fe | 3963.05K | 0.56% |
| 4 | 0x8893...60d48f | 2500.00K | 0.35% |
| 5 | 0x1157...8f4101 | 2199.99K | 0.31% |
| - | Others | 4754.07K | 0.70999999999999% |
II. Core Factors Affecting TURTLE's Future Price
Technical Development and Ecosystem Building
- TurtleShell Protocol: An upgrade to enhance security and privacy features for TURTLE transactions.
- TurtleNest: A new staking mechanism to incentivize long-term holding and network participation.
- Ecosystem Applications: Development of decentralized finance (DeFi) platforms and non-fungible token (NFT) marketplaces built on the TURTLE blockchain.
III. TURTLE Price Prediction for 2025-2030
2025 Outlook
- Conservative forecast: $0.04421 - $0.07000
- Neutral forecast: $0.07000 - $0.07622
- Optimistic forecast: $0.07622 - $0.08156 (requires positive market sentiment and project developments)
2027-2028 Outlook
- Market phase expectation: Potential growth phase with increased volatility
- Price range forecast:
- 2027: $0.04768 - $0.11779
- 2028: $0.09296 - $0.14155
- Key catalysts: Project upgrades, market adoption, and overall crypto market trends
2029-2030 Long-term Outlook
- Base scenario: $0.10258 - $0.12545 (assuming steady project development and market growth)
- Optimistic scenario: $0.12545 - $0.16308 (assuming strong adoption and favorable market conditions)
- Transformative scenario: $0.16308 - $0.18000 (assuming breakthrough innovations and mass adoption)
- 2030-12-31: TURTLE $0.16308 (potential peak price based on optimistic projections)
| 年份 | 预测最高价 | 预测平均价格 | 预测最低价 | 涨跌幅 |
|---|---|---|---|---|
| 2025 | 0.08156 | 0.07622 | 0.04421 | 0 |
| 2026 | 0.10808 | 0.07889 | 0.06942 | 3 |
| 2027 | 0.11779 | 0.09348 | 0.04768 | 22 |
| 2028 | 0.14155 | 0.10563 | 0.09296 | 38 |
| 2029 | 0.1273 | 0.12359 | 0.10258 | 61 |
| 2030 | 0.16308 | 0.12545 | 0.10161 | 64 |
IV. TURTLE Professional Investment Strategy and Risk Management
TURTLE Investment Methodology
(1) Long-term Holding Strategy
- Suitable for: Risk-tolerant investors with a long-term perspective
- Operational suggestions:
- Accumulate TURTLE tokens during market dips
- Stake tokens to earn passive income
- Store tokens in secure hardware wallets
(2) Active Trading Strategy
- Technical analysis tools:
- Moving Averages: Use to identify trends and potential reversal points
- Relative Strength Index (RSI): Monitor overbought/oversold conditions
- Key points for swing trading:
- Set clear entry and exit points based on technical indicators
- Implement strict stop-loss orders to manage risk
TURTLE Risk Management Framework
(1) Asset Allocation Principles
- Conservative investors: 1-3% of crypto portfolio
- Aggressive investors: 5-10% of crypto portfolio
- Professional investors: 10-15% of crypto portfolio
(2) Risk Hedging Solutions
- Diversification: Spread investments across multiple crypto assets
- Dollar-Cost Averaging: Regular small purchases to mitigate market volatility
(3) Secure Storage Solutions
- Hot wallet recommendation: Gate Web3 Wallet
- Cold storage solution: Use hardware wallets for long-term holdings
- Security precautions: Enable two-factor authentication, use strong passwords
V. TURTLE Potential Risks and Challenges
TURTLE Market Risks
- High volatility: Significant price fluctuations common in crypto markets
- Liquidity risk: Potential difficulties in large-volume trades
- Competition: Emerging projects may challenge TURTLE's market position
TURTLE Regulatory Risks
- Uncertain regulatory landscape: Potential for unfavorable regulations
- Cross-border compliance: Challenges in adhering to varied international laws
- Tax implications: Evolving tax treatment of crypto assets
TURTLE Technical Risks
- Smart contract vulnerabilities: Potential for exploits or bugs
- Scalability challenges: Possible network congestion during high demand
- Interoperability issues: Compatibility problems with other blockchain networks
VI. Conclusion and Action Recommendations
TURTLE Investment Value Assessment
TURTLE presents a unique value proposition in the DeFi space with its focus on incentive alignment and risk mitigation. However, investors should be aware of the high volatility and regulatory uncertainties in the crypto market.
TURTLE Investment Recommendations
✅ Beginners: Start with small, regular investments to understand the market dynamics ✅ Experienced investors: Consider a balanced approach of holding and active trading ✅ Institutional investors: Explore strategic partnerships and large-scale staking opportunities
TURTLE Trading Participation Methods
- Spot trading: Buy and sell TURTLE tokens on Gate.com
- Staking: Participate in TURTLE's staking program for passive income
- DeFi integration: Utilize TURTLE in various DeFi protocols for yield farming
Cryptocurrency investments carry extremely high risks, and this article does not constitute investment advice. Investors should make decisions based on their own risk tolerance and are advised to consult professional financial advisors. Never invest more than you can afford to lose.
FAQ
Is Trumpcoin expected to go up?
Yes, Trumpcoin is expected to go up. With growing political interest and potential market speculation, its value may increase in the coming months.
Can Solana reach $1000 in 2025?
Yes, Solana could potentially reach $1000 in 2025. With its high-speed blockchain and growing ecosystem, Solana has the potential for significant price appreciation, especially if crypto adoption continues to increase.
How much is a TURTLE coin worth?
As of November 2025, a TURTLE coin is worth approximately $0.15. The price has seen steady growth over the past year, reflecting increased adoption and market interest in the project.
Can pi coin reach $100?
It's highly unlikely for Pi coin to reach $100. Given its large supply and current market trends, a more realistic long-term price target might be in the range of a few cents to a dollar.
Share
Content
Introduction: TURTLE's Market Position and Investment Value
I. TURTLE Price History Review and Current Market Status
II. Core Factors Affecting TURTLE's Future Price
III. TURTLE Price Prediction for 2025-2030
IV. TURTLE Professional Investment Strategy and Risk Management
V. TURTLE Potential Risks and Challenges
VI. Conclusion and Action Recommendations
FAQ

