FAIR3 vs GRT: Comparing Two Leading Blockchain Data Storage Solutions for Enterprise Applications
Introduction: FAIR3 vs GRT Investment Comparison
In the cryptocurrency market, the comparison between FAIR3 vs GRT has been an unavoidable topic for investors. The two not only show significant differences in market cap ranking, application scenarios, and price performance but also represent different positioning in the crypto asset space.
FAIR3 (FAIR3): Since its launch in 2025, it has gained market recognition for its focus on decentralized technical fairness and community governance.
The Graph (GRT): Introduced in 2020, it has been hailed as the "Google of blockchains," becoming one of the most widely used indexing protocols for querying blockchain data.
This article will comprehensively analyze the investment value comparison between FAIR3 vs GRT, focusing on historical price trends, supply mechanisms, institutional adoption, technological ecosystems, and future predictions, attempting to answer the question investors care about most:
"Which is the better buy right now?"
I. Price History Comparison and Current Market Status
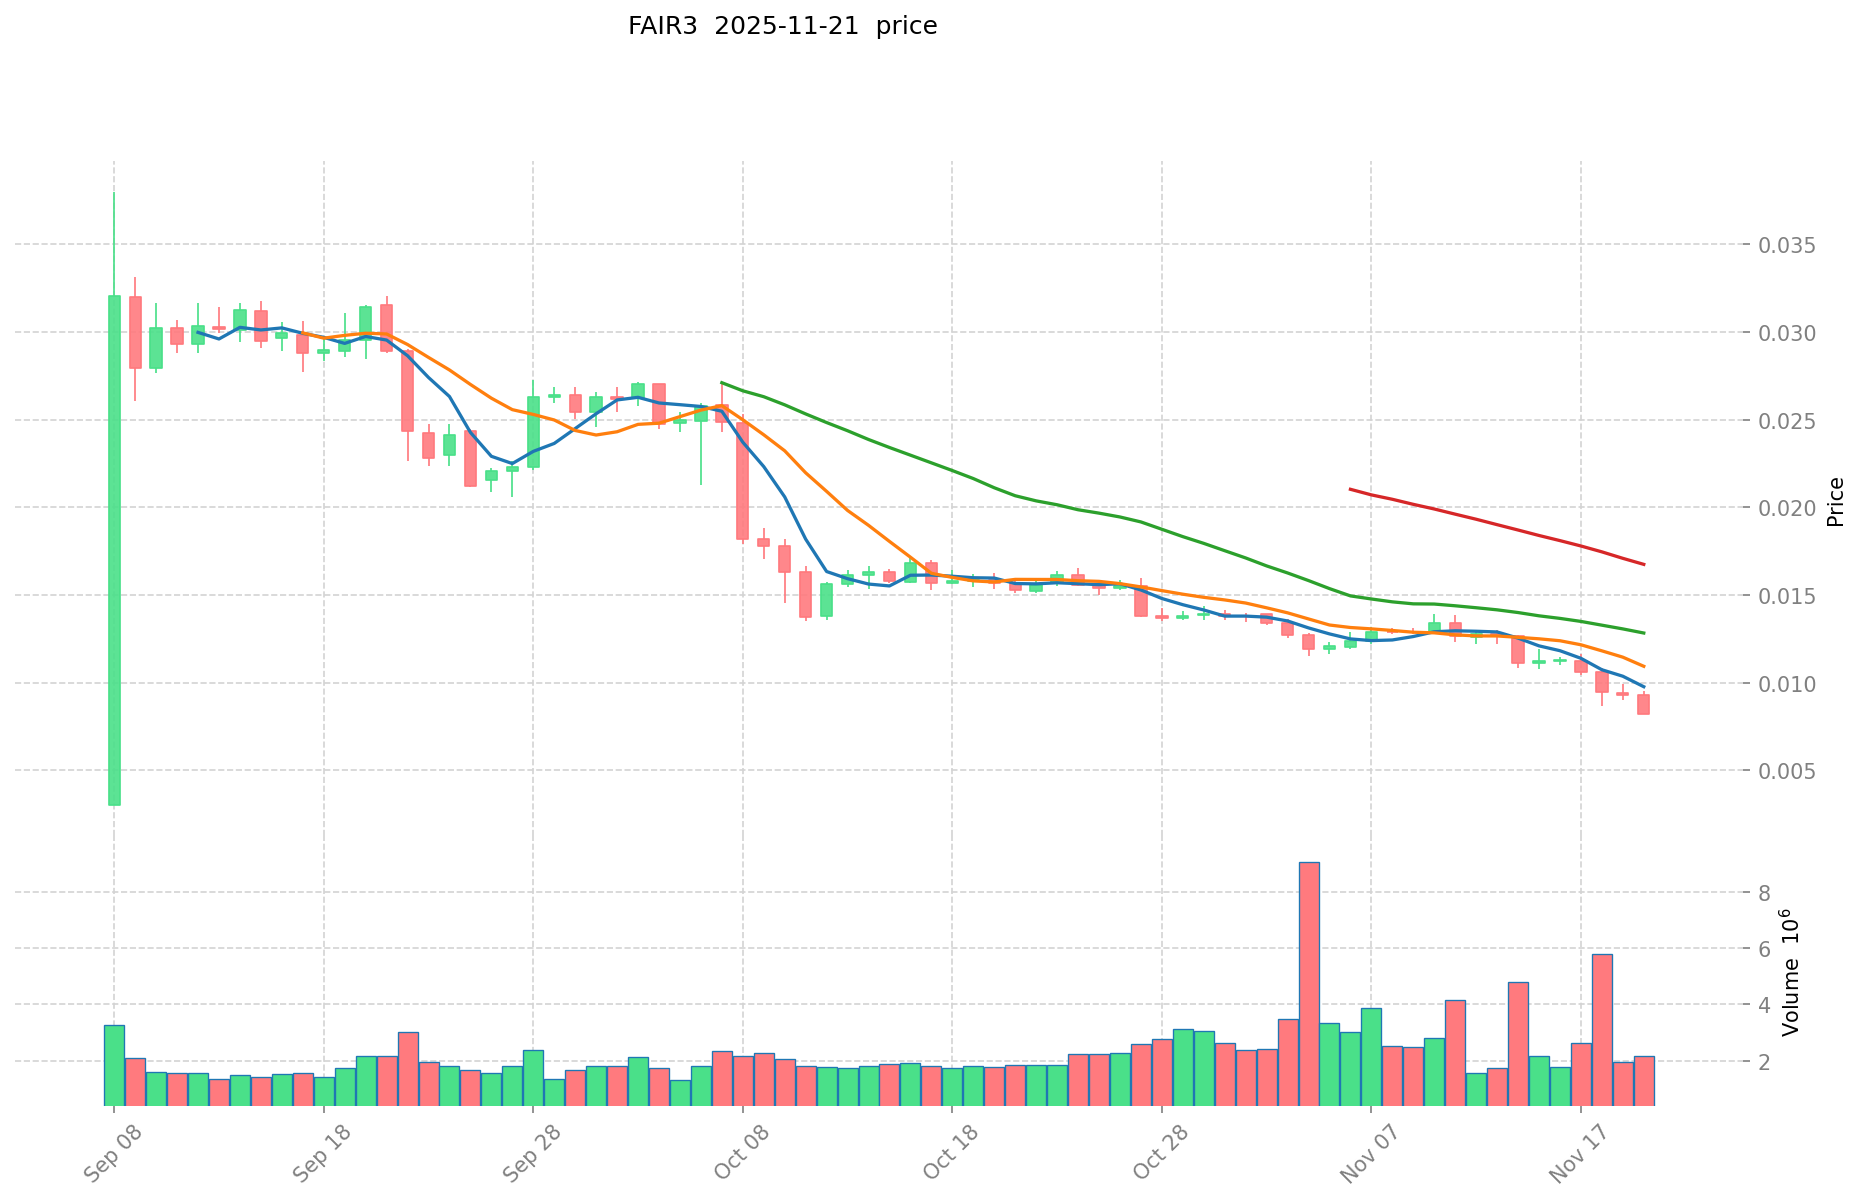
FAIR3 (Coin A) and GRT (Coin B) Historical Price Trends
- 2025: FAIR3 reached its all-time high of $0.038 on September 8, 2025.
- 2021: GRT hit its all-time high of $2.84 on February 12, 2021.
- Comparative Analysis: FAIR3 has fallen from its high of $0.038 to a current price of $0.00805, while GRT has declined from its peak of $2.84 to $0.05085.
Current Market Situation (2025-11-22)
- FAIR3 current price: $0.00805
- GRT current price: $0.05085
- 24-hour trading volume: FAIR3 $15,931.62 vs GRT $487,201.38
- Market Sentiment Index (Fear & Greed Index): 14 (Extreme Fear)
Click to view real-time prices:
- View FAIR3 current price Market Price
- View GRT current price Market Price

II. Core Factors Affecting FAIR3 vs GRT Investment Value
Supply Mechanism Comparison (Tokenomics)
-
FAIR3: Fixed supply cap with deflationary mechanism; total supply limited to 4 billion tokens
-
GRT: Inflationary model with approximately 10 billion tokens; includes indexing and delegation rewards
-
📌 Historical Pattern: Deflationary or fixed supply tokens like FAIR3 tend to perform better during bull markets due to supply constraints, while GRT's inflation can create selling pressure without sufficient adoption.
Institutional Adoption and Market Applications
- Institutional Holdings: GRT has more established institutional backing, including Coinbase Ventures and Digital Currency Group
- Enterprise Adoption: GRT has broader integration with projects like Uniswap, Synthetix, and Aave for indexing their data, while FAIR3 is focusing on newer AI datasets
- Regulatory Stance: Both operate in regulatory gray areas, but GRT's longer market presence provides more regulatory clarity for institutional investors
Technical Development and Ecosystem Building
- FAIR3 Technical Upgrades: Recently upgraded to support AI data indexing and neural networks through Fair Protocol and Natural Intelligence protocols
- GRT Technical Development: Established infrastructure for Web3 data indexing with proven query mechanisms and subgraph deployment
- Ecosystem Comparison: GRT has deeper integration within the DeFi ecosystem and established dApps, while FAIR3 is building a newer ecosystem focused on AI data economy
Macroeconomic and Market Cycles
- Inflation Environment Performance: GRT has more historical data through various market conditions, while FAIR3's deflationary model theoretically offers better protection against inflation
- Macroeconomic Monetary Policy: Both tokens face pressure during high interest rate environments, but GRT has demonstrated more correlation with broader tech markets
- Geopolitical Factors: GRT's established global network of indexers provides more geographic distribution, potentially reducing regional regulatory risks
III. 2025-2030 Price Prediction: FAIR3 vs GRT
Short-term Prediction (2025)
- FAIR3: Conservative $0.0046964 - $0.00796 | Optimistic $0.00796 - $0.0084376
- GRT: Conservative $0.03039 - $0.05065 | Optimistic $0.05065 - $0.067871
Mid-term Prediction (2027)
- FAIR3 may enter a growth phase, expected price range $0.0078954444 - $0.01210634808
- GRT may enter a bullish market, expected price range $0.05786787825 - $0.09387455805
- Key drivers: Institutional capital inflow, ETF, ecosystem development
Long-term Prediction (2030)
- FAIR3: Base scenario $0.013626721171812 - $0.019486211275691 | Optimistic scenario $0.019486211275691+
- GRT: Base scenario $0.112887499532535 - $0.141109374415668 | Optimistic scenario $0.141109374415668+
Disclaimer: These predictions are based on historical data and market analysis. Cryptocurrency markets are highly volatile and subject to change. This information should not be considered as financial advice. Always conduct your own research before making investment decisions.
FAIR3:
| 年份 | 预测最高价 | 预测平均价格 | 预测最低价 | 涨跌幅 |
|---|---|---|---|---|
| 2025 | 0.0084376 | 0.00796 | 0.0046964 | -1 |
| 2026 | 0.009346632 | 0.0081988 | 0.007050968 | 1 |
| 2027 | 0.01210634808 | 0.008772716 | 0.0078954444 | 8 |
| 2028 | 0.0134669963316 | 0.01043953204 | 0.0084560209524 | 29 |
| 2029 | 0.015300178157824 | 0.0119532641858 | 0.011475133618368 | 48 |
| 2030 | 0.019486211275691 | 0.013626721171812 | 0.011718980207758 | 69 |
GRT:
| 年份 | 预测最高价 | 预测平均价格 | 预测最低价 | 涨跌幅 |
|---|---|---|---|---|
| 2025 | 0.067871 | 0.05065 | 0.03039 | 0 |
| 2026 | 0.069334785 | 0.0592605 | 0.05451966 | 16 |
| 2027 | 0.09387455805 | 0.0642976425 | 0.05786787825 | 26 |
| 2028 | 0.1059753743685 | 0.079086100275 | 0.06405974122275 | 55 |
| 2029 | 0.13324426174332 | 0.09253073732175 | 0.082352356216357 | 81 |
| 2030 | 0.141109374415668 | 0.112887499532535 | 0.086923374640051 | 122 |
IV. Investment Strategy Comparison: FAIR3 vs GRT
Long-term vs Short-term Investment Strategies
- FAIR3: Suitable for investors focused on AI data economy potential and deflationary tokenomics
- GRT: Suitable for investors seeking established ecosystem integration and indexing protocol adoption
Risk Management and Asset Allocation
- Conservative investors: FAIR3: 20% vs GRT: 80%
- Aggressive investors: FAIR3: 40% vs GRT: 60%
- Hedging tools: Stablecoin allocation, options, cross-token portfolio diversification
V. Potential Risk Comparison
Market Risks
- FAIR3: Higher volatility due to lower market cap and trading volume
- GRT: Susceptible to broader crypto market trends and DeFi sector performance
Technical Risks
- FAIR3: Scalability, network stability, and adoption of AI data protocols
- GRT: Indexer concentration, potential security vulnerabilities in subgraph deployments
Regulatory Risks
- Global regulatory policies may impact both tokens differently, with GRT potentially facing more scrutiny due to its wider adoption and longer market presence
VI. Conclusion: Which Is the Better Buy?
📌 Investment Value Summary:
- FAIR3 advantages: Deflationary model, focus on AI data economy, potential for higher growth from a lower market cap
- GRT advantages: Established ecosystem, wider adoption, proven track record in blockchain data indexing
✅ Investment Advice:
- New investors: Consider a higher allocation to GRT for its established position and lower volatility
- Experienced investors: Balanced approach with both tokens, leveraging FAIR3's growth potential and GRT's stability
- Institutional investors: Focus on GRT for its liquidity and established market presence, with a smaller allocation to FAIR3 for diversification
⚠️ Risk Warning: The cryptocurrency market is highly volatile, and this article does not constitute investment advice. None
VII. FAQ
Q1: What are the key differences between FAIR3 and GRT? A: FAIR3 focuses on decentralized technical fairness and AI data economy, with a fixed supply cap of 4 billion tokens. GRT is an established indexing protocol for blockchain data with an inflationary model and approximately 10 billion tokens. GRT has wider adoption and integration within the DeFi ecosystem, while FAIR3 is building a newer ecosystem focused on AI data.
Q2: Which token has performed better historically? A: GRT has a longer market history, reaching an all-time high of $2.84 in February 2021. FAIR3, launched in 2025, reached its all-time high of $0.038 in September 2025. Both have declined from their peaks, with GRT currently at $0.05085 and FAIR3 at $0.00805.
Q3: How do their supply mechanisms differ? A: FAIR3 has a fixed supply cap with a deflationary mechanism, while GRT has an inflationary model that includes indexing and delegation rewards. This difference can impact their performance in different market conditions.
Q4: What are the main risks associated with investing in FAIR3 and GRT? A: FAIR3 risks include higher volatility due to lower market cap, and technical challenges related to AI data protocols. GRT faces risks such as broader crypto market trends, potential indexer concentration, and regulatory scrutiny due to its wider adoption.
Q5: Which token is better for long-term investment? A: The choice depends on individual risk tolerance and investment goals. GRT may be more suitable for conservative investors due to its established ecosystem and wider adoption. FAIR3 might appeal to those interested in the AI data economy and potential for higher growth from a lower market cap.
Q6: How do institutional adoptions compare between FAIR3 and GRT? A: GRT has more established institutional backing, including investments from Coinbase Ventures and Digital Currency Group. It also has broader integration with major DeFi projects. FAIR3, being newer, is still building its institutional presence and ecosystem.
Q7: What are the price predictions for FAIR3 and GRT by 2030? A: By 2030, FAIR3 is predicted to reach a base scenario of $0.013626721171812 - $0.019486211275691, with an optimistic scenario above $0.019486211275691. GRT is predicted to reach a base scenario of $0.112887499532535 - $0.141109374415668, with an optimistic scenario above $0.141109374415668. However, these predictions are subject to market volatility and should not be considered financial advice.
Share
Content
Introduction: FAIR3 vs GRT Investment Comparison
I. Price History Comparison and Current Market Status
II. Core Factors Affecting FAIR3 vs GRT Investment Value
III. 2025-2030 Price Prediction: FAIR3 vs GRT
IV. Investment Strategy Comparison: FAIR3 vs GRT
V. Potential Risk Comparison
VI. Conclusion: Which Is the Better Buy?
VII. FAQ

