IDEX vs DOT: Comparing Two Innovative Blockchain Platforms for Decentralized Finance
Introduction: Investment Comparison between IDEX and DOT
In the cryptocurrency market, the comparison between IDEX vs DOT has always been an unavoidable topic for investors. The two not only have significant differences in market cap ranking, application scenarios, and price performance, but also represent different cryptocurrency asset positioning.
IDEX (IDEX): Since its launch in 2017, it has gained market recognition as a decentralized smart contract exchange based on Ethereum.
Polkadot (DOT): Since its inception in 2020, it has been hailed as an interoperability protocol that connects multiple specialized blockchains into a unified network.
This article will comprehensively analyze the investment value comparison between IDEX vs DOT, focusing on historical price trends, supply mechanisms, institutional adoption, technological ecosystems, and future predictions, and attempt to answer the question that investors are most concerned about:
"Which is the better buy right now?"
I. Price History Comparison and Current Market Status
IDEX (Coin A) and DOT (Coin B) Historical Price Trends
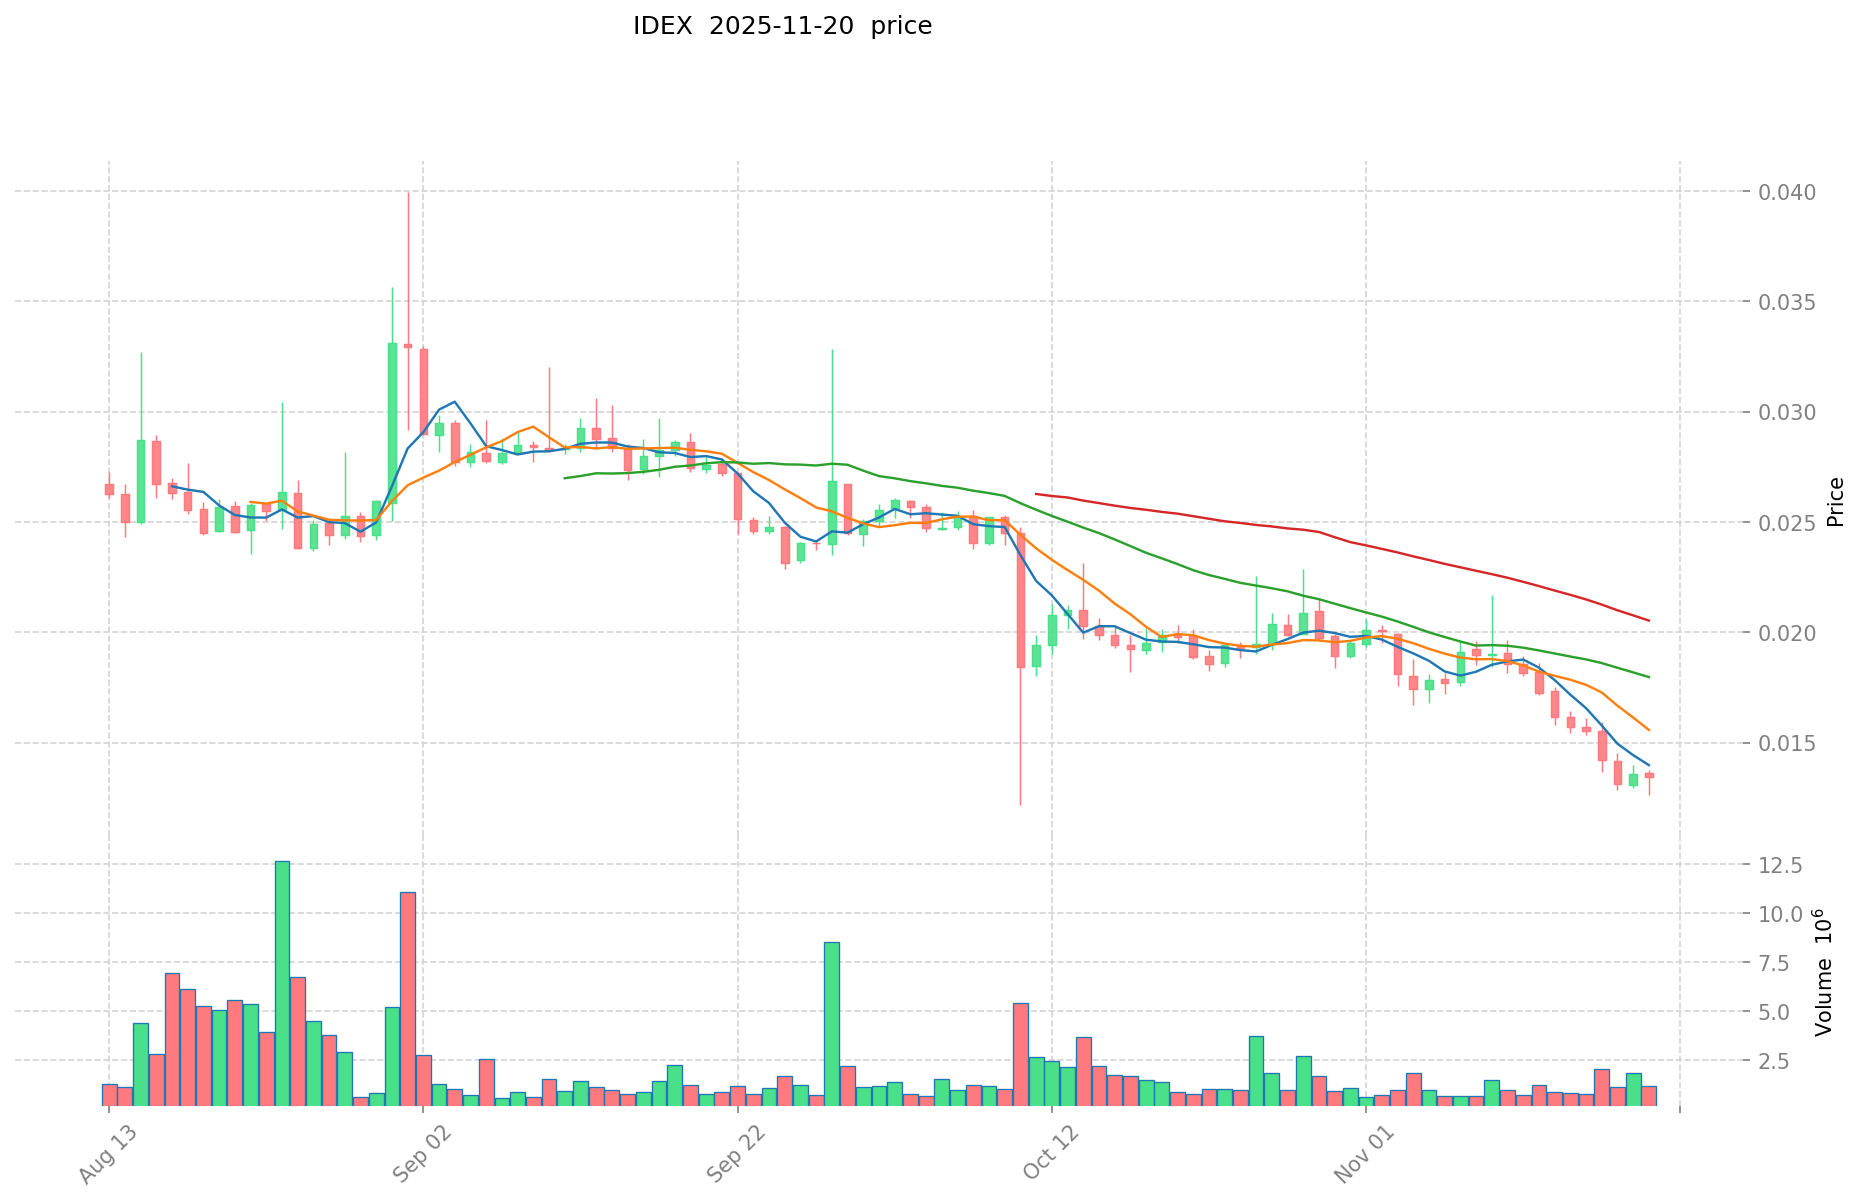
- 2021: IDEX reached its all-time high of $0.937763 on September 8, 2021, likely due to increased interest in decentralized exchanges.
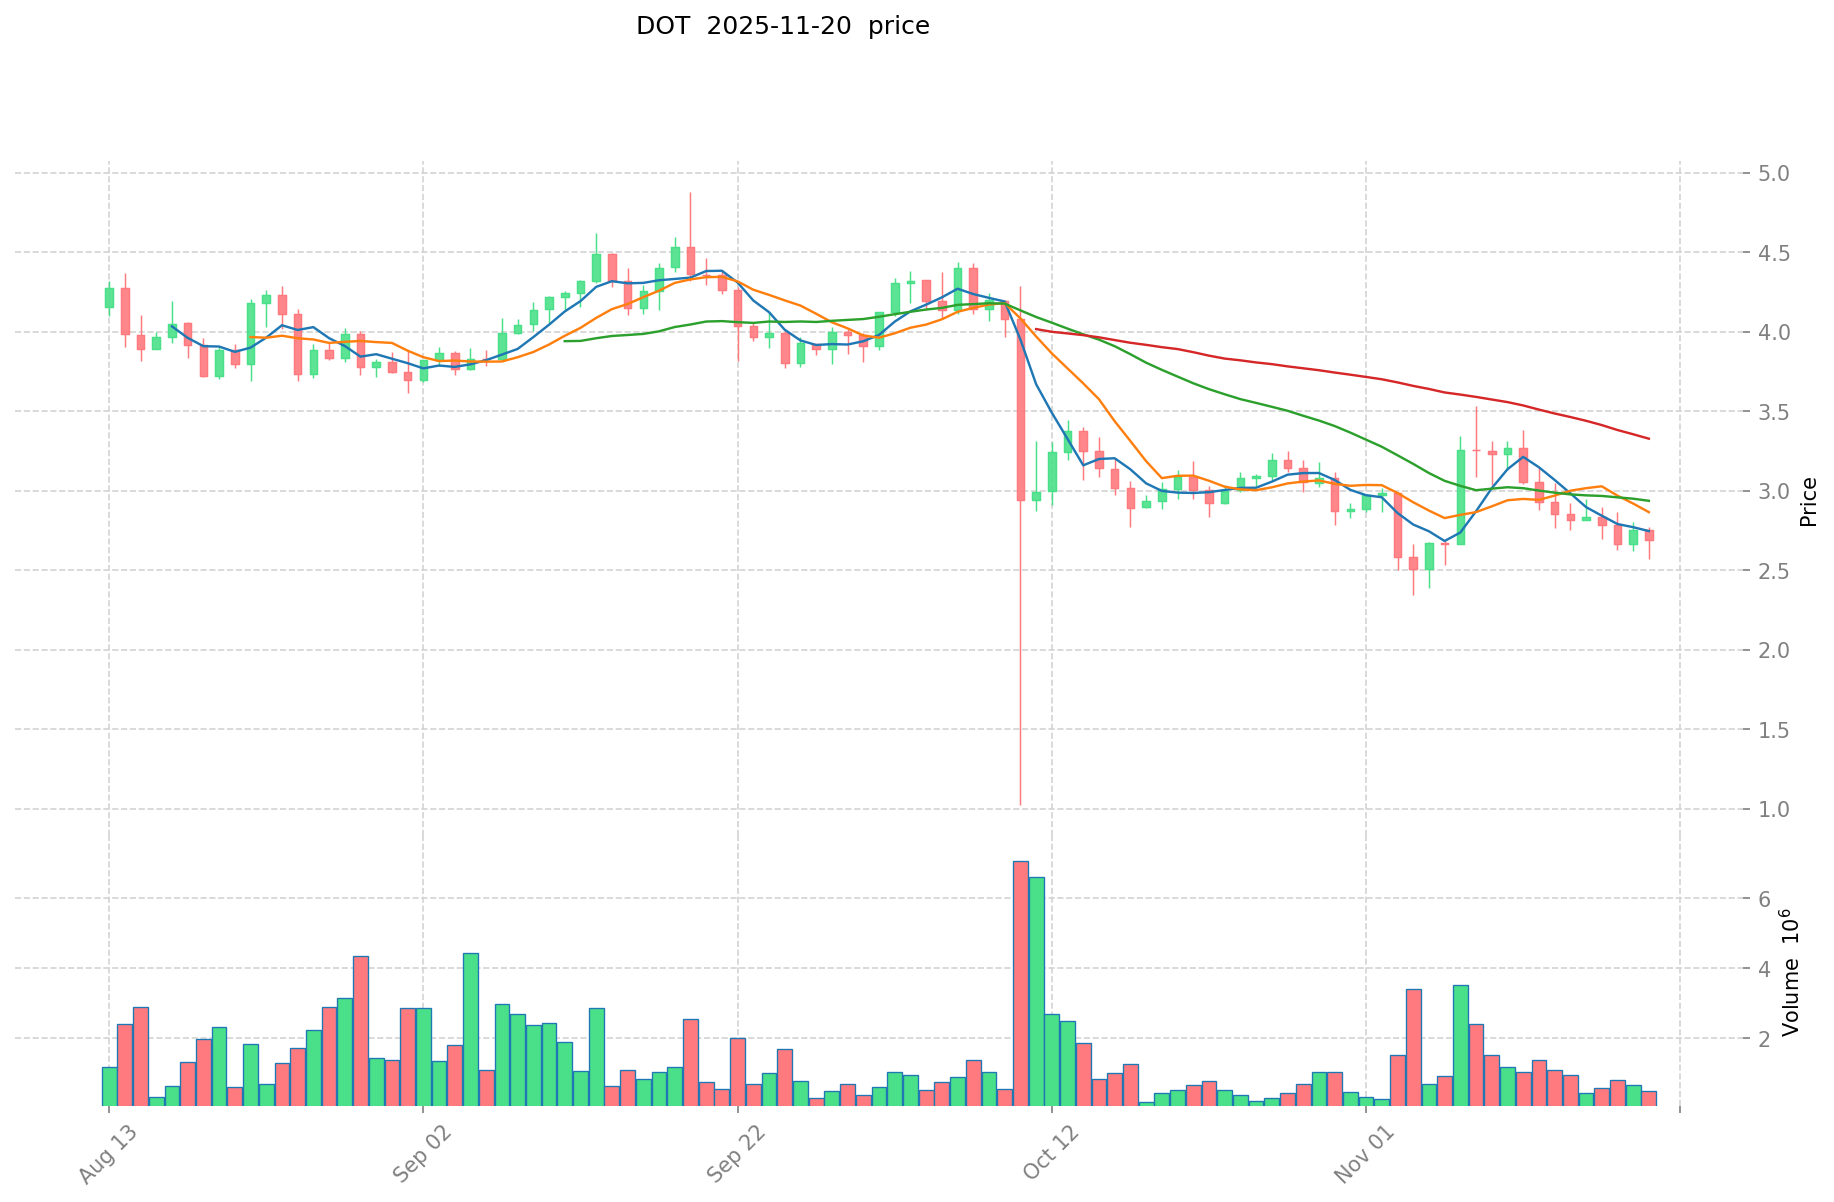
- 2021: DOT hit its all-time high of $54.98 on November 4, 2021, possibly influenced by the growth of the Polkadot ecosystem.
- Comparative analysis: In the current market cycle, IDEX has dropped from its all-time high of $0.937763 to a current price of $0.014291, while DOT has fallen from its peak of $54.98 to $2.758.
Current Market Situation (2025-11-20)
- IDEX current price: $0.014291
- DOT current price: $2.758
- 24-hour trading volume: IDEX $46,071.23 vs DOT $1,344,847.54
- Market Sentiment Index (Fear & Greed Index): 11 (Extreme Fear)
Click to view real-time prices:
- Check IDEX current price Market Price
- Check DOT current price Market Price
II. Core Factors Affecting the Investment Value of IDEX vs DOT
Supply Mechanism Comparison (Tokenomics)
- IDEX: Ethereum-based token with a finite supply mechanism, enabling trading, staking, and governance activities on the IDEX platform.
- DOT: Inflationary model with no maximum supply cap. Annual inflation targets around 10%, adjusting based on staking participation rates.
- 📌 Historical Pattern: DOT's inflationary model supports network security but may create selling pressure, while IDEX's more limited supply structure potentially offers better scarcity value.
Institutional Adoption and Market Applications
- Institutional Holdings: DOT has attracted more institutional interest, with significant backing from venture capital firms and inclusion in various crypto funds.
- Enterprise Adoption: DOT's parachain ecosystem has secured partnerships with major enterprises for cross-chain solutions, while IDEX remains focused primarily on exchange functionality.
- Regulatory Attitudes: Both face similar regulatory scrutiny as utility tokens, though DOT's broader ecosystem approach potentially exposes it to more regulatory touchpoints.
Technical Development and Ecosystem Building
- DOT Technical Development: Continuous improvement of parachain technology, cross-chain interoperability, and governance mechanisms through regular runtime upgrades.
- IDEX Technical Upgrades: Focus on trading experience, liquidity improvements, and gas optimization as an Ethereum-based DEX platform.
- Ecosystem Comparison: DOT offers a more comprehensive ecosystem supporting various applications across DeFi, NFTs, and smart contracts through its parachain architecture, while IDEX remains concentrated in the DEX vertical.
Macroeconomic Factors and Market Cycles
- Inflation Performance: DOT's network utility and staking rewards potentially offset its inflationary tokenomics, while IDEX's more limited use case makes it more susceptible to broader market sentiment.
- Monetary Policy Impact: Both are affected by risk-on/risk-off sentiment shifts, with DOT potentially showing more resilience during downturns due to its larger ecosystem and institutional backing.
- Geopolitical Factors: DOT's cross-chain interoperability positions it better for adoption in regions seeking blockchain sovereignty, while IDEX remains more exposed to Ethereum ecosystem dynamics.
III. 2025-2030 Price Prediction: IDEX vs DOT
Short-term Prediction (2025)
- IDEX: Conservative $0.0115 - $0.0141 | Optimistic $0.0141 - $0.0210
- DOT: Conservative $1.88 - $2.76 | Optimistic $2.76 - $3.79
Mid-term Prediction (2027)
- IDEX may enter a growth phase, with expected price range of $0.0158 - $0.0255
- DOT may enter a consolidation phase, with expected price range of $2.32 - $4.20
- Key drivers: Institutional inflows, ETFs, ecosystem development
Long-term Prediction (2030)
- IDEX: Base scenario $0.0190 - $0.0317 | Optimistic scenario $0.0317 - $0.0425
- DOT: Base scenario $4.15 - $4.37 | Optimistic scenario $4.37 - $4.50
Disclaimer: The above predictions are based on historical data and market analysis. Cryptocurrency markets are highly volatile and unpredictable. These projections should not be considered as financial advice. Always conduct your own research before making investment decisions.
IDEX:
| 年份 | 预测最高价 | 预测平均价格 | 预测最低价 | 涨跌幅 |
|---|---|---|---|---|
| 2025 | 0.02101645 | 0.014105 | 0.0115661 | -1 |
| 2026 | 0.02054604825 | 0.017560725 | 0.011941293 | 22 |
| 2027 | 0.0255315380775 | 0.019053386625 | 0.01581431089875 | 33 |
| 2028 | 0.03120944729175 | 0.02229246235125 | 0.01872566837505 | 55 |
| 2029 | 0.036648808105455 | 0.0267509548215 | 0.0214007638572 | 87 |
| 2030 | 0.042477841161059 | 0.031699881463477 | 0.019019928878086 | 121 |
DOT:
| 年份 | 预测最高价 | 预测平均价格 | 预测最低价 | 涨跌幅 |
|---|---|---|---|---|
| 2025 | 3.78668 | 2.764 | 1.87952 | 0 |
| 2026 | 4.094175 | 3.27534 | 2.5875186 | 18 |
| 2027 | 4.20062355 | 3.6847575 | 2.321397225 | 33 |
| 2028 | 4.45524029325 | 3.942690525 | 3.19357932525 | 42 |
| 2029 | 4.534882641855 | 4.198965409125 | 2.47738959138375 | 52 |
| 2030 | 4.4979317462547 | 4.36692402549 | 4.1485778242155 | 58 |
IV. Investment Strategy Comparison: IDEX vs DOT
Long-term vs Short-term Investment Strategies
- IDEX: Suitable for investors focused on decentralized exchange platforms and Ethereum ecosystem growth
- DOT: Suitable for investors seeking exposure to cross-chain interoperability and broader blockchain ecosystem development
Risk Management and Asset Allocation
- Conservative investors: IDEX: 20% vs DOT: 80%
- Aggressive investors: IDEX: 40% vs DOT: 60%
- Hedging tools: Stablecoin allocation, options, cross-currency portfolio
V. Potential Risk Comparison
Market Risks
- IDEX: Higher volatility due to lower market cap and trading volume
- DOT: Susceptible to broader cryptocurrency market trends and sentiment shifts
Technical Risks
- IDEX: Scalability issues, network congestion on Ethereum
- DOT: Parachain auction dynamics, potential security vulnerabilities in cross-chain operations
Regulatory Risks
- Global regulatory policies may have differing impacts on DEX platforms (IDEX) versus interoperability protocols (DOT)
VI. Conclusion: Which Is the Better Buy?
📌 Investment Value Summary:
- IDEX advantages: Niche focus on decentralized exchange, potential for rapid growth in DEX sector
- DOT advantages: Broader ecosystem appeal, institutional backing, cross-chain interoperability potential
✅ Investment Advice:
- Novice investors: Consider a larger allocation to DOT due to its more established ecosystem and institutional support
- Experienced investors: Balanced approach with both IDEX and DOT, leveraging IDEX for DEX exposure and DOT for ecosystem diversification
- Institutional investors: Focus on DOT for its scalability and cross-chain potential, with a smaller allocation to IDEX for DEX market exposure
⚠️ Risk Warning: The cryptocurrency market is highly volatile. This article does not constitute investment advice. None
VII. FAQ
Q1: What are the main differences between IDEX and DOT? A: IDEX is a decentralized smart contract exchange based on Ethereum, while DOT is an interoperability protocol connecting multiple specialized blockchains. IDEX focuses on DEX functionality, while DOT offers a broader ecosystem for various blockchain applications.
Q2: Which cryptocurrency has performed better historically? A: DOT has shown stronger historical performance, reaching an all-time high of $54.98 in November 2021, compared to IDEX's all-time high of $0.937763 in September 2021. However, both have experienced significant price declines since their peaks.
Q3: How do the supply mechanisms of IDEX and DOT differ? A: IDEX has a finite supply mechanism as an Ethereum-based token, while DOT has an inflationary model with no maximum supply cap and an annual inflation target of around 10%.
Q4: Which cryptocurrency has attracted more institutional interest? A: DOT has attracted more institutional interest, with significant backing from venture capital firms and inclusion in various crypto funds. It also has more enterprise partnerships for its parachain ecosystem.
Q5: What are the key technical developments for each project? A: DOT focuses on improving parachain technology, cross-chain interoperability, and governance mechanisms. IDEX concentrates on enhancing trading experience, liquidity improvements, and gas optimization for its DEX platform.
Q6: How do the long-term price predictions compare for IDEX and DOT? A: By 2030, IDEX is predicted to reach $0.0190 - $0.0425, while DOT is expected to reach $4.15 - $4.50 in the base and optimistic scenarios, respectively.
Q7: Which cryptocurrency might be better suited for different types of investors? A: Novice investors might consider a larger allocation to DOT due to its more established ecosystem and institutional support. Experienced investors could take a balanced approach with both IDEX and DOT. Institutional investors might focus more on DOT for its scalability and cross-chain potential.
Share
Content
Introduction: Investment Comparison between IDEX and DOT
I. Price History Comparison and Current Market Status
II. Core Factors Affecting the Investment Value of IDEX vs DOT
III. 2025-2030 Price Prediction: IDEX vs DOT
IV. Investment Strategy Comparison: IDEX vs DOT
V. Potential Risk Comparison
VI. Conclusion: Which Is the Better Buy?
VII. FAQ

