LCAT vs SNX: Comparing Two Emerging Cryptocurrency Tokens in the DeFi Space
Introduction: Investment Comparison of LCAT vs SNX
In the cryptocurrency market, the comparison between LCAT vs SNX has been an unavoidable topic for investors. The two not only show significant differences in market cap ranking, application scenarios, and price performance, but also represent different positions in crypto assets.
LCAT (Lion Cat): Since its launch, it has gained market recognition for its innovative meme token concept combined with AI-powered tools on the Binance Smart Chain.
SNX (Synthetix): Introduced in 2018, it has been recognized for its role in creating synthetic assets and decentralized finance (DeFi) applications.
This article will comprehensively analyze the investment value comparison between LCAT vs SNX, focusing on historical price trends, supply mechanisms, institutional adoption, technological ecosystems, and future predictions, attempting to answer the question investors care about most:
"Which is the better buy right now?"
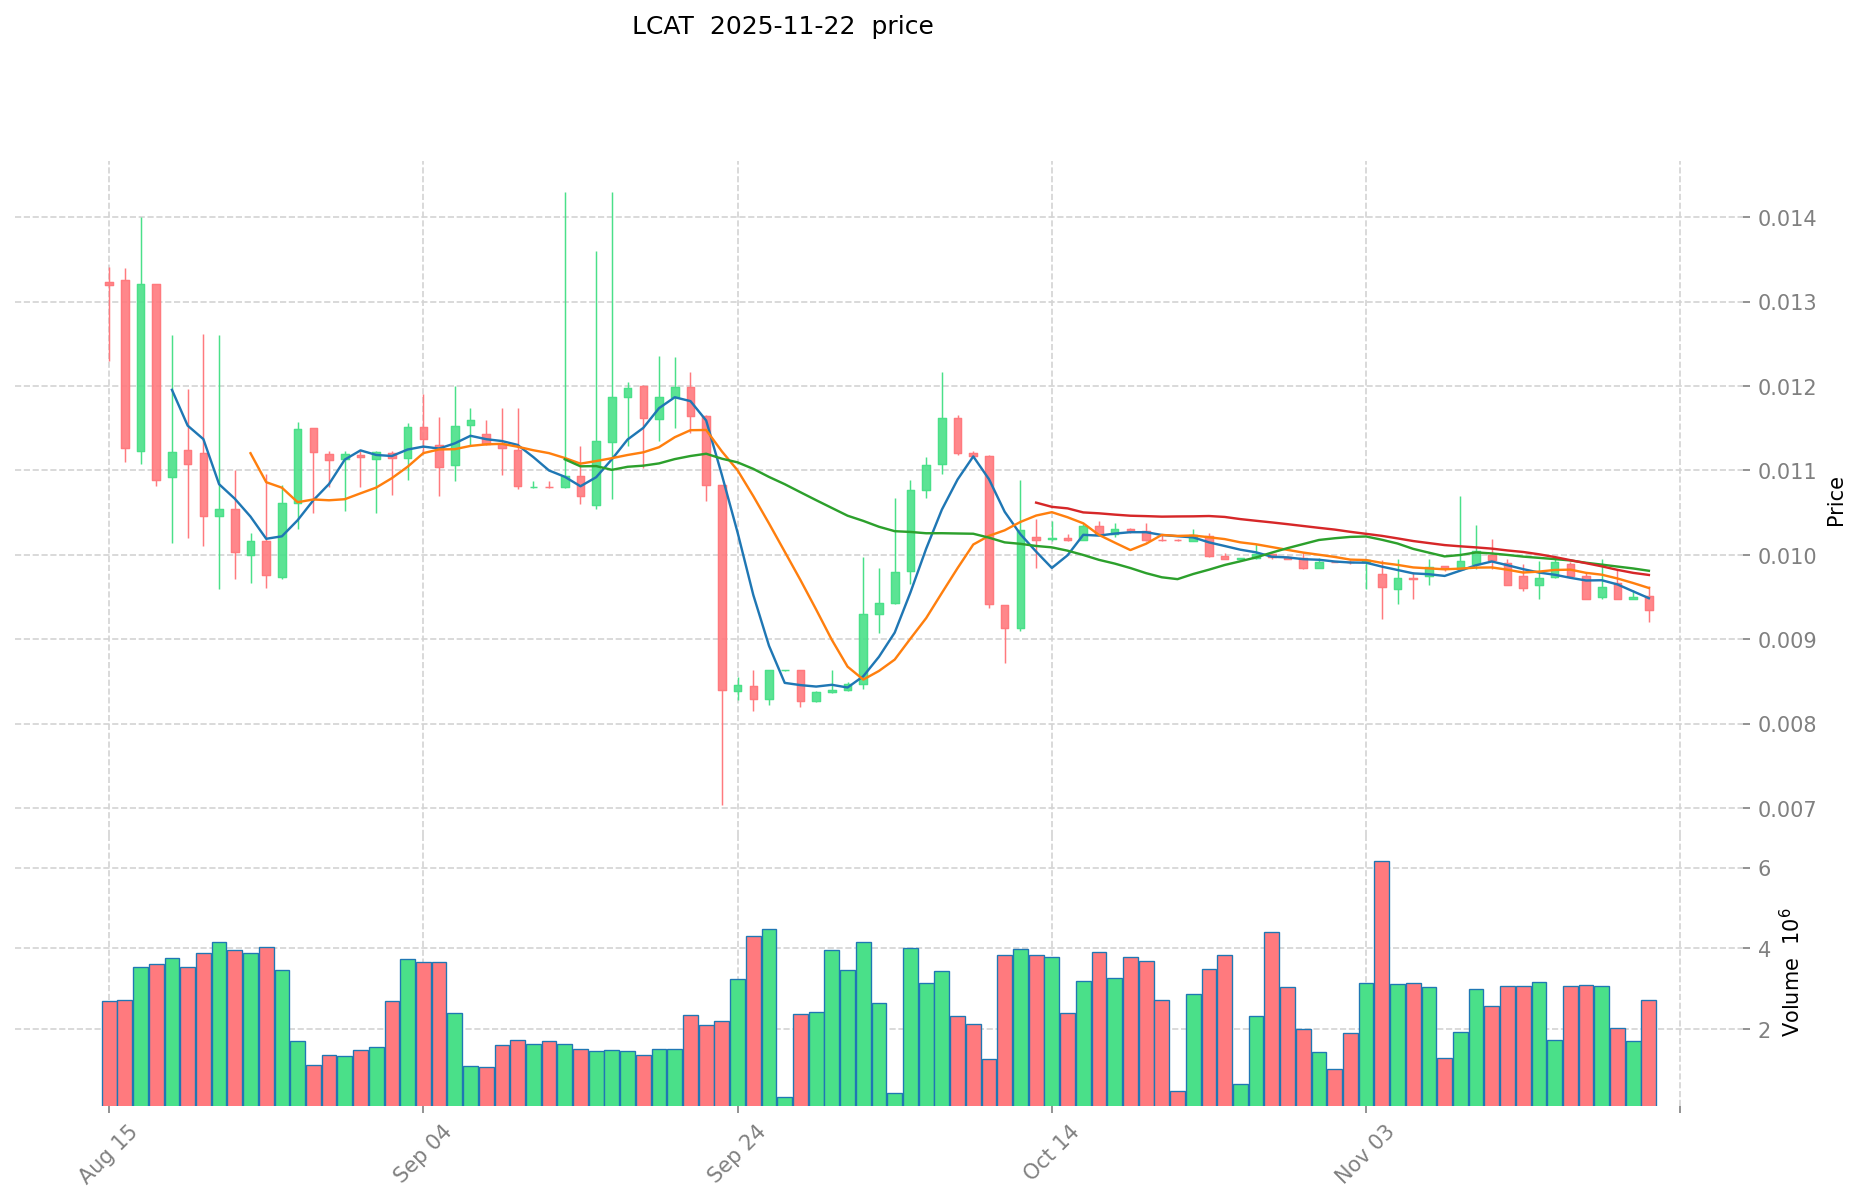
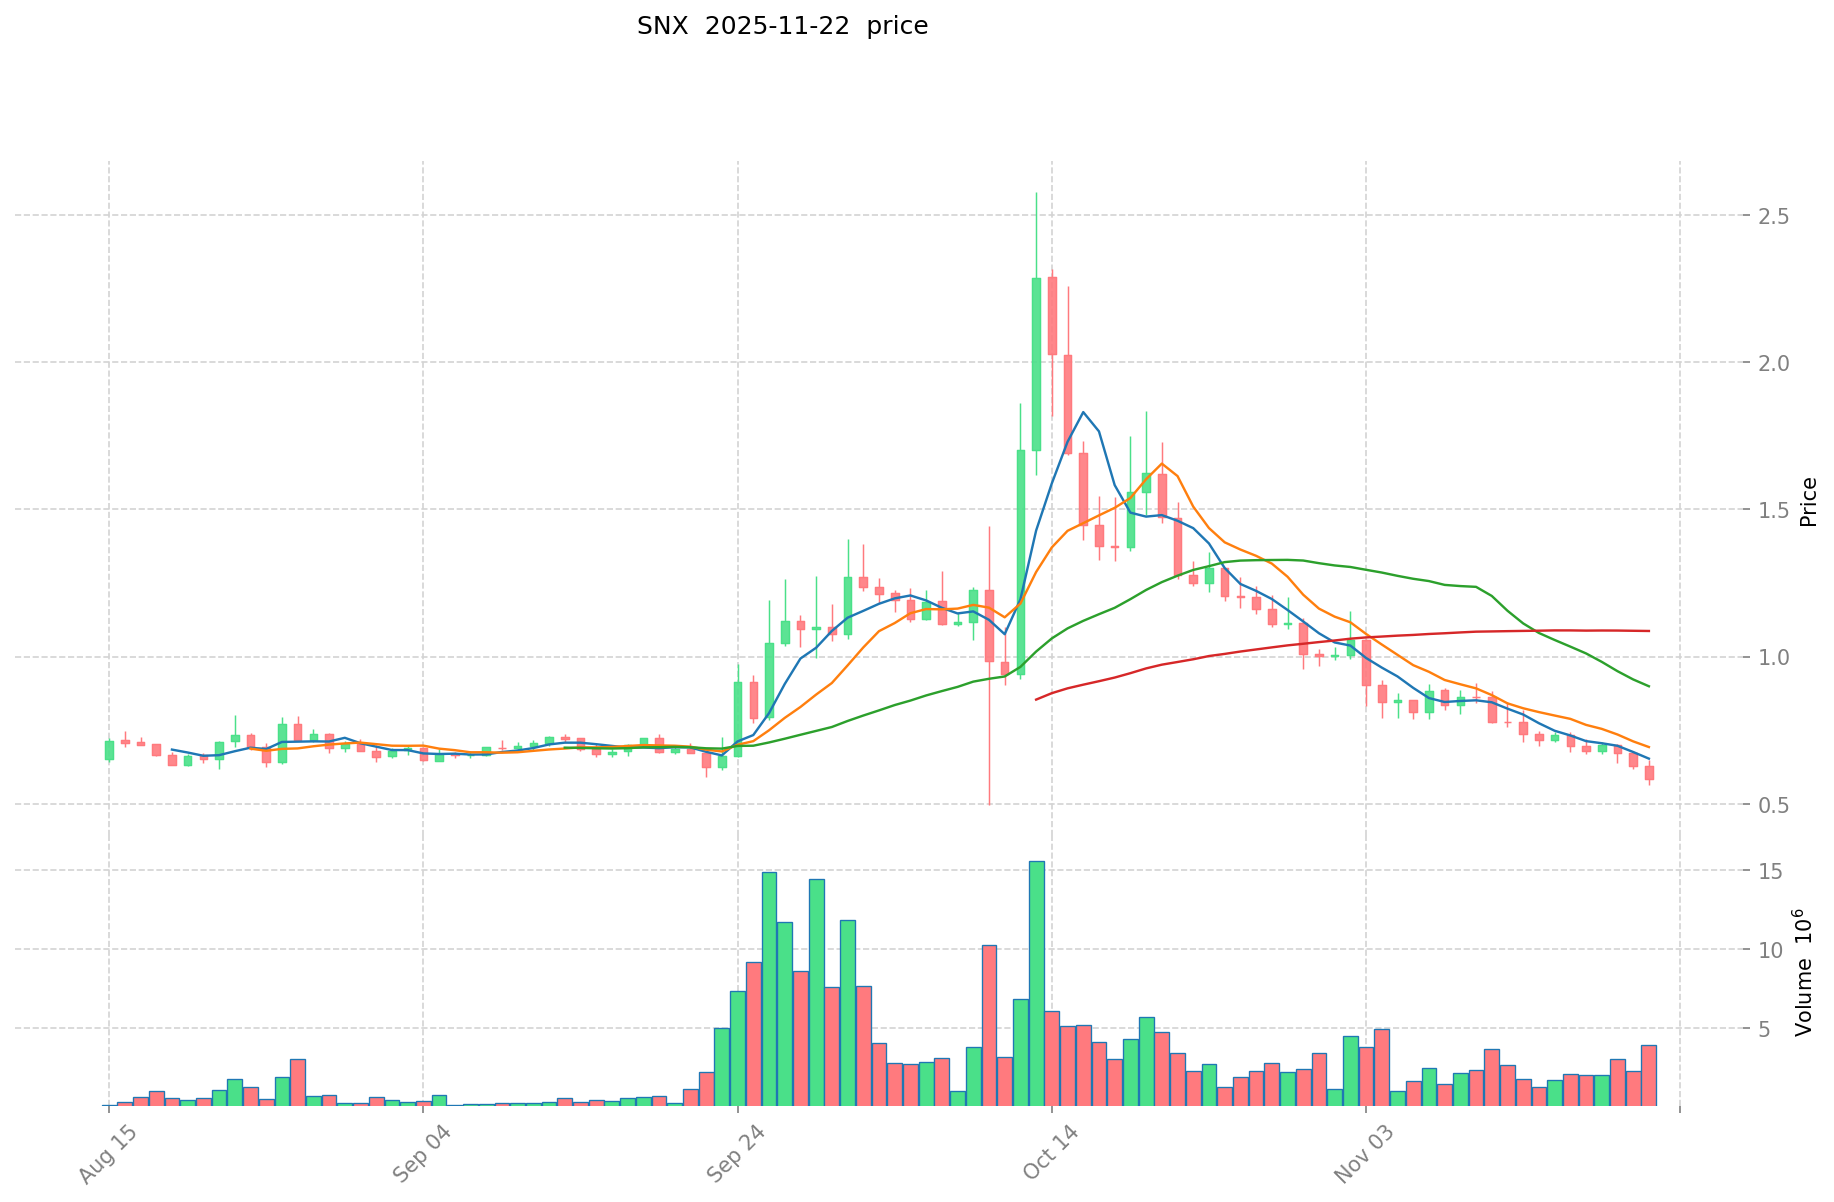
I. Price History Comparison and Current Market Status
LCAT (Coin A) and SNX (Coin B) Historical Price Trends
- 2025: LCAT reached its all-time high of $0.12806 on February 21, 2025, and its all-time low of $0.00703 on September 23, 2025, showing significant volatility within the year.
- 2021: SNX hit its all-time high of $28.53 on February 14, 2021, during the broader crypto market bull run.
- Comparative Analysis: In the recent market cycle, LCAT has experienced a 92.65% decline from its all-time high to its current price, while SNX has seen a 97.99% drop from its peak to the present value.
Current Market Situation (2025-11-22)
- LCAT current price: $0.009407
- SNX current price: $0.5723
- 24-hour trading volume: LCAT $29,519.73 vs SNX $2,555,918.35
- Market Sentiment Index (Fear & Greed Index): 11 (Extreme Fear)
Click to view real-time prices:
- View LCAT current price Market Price
- View SNX current price Market Price
II. Core Factors Affecting Investment Value of LCAT vs SNX
Supply Mechanism Comparison (Tokenomics)
- LCAT: Inflationary model with 240 million token max supply, with emission rate of 2 LCAT per block (approximately 10,512,000 LCAT annually)
- SNX: Inflationary model with declining emission rate, decreasing by 1.25% per week; current annualized inflation around 14%
- 📌 Historical pattern: Both tokens have inflationary models, but SNX's decreasing inflation rate provides better long-term supply dynamics than LCAT's fixed emission schedule.
Institutional Adoption and Market Applications
- Institutional holdings: SNX has more established institutional presence with support from Framework Ventures and Paradigm
- Enterprise adoption: SNX powers Synthetix protocol which processes billions in trading volume, while LCAT's Layer Bank has lower TVL and usage metrics
- Regulatory stance: Both operate in regulatory gray areas as DeFi protocols, though SNX's longer operational history gives it more regulatory visibility
Technical Development and Ecosystem Building
- LCAT technical upgrades: Layer Bank V2 implementation introduced cross-chain bridging, lending protocol improvements and Layer2 support
- SNX technical development: V3 migration with enhanced architecture, perps V2, and integration with Optimism for L2 scaling
- Ecosystem comparison: SNX has a more mature ecosystem with derivatives trading, staking infrastructure and cross-protocol integrations; LCAT's ecosystem remains more limited with primary focus on lending markets
Macroeconomic and Market Cycles
- Performance during inflation: SNX has historically shown better correlation with DeFi sector growth during inflationary environments
- Macroeconomic monetary policy: Both tokens face headwinds during tightening cycles, but SNX's larger market cap typically provides more stability
- Geopolitical factors: Both benefit from increased demand for decentralized financial services during periods of economic uncertainty
III. 2025-2030 Price Prediction: LCAT vs SNX
Short-term Prediction (2025)
- LCAT: Conservative $0.00886796 - $0.009434 | Optimistic $0.009434 - $0.0113208
- SNX: Conservative $0.324957 - $0.5701 | Optimistic $0.5701 - $0.752532
Mid-term Prediction (2027)
- LCAT may enter a growth phase, with estimated prices $0.0090906024 - $0.0151925136
- SNX may enter a bullish market, with estimated prices $0.6293083056 - $1.0730513416
- Key drivers: Institutional capital inflow, ETF, ecosystem development
Long-term Prediction (2030)
- LCAT: Base scenario $0.01536807430224 - $0.017826966190598 | Optimistic scenario $0.017826966190598+
- SNX: Base scenario $0.733857581702977 - $1.35899552167218 | Optimistic scenario $1.35899552167218 - $1.88900377512433
Disclaimer: This analysis is based on historical data and projections. Cryptocurrency markets are highly volatile and unpredictable. Always conduct your own research before making investment decisions.
LCAT:
| 年份 | 预测最高价 | 预测平均价格 | 预测最低价 | 涨跌幅 |
|---|---|---|---|---|
| 2025 | 0.0113208 | 0.009434 | 0.00886796 | 0 |
| 2026 | 0.01452836 | 0.0103774 | 0.009547208 | 10 |
| 2027 | 0.0151925136 | 0.01245288 | 0.0090906024 | 32 |
| 2028 | 0.016310782224 | 0.0138226968 | 0.007740710208 | 46 |
| 2029 | 0.01566940909248 | 0.015066739512 | 0.00994404807792 | 60 |
| 2030 | 0.017826966190598 | 0.01536807430224 | 0.0102966097825 | 63 |
SNX:
| 年份 | 预测最高价 | 预测平均价格 | 预测最低价 | 涨跌幅 |
|---|---|---|---|---|
| 2025 | 0.752532 | 0.5701 | 0.324957 | 0 |
| 2026 | 0.95229504 | 0.661316 | 0.39017644 | 15 |
| 2027 | 1.0730513416 | 0.80680552 | 0.6293083056 | 40 |
| 2028 | 1.344097656044 | 0.9399284308 | 0.789539881872 | 64 |
| 2029 | 1.57597799992236 | 1.142013043422 | 0.58242665214522 | 99 |
| 2030 | 1.88900377512433 | 1.35899552167218 | 0.733857581702977 | 137 |
IV. Investment Strategy Comparison: LCAT vs SNX
Long-term vs Short-term Investment Strategies
- LCAT: Suitable for investors focusing on meme tokens with AI integration potential
- SNX: Suitable for investors seeking exposure to DeFi and synthetic assets
Risk Management and Asset Allocation
- Conservative investors: LCAT: 10% vs SNX: 90%
- Aggressive investors: LCAT: 30% vs SNX: 70%
- Hedging tools: Stablecoin allocation, options, cross-token portfolio
V. Potential Risk Comparison
Market Risk
- LCAT: High volatility due to meme token nature and smaller market cap
- SNX: Exposure to broader DeFi market fluctuations
Technical Risk
- LCAT: Scalability, network stability of Binance Smart Chain
- SNX: Smart contract vulnerabilities, scalability challenges on Ethereum
Regulatory Risk
- Global regulatory policies may impact both tokens, with SNX potentially facing more scrutiny due to its role in synthetic assets
VI. Conclusion: Which Is the Better Buy?
📌 Investment Value Summary:
- LCAT advantages: Innovative meme token concept, AI integration potential
- SNX advantages: Established DeFi protocol, larger ecosystem, institutional backing
✅ Investment Advice:
- New investors: Consider a small allocation to SNX for DeFi exposure
- Experienced investors: Balanced portfolio with both LCAT and SNX, weighted towards SNX
- Institutional investors: Focus on SNX for its more established presence in the DeFi sector
⚠️ Risk Warning: Cryptocurrency markets are highly volatile. This article does not constitute investment advice. None
VII. FAQ
Q1: What are the main differences between LCAT and SNX? A: LCAT is a meme token with AI integration on Binance Smart Chain, while SNX is an established DeFi protocol for synthetic assets on Ethereum. SNX has a larger market cap, more institutional backing, and a more developed ecosystem.
Q2: Which token has performed better historically? A: SNX has historically shown better performance, reaching an all-time high of $28.53 in February 2021. However, both tokens have experienced significant declines from their peak prices, with LCAT down 92.65% and SNX down 97.99% from their respective all-time highs.
Q3: How do the supply mechanisms of LCAT and SNX compare? A: Both tokens have inflationary models, but SNX's emission rate decreases by 1.25% per week, while LCAT has a fixed emission rate of 2 LCAT per block. SNX's decreasing inflation rate may provide better long-term supply dynamics.
Q4: What are the key factors affecting the investment value of these tokens? A: Key factors include supply mechanisms, institutional adoption, technical development, ecosystem building, and macroeconomic conditions. SNX generally has advantages in these areas due to its more established presence in the DeFi sector.
Q5: What are the price predictions for LCAT and SNX by 2030? A: For LCAT, the base scenario predicts a range of $0.01536807430224 to $0.017826966190598. For SNX, the base scenario predicts a range of $0.733857581702977 to $1.35899552167218. However, these predictions are subject to market volatility and should be viewed cautiously.
Q6: How should investors allocate their portfolio between LCAT and SNX? A: Conservative investors might consider allocating 10% to LCAT and 90% to SNX, while more aggressive investors might opt for 30% LCAT and 70% SNX. However, individual allocations should be based on personal risk tolerance and investment goals.
Q7: What are the main risks associated with investing in LCAT and SNX? A: Both tokens face market risks due to cryptocurrency volatility. LCAT has higher volatility due to its meme token nature. Technical risks include scalability issues and potential smart contract vulnerabilities. Regulatory risks are present for both, with SNX potentially facing more scrutiny due to its role in synthetic assets.
Share
Content
Introduction: Investment Comparison of LCAT vs SNX
I. Price History Comparison and Current Market Status
II. Core Factors Affecting Investment Value of LCAT vs SNX
III. 2025-2030 Price Prediction: LCAT vs SNX
IV. Investment Strategy Comparison: LCAT vs SNX
V. Potential Risk Comparison
VI. Conclusion: Which Is the Better Buy?
VII. FAQ

