MITO vs ENJ: The Battle for Blockchain Gaming Supremacy
Introduction: MITO vs ENJ Investment Comparison
In the cryptocurrency market, the comparison between Mitosis (MITO) and Enjin Coin (ENJ) has been an unavoidable topic for investors. The two not only show significant differences in market cap ranking, application scenarios, and price performance but also represent different positioning in the crypto asset space.
Mitosis (MITO): Launched as a liquidity protocol for the modular era, it aims to redefine cross-chain liquidity and make cross-chain LPing more attractive.
Enjin Coin (ENJ): Introduced in 2009, it has been recognized as a platform for online game community creation, focusing on virtual goods in gaming ecosystems.
This article will comprehensively analyze the investment value comparison between MITO and ENJ, focusing on historical price trends, supply mechanisms, institutional adoption, technological ecosystems, and future predictions, attempting to answer the question investors care about most:
"Which is the better buy right now?"
I. Price History Comparison and Current Market Status
MITO and ENJ Historical Price Trends
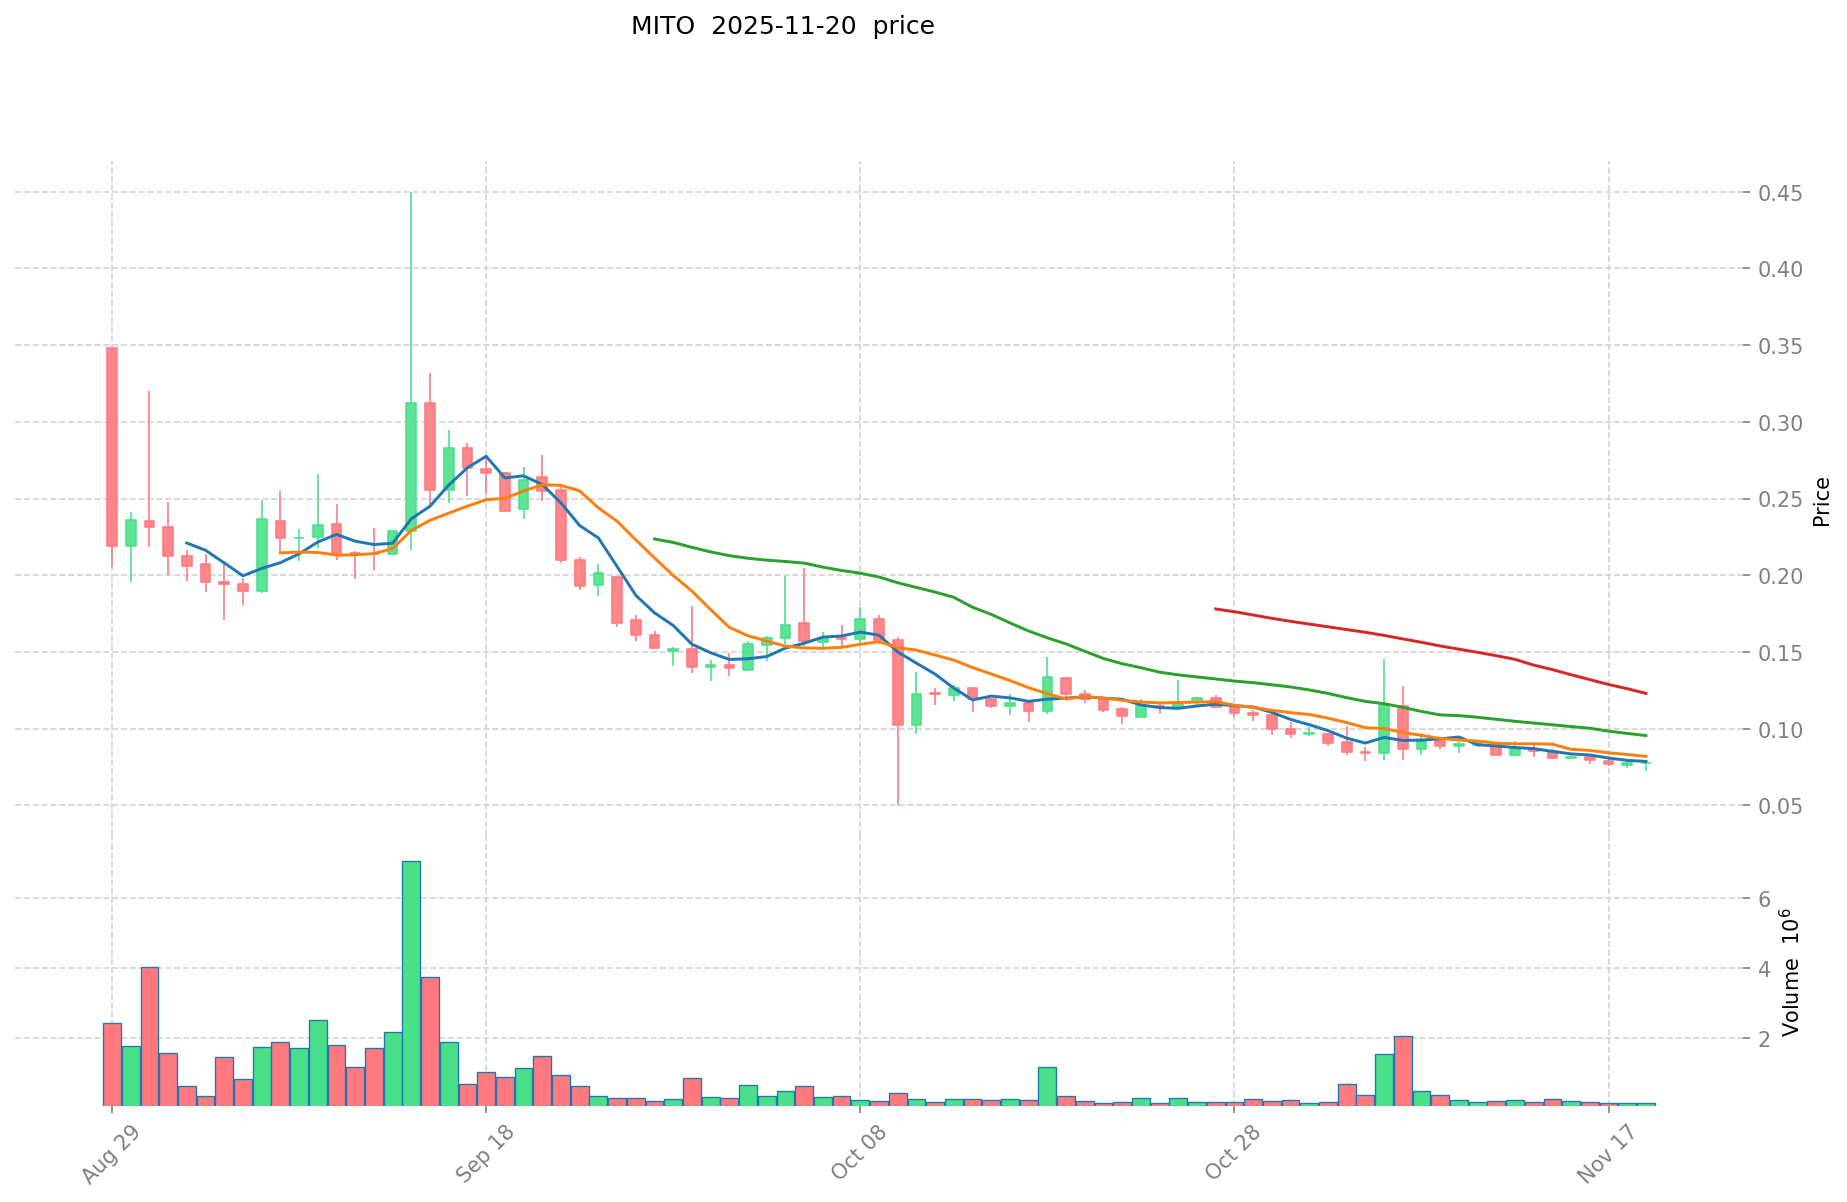
- 2025: MITO reached its all-time high of $0.45 on September 14, but later dropped to its all-time low of $0.05 on October 10.
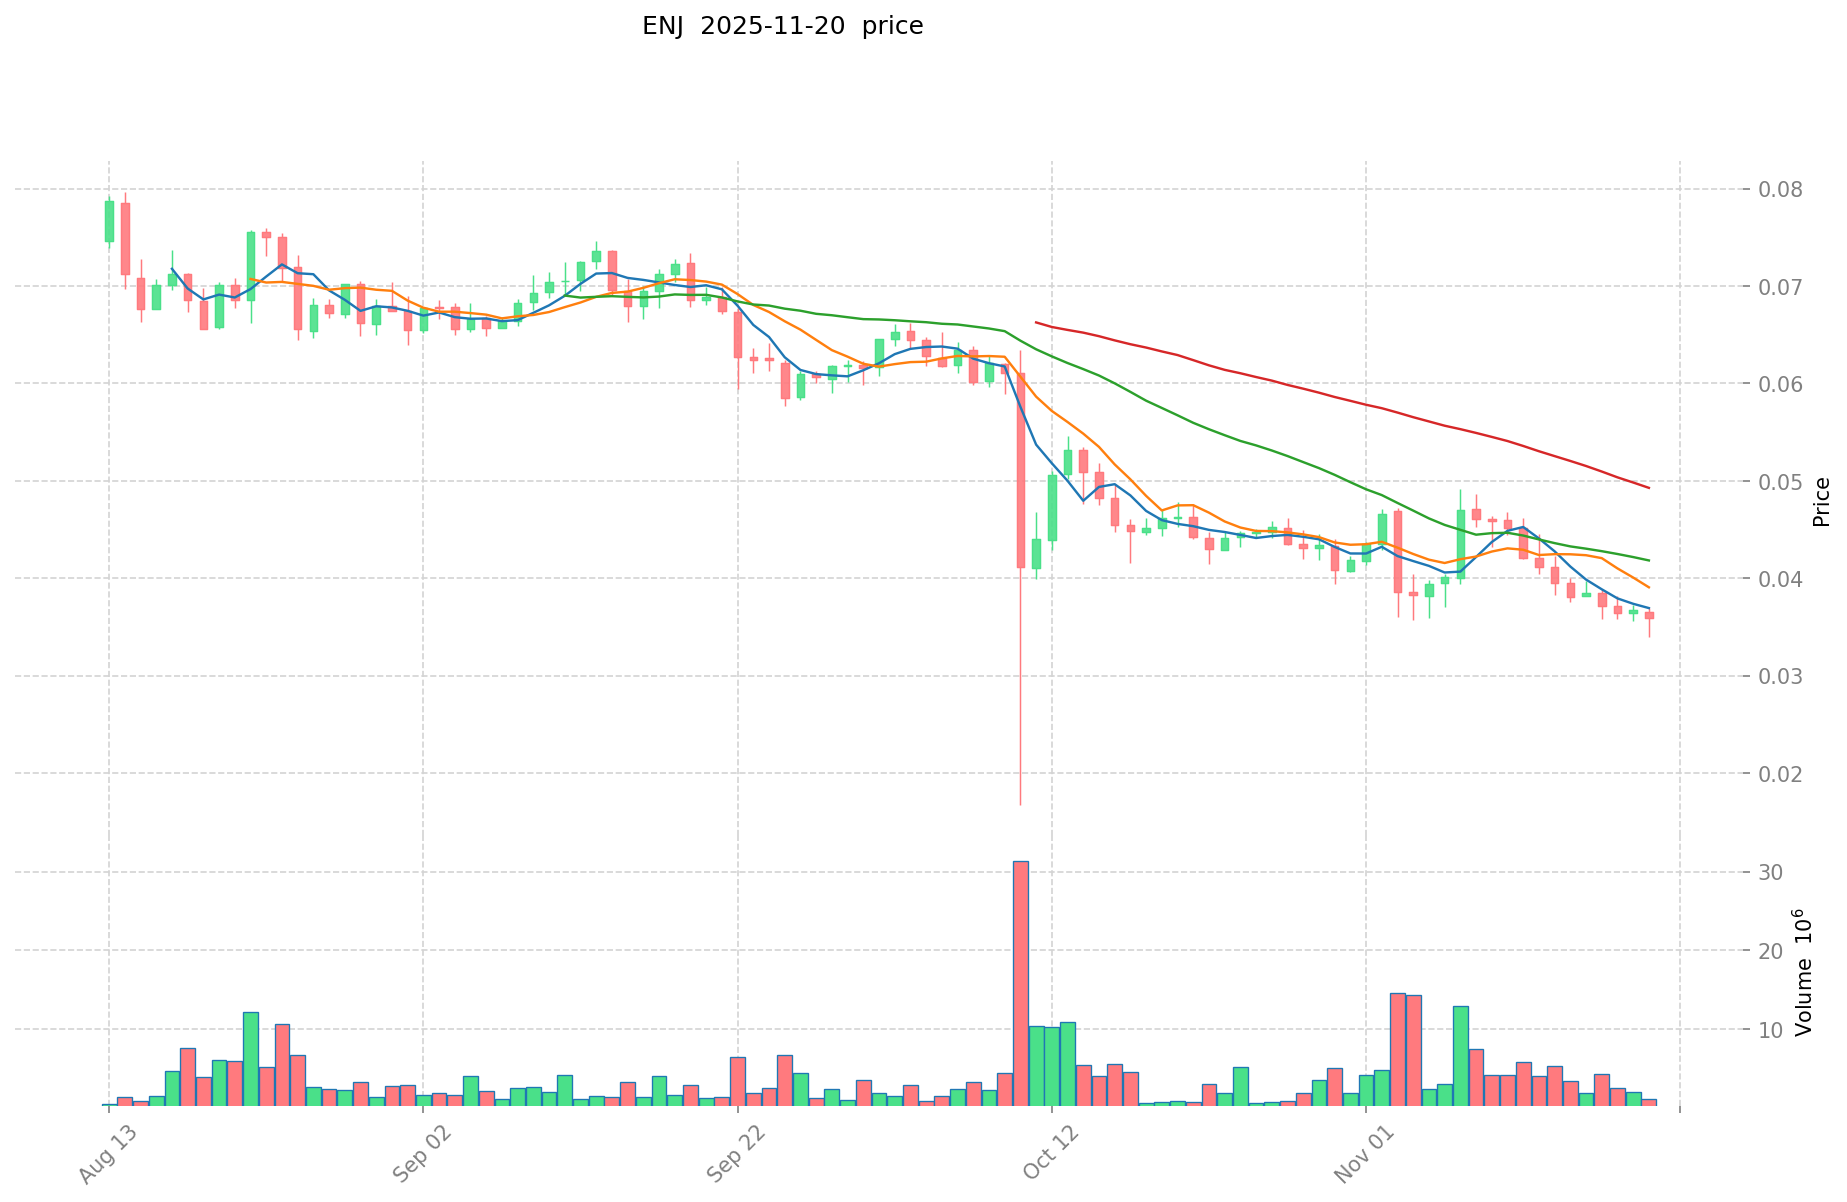
- 2021: ENJ hit its all-time high of $4.82 on November 25, reflecting significant growth in the gaming token sector.
- Comparative analysis: In recent market cycles, MITO has shown high volatility, dropping from $0.45 to $0.05 within a month. ENJ, on the other hand, has experienced a long-term decline from its 2021 peak, currently trading at a fraction of its all-time high.
Current Market Situation (2025-11-20)
- MITO current price: $0.07792
- ENJ current price: $0.03608
- 24-hour trading volume: MITO $10,618.99 vs ENJ $31,878.11
- Market Sentiment Index (Fear & Greed Index): 11 (Extreme Fear)
Click to view real-time prices:
- View MITO current price Market Price
- View ENJ current price Market Price
II. Core Factors Affecting MITO vs ENJ Investment Value
Supply Mechanism Comparison (Tokenomics)
- MITO: Fixed supply of 100 million tokens with 65% currently in circulation
- ENJ: Maximum supply of 1 billion tokens with deflationary mechanism through NFT minting (tokens get locked when used)
- 📌 Historical pattern: ENJ's deflationary model has historically created value through token scarcity during NFT minting cycles, while MITO's fixed supply aims to create long-term value stability.
Institutional Adoption and Market Applications
- Institutional holdings: ENJ has longer history of institutional interest with established partnerships in gaming industry
- Enterprise adoption: ENJ offers more mature infrastructure for gaming assets and metaverse applications, while MITO focuses on DeFi yield optimization
- Regulatory attitudes: Both face similar regulatory challenges in the gaming/NFT space, though ENJ's longer market presence provides more regulatory clarity
Technical Development and Ecosystem Building
- MITO technical upgrades: Focus on yield optimization protocols and multichain expansion
- ENJ technical development: Efinity parachain on Polkadot, NFT infrastructure, and metaverse development toolkit
- Ecosystem comparison: ENJ has stronger presence in gaming NFTs and metaverse applications, while MITO has growing DeFi yield applications across multiple chains
Macroeconomic Environment and Market Cycles
- Performance during inflation: Neither token has demonstrated significant anti-inflation properties compared to larger cryptocurrencies
- Macroeconomic monetary policy: Both tokens show high correlation with broader crypto market reactions to interest rate changes
- Geopolitical factors: ENJ's gaming focus provides potential cross-border utility in digital entertainment economies, while MITO's DeFi applications face varying regulatory treatment across jurisdictions
III. 2025-2030 Price Prediction: MITO vs ENJ
Short-term Prediction (2025)
- MITO: Conservative $0.0598983 - $0.07779 | Optimistic $0.07779 - $0.1104618
- ENJ: Conservative $0.0231168 - $0.03612 | Optimistic $0.03612 - $0.0491232
Mid-term Prediction (2027)
- MITO may enter a growth phase, with estimated prices $0.07895280492 - $0.14913307596
- ENJ may enter a steady growth phase, with estimated prices $0.04285814988 - $0.05463236688
- Key drivers: Institutional capital inflow, ETF, ecosystem development
Long-term Prediction (2030)
- MITO: Base scenario $0.160139096965848 - $0.235404472539796 | Optimistic scenario $0.235404472539796+
- ENJ: Base scenario $0.060906564538092 - $0.087096387289471 | Optimistic scenario $0.087096387289471+
Disclaimer: The above predictions are based on historical data and market analysis. Cryptocurrency markets are highly volatile and subject to change. This information should not be considered as financial advice. Always conduct your own research before making investment decisions.
MITO:
| 年份 | 预测最高价 | 预测平均价格 | 预测最低价 | 涨跌幅 |
|---|---|---|---|---|
| 2025 | 0.1104618 | 0.07779 | 0.0598983 | 0 |
| 2026 | 0.125187447 | 0.0941259 | 0.089419605 | 20 |
| 2027 | 0.14913307596 | 0.1096566735 | 0.07895280492 | 40 |
| 2028 | 0.1785649271274 | 0.12939487473 | 0.1022219510367 | 66 |
| 2029 | 0.166298293002996 | 0.1539799009287 | 0.147820704891552 | 97 |
| 2030 | 0.235404472539796 | 0.160139096965848 | 0.144125187269263 | 105 |
ENJ:
| 年份 | 预测最高价 | 预测平均价格 | 预测最低价 | 涨跌幅 |
|---|---|---|---|---|
| 2025 | 0.0491232 | 0.03612 | 0.0231168 | 0 |
| 2026 | 0.051572136 | 0.0426216 | 0.022589448 | 18 |
| 2027 | 0.05463236688 | 0.047096868 | 0.04285814988 | 30 |
| 2028 | 0.0564597253584 | 0.05086461744 | 0.0284841857664 | 40 |
| 2029 | 0.068150957676984 | 0.0536621713992 | 0.035417033123472 | 48 |
| 2030 | 0.087096387289471 | 0.060906564538092 | 0.044461792112807 | 68 |
IV. Investment Strategy Comparison: MITO vs ENJ
Long-term vs Short-term Investment Strategies
- MITO: Suitable for investors focused on DeFi yield optimization and cross-chain liquidity
- ENJ: Suitable for investors interested in gaming ecosystems and NFT applications
Risk Management and Asset Allocation
- Conservative investors: MITO: 30% vs ENJ: 70%
- Aggressive investors: MITO: 60% vs ENJ: 40%
- Hedging tools: Stablecoin allocation, options, cross-currency portfolio
V. Potential Risk Comparison
Market Risks
- MITO: High volatility, relatively new in the market
- ENJ: Dependency on gaming industry trends, market saturation
Technical Risks
- MITO: Scalability, network stability across multiple chains
- ENJ: Smart contract vulnerabilities, ecosystem adaptability
Regulatory Risks
- Global regulatory policies may impact both differently, with ENJ potentially facing more scrutiny in gaming-related regulations
VI. Conclusion: Which Is the Better Buy?
📌 Investment Value Summary:
- MITO advantages: Focus on cross-chain liquidity, potential for high growth in DeFi sector
- ENJ advantages: Established presence in gaming NFTs, broader ecosystem adoption
✅ Investment Advice:
- Novice investors: Consider a balanced approach, leaning towards ENJ for its more established market presence
- Experienced investors: Explore MITO for potentially higher returns, but with increased risk
- Institutional investors: Consider a diversified portfolio including both, with a slight preference for ENJ due to its longer track record
⚠️ Risk Warning: Cryptocurrency markets are highly volatile. This article does not constitute investment advice. None
VII. FAQ
Q1: What are the main differences between MITO and ENJ in terms of their focus and applications? A: MITO focuses on cross-chain liquidity and DeFi yield optimization, while ENJ specializes in gaming ecosystems and NFT applications.
Q2: How do the supply mechanisms of MITO and ENJ differ? A: MITO has a fixed supply of 100 million tokens, with 65% currently in circulation. ENJ has a maximum supply of 1 billion tokens with a deflationary mechanism through NFT minting.
Q3: Which token has shown more price stability historically? A: ENJ has demonstrated more price stability due to its longer market presence, while MITO has shown high volatility in recent market cycles.
Q4: What are the key factors that could drive the future growth of MITO and ENJ? A: For MITO, key drivers include DeFi yield optimization and cross-chain liquidity developments. For ENJ, growth could be driven by gaming industry trends and metaverse applications.
Q5: How do institutional adoptions compare between MITO and ENJ? A: ENJ has a longer history of institutional interest with established partnerships in the gaming industry, while MITO is still gaining traction in the DeFi space.
Q6: What are the main risks associated with investing in MITO and ENJ? A: MITO faces risks related to high volatility and being relatively new in the market. ENJ's risks include dependency on gaming industry trends and potential market saturation.
Q7: How might regulatory factors affect MITO and ENJ differently? A: ENJ may face more scrutiny in gaming-related regulations due to its focus on gaming NFTs, while MITO's DeFi applications may encounter varying regulatory treatment across jurisdictions.
Share
Content
Introduction: MITO vs ENJ Investment Comparison
I. Price History Comparison and Current Market Status
II. Core Factors Affecting MITO vs ENJ Investment Value
III. 2025-2030 Price Prediction: MITO vs ENJ
IV. Investment Strategy Comparison: MITO vs ENJ
V. Potential Risk Comparison
VI. Conclusion: Which Is the Better Buy?
VII. FAQ

