RDNT vs RUNE: Comparing Two Leading Decentralized Liquidity Protocols in the DeFi Ecosystem
Introduction: Investment Comparison of RDNT vs RUNE
In the cryptocurrency market, the comparison between RDNT vs RUNE has always been a topic that investors can't avoid. The two not only have significant differences in market cap ranking, application scenarios, and price performance, but also represent different positioning in crypto assets.
Radiant (RDNT): Since its launch, it has gained market recognition for establishing the first omnipotent chain currency market based on LayerZero.
RUNE (RUNE): Since its inception, it has been hailed as a highly optimized multi-chain solution, and is one of the cryptocurrencies with the highest global trading volume and market capitalization.
This article will comprehensively analyze the investment value comparison between RDNT vs RUNE, focusing on historical price trends, supply mechanisms, institutional adoption, technological ecosystems, and future predictions, and attempt to answer the question that investors are most concerned about:
"Which is the better buy right now?"
I. Price History Comparison and Current Market Status
RDNT (Coin A) and RUNE (Coin B) Historical Price Trends
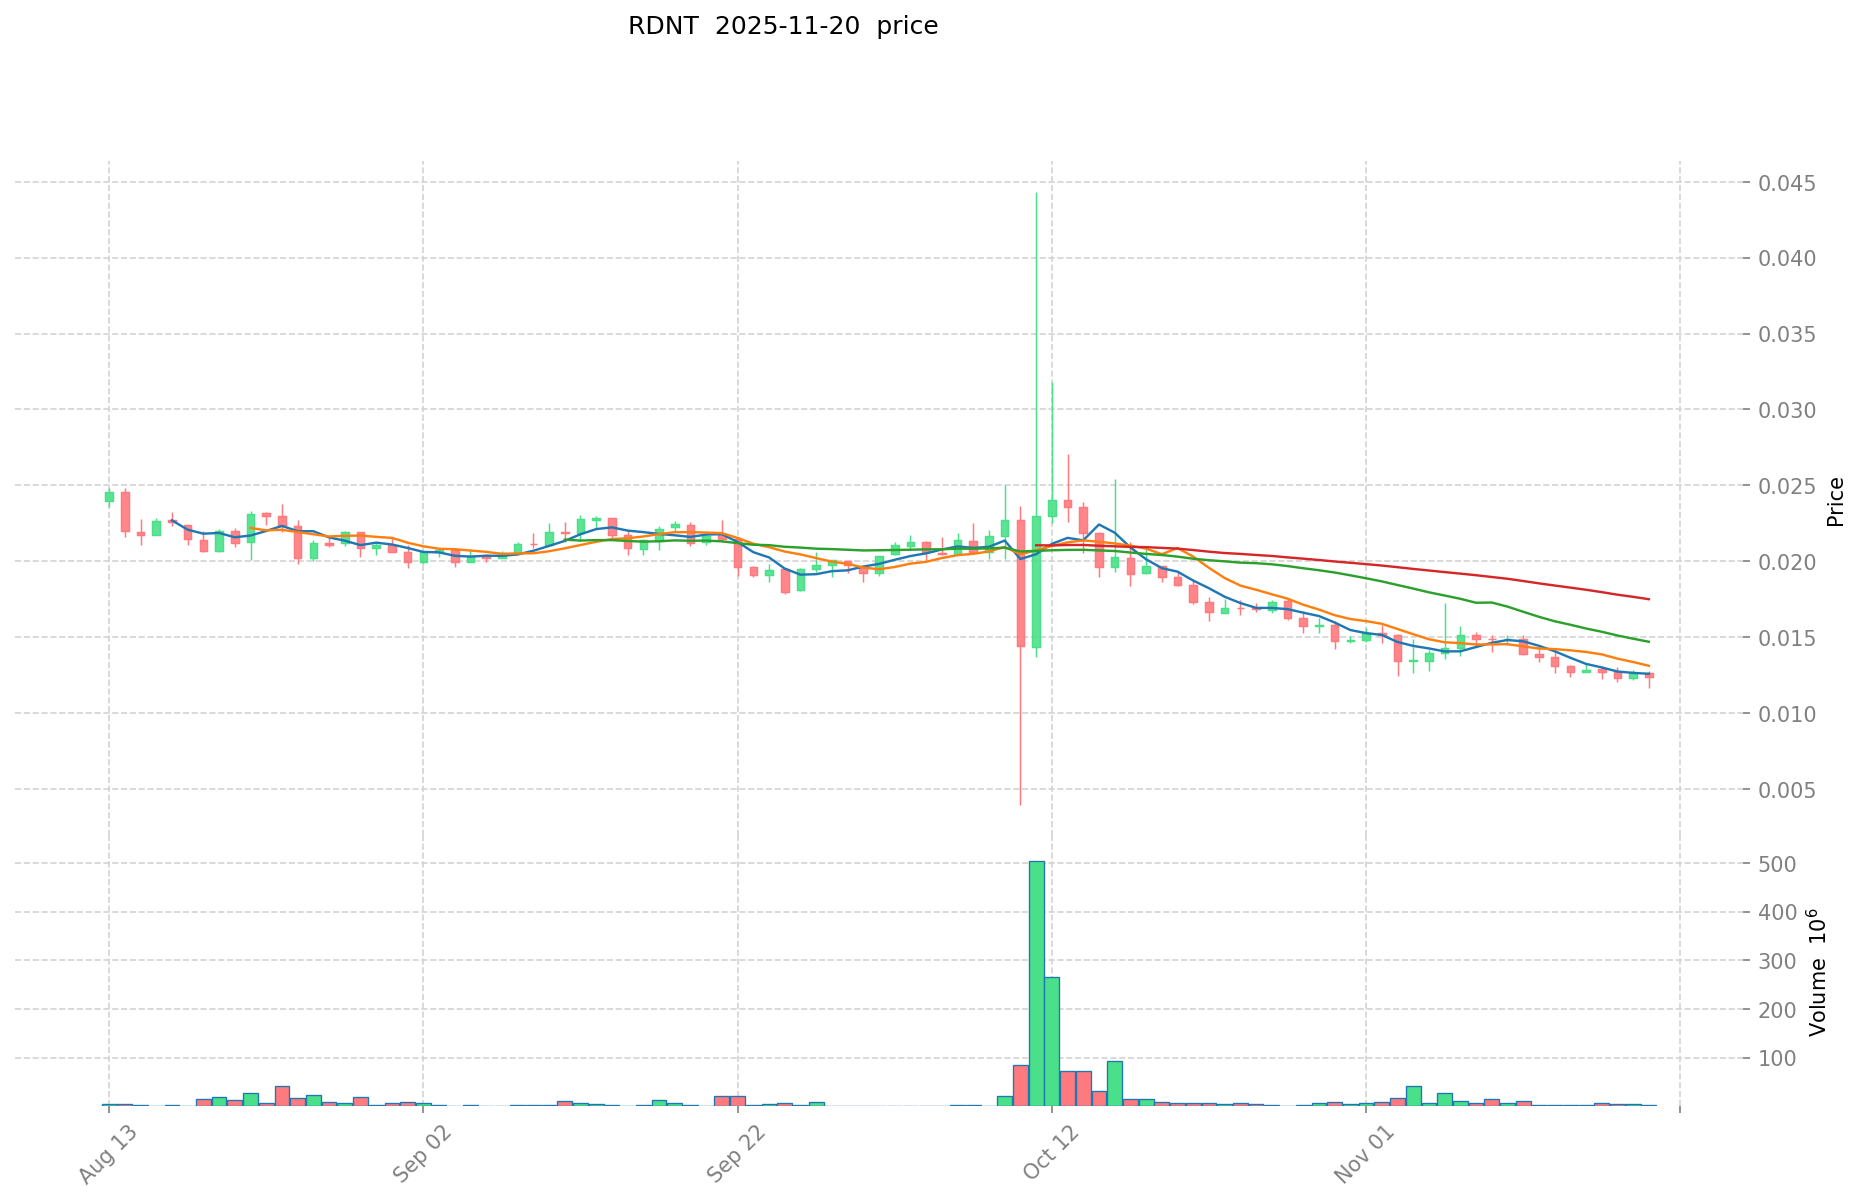
- 2022: RDNT reached its all-time high of $0.585268 on September 16, 2022.
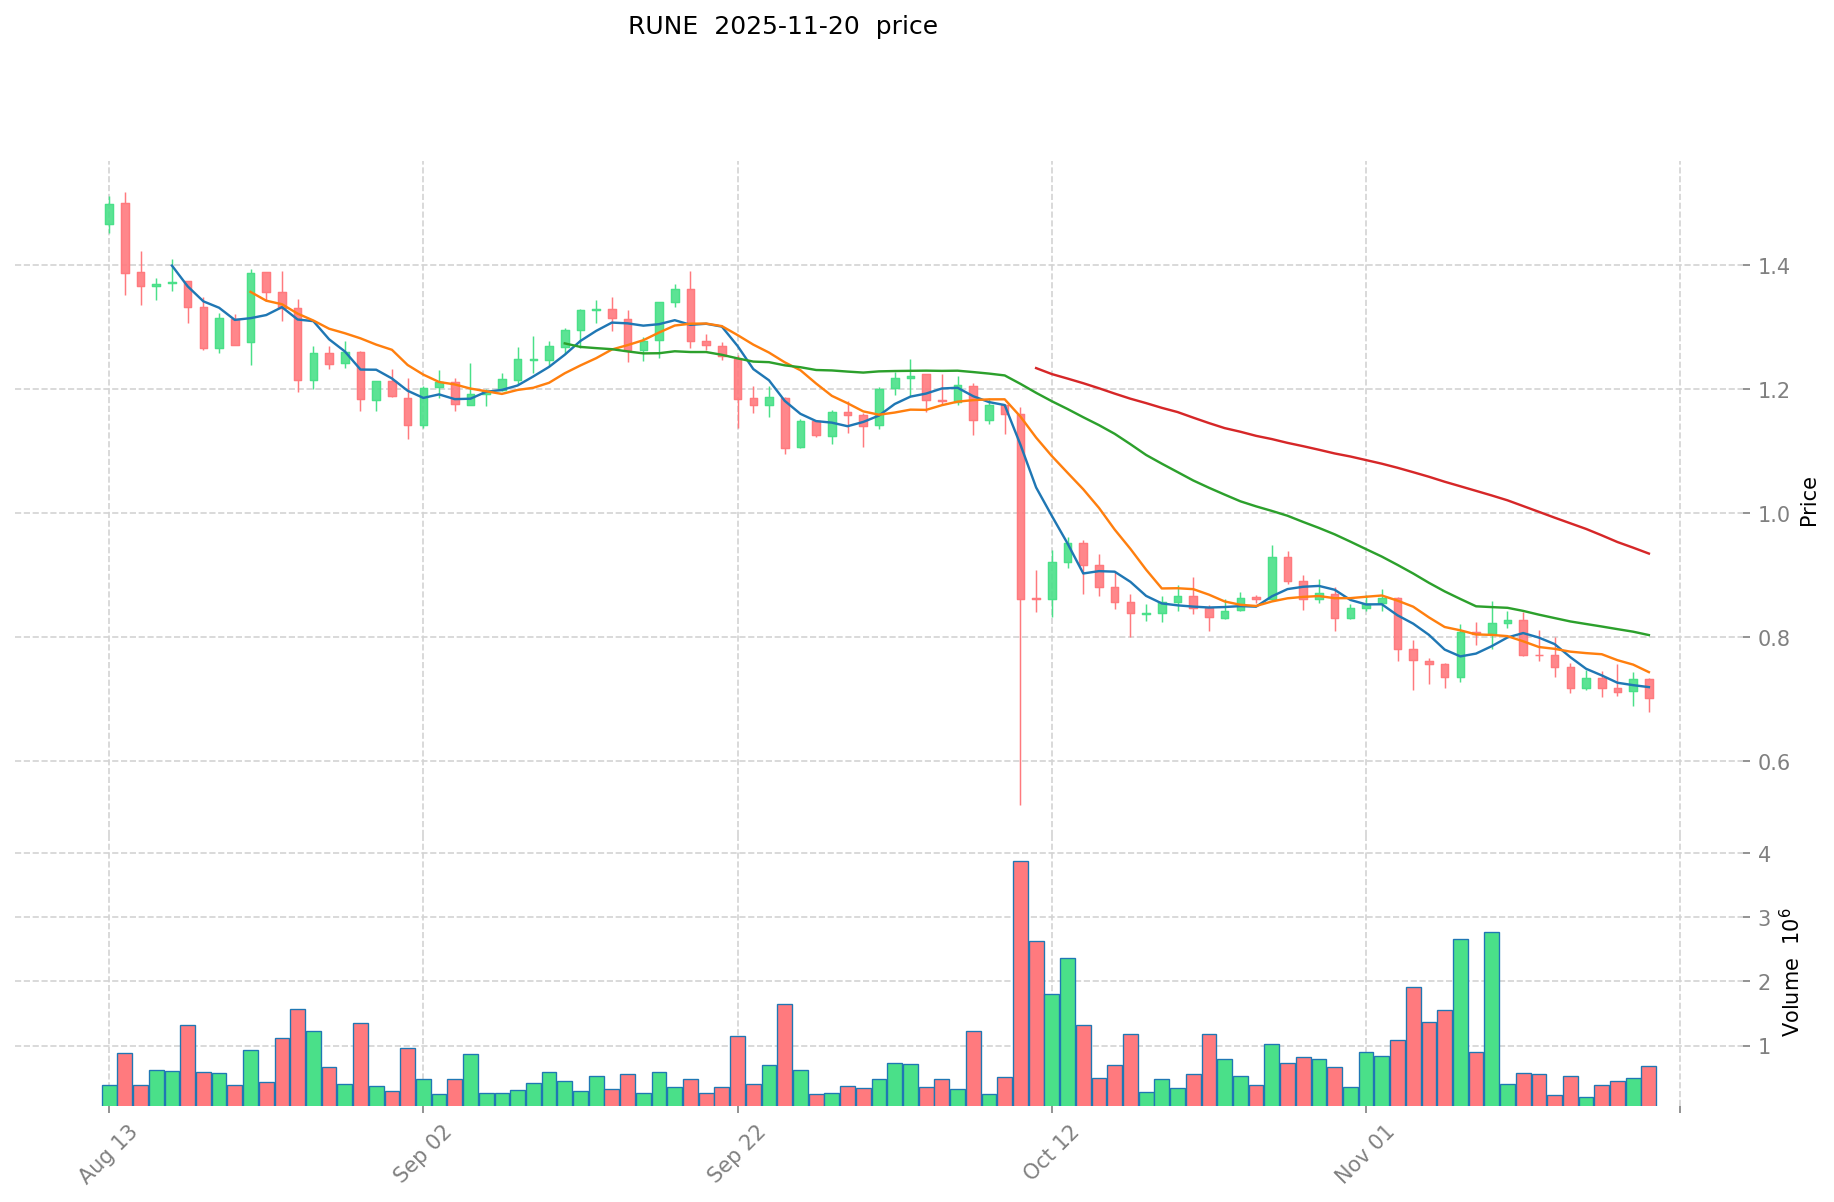
- 2021: RUNE hit its all-time high of $20.87 on May 19, 2021, during the bull market.
- Comparative analysis: During the recent market cycle, RDNT dropped from its high of $0.585268 to a low of $0.0091192, while RUNE declined from $20.87 to its current price level.
Current Market Situation (2025-11-20)
- RDNT current price: $0.01239
- RUNE current price: $0.7119
- 24-hour trading volume: RDNT $21,320 vs RUNE $507,041
- Market Sentiment Index (Fear & Greed Index): 11 (Extreme Fear)
Click to view real-time prices:
- Check RDNT current price Market Price
- Check RUNE current price Market Price
II. Core Factors Affecting RDNT vs RUNE Investment Value
Supply Mechanism Comparison (Tokenomics)
- RDNT: Native utility token of Radiant Capital with distribution allocated to users providing utility to the platform as lenders, borrowers, and RDNT/WETH liquidity providers
- RUNE: Native token of THORChain's decentralized lending network
- 📌 Historical pattern: Both tokens utilize utility-based tokenomics where value is derived from platform usage and adoption
Institutional Adoption and Market Applications
- Market Applications: RDNT powers a cross-chain lending protocol built on Layer0, allowing users to generate lending interest and borrow assets seamlessly across multiple chains
- Enterprise Adoption: RDNT aims to become the first all-chain monetary market platform where users can deposit any major crypto assets and borrow from different chains
- THORChain Applications: RUNE serves as the backbone of THORChain's decentralized network
Technical Development and Ecosystem Building
- RDNT Technical Features: Provides a seamless, user-friendly cross-chain lending platform, overcoming fragmentation issues in the lending market
- RUNE Technical Development: Powers THORChain, which has established itself as one of the most influential token protocols in the Bitcoin ecosystem
- Ecosystem Comparison: RDNT focuses on cross-chain DeFi lending markets, while RUNE supports THORChain's broader decentralized exchange and liquidity provision infrastructure
Macroeconomic and Market Cycles
- Market Valuation: RUNE's total market cap has occasionally exceeded $2 billion following significant political events like Trump's election
- Market Positioning: Both tokens are positioned as DeFi infrastructure plays that could benefit from increased adoption during bull markets
- Investment Horizon: Both tokens require attention to market demand trends and technical development progress to evaluate long-term value
III. 2025-2030 Price Prediction: RDNT vs RUNE
Short-term Prediction (2025)
- RDNT: Conservative $0.0117 - $0.0124 | Optimistic $0.0124 - $0.0182
- RUNE: Conservative $0.6029 - $0.7178 | Optimistic $0.7178 - $0.9690
Mid-term Prediction (2027)
- RDNT may enter a growth phase, with prices estimated between $0.0151 - $0.0244
- RUNE may enter a bullish market, with prices estimated between $0.7378 - $1.3321
- Key drivers: Institutional capital inflow, ETF developments, ecosystem growth
Long-term Prediction (2030)
- RDNT: Base scenario $0.0197 - $0.0266 | Optimistic scenario $0.0266 - $0.0293
- RUNE: Base scenario $1.2635 - $1.3162 | Optimistic scenario $1.3162 - $1.5663
Disclaimer: The above predictions are based on historical data and market analysis. Cryptocurrency markets are highly volatile and subject to rapid changes. These forecasts should not be considered as financial advice. Always conduct your own research before making investment decisions.
RDNT:
| 年份 | 预测最高价 | 预测平均价格 | 预测最低价 | 涨跌幅 |
|---|---|---|---|---|
| 2025 | 0.0182133 | 0.01239 | 0.0117705 | 0 |
| 2026 | 0.019586112 | 0.01530165 | 0.0111702045 | 23 |
| 2027 | 0.0244214334 | 0.017443881 | 0.01517617647 | 40 |
| 2028 | 0.028887066936 | 0.0209326572 | 0.015490166328 | 68 |
| 2029 | 0.02839724275752 | 0.024909862068 | 0.0211733827578 | 101 |
| 2030 | 0.029318907654036 | 0.02665355241276 | 0.019723628785442 | 115 |
RUNE:
| 年份 | 预测最高价 | 预测平均价格 | 预测最低价 | 涨跌幅 |
|---|---|---|---|---|
| 2025 | 0.96903 | 0.7178 | 0.602952 | 0 |
| 2026 | 1.20608345 | 0.843415 | 0.5397856 | 18 |
| 2027 | 1.3321739925 | 1.024749225 | 0.737819442 | 43 |
| 2028 | 1.2256000731 | 1.17846160875 | 0.8602769743875 | 65 |
| 2029 | 1.43041670070075 | 1.202030840925 | 0.90152313069375 | 68 |
| 2030 | 1.566306287267321 | 1.316223770812875 | 1.26357481998036 | 84 |
IV. Investment Strategy Comparison: RDNT vs RUNE
Long-term vs Short-term Investment Strategies
- RDNT: Suitable for investors focused on cross-chain DeFi lending and ecosystem potential
- RUNE: Suitable for investors interested in decentralized exchange infrastructure and Bitcoin ecosystem integration
Risk Management and Asset Allocation
- Conservative investors: RDNT: 30% vs RUNE: 70%
- Aggressive investors: RDNT: 60% vs RUNE: 40%
- Hedging tools: Stablecoin allocation, options, cross-currency combinations
V. Potential Risk Comparison
Market Risk
- RDNT: Higher volatility due to lower market cap and trading volume
- RUNE: Exposure to broader crypto market trends and Bitcoin ecosystem dynamics
Technical Risk
- RDNT: Scalability, network stability across multiple chains
- RUNE: Network security, potential vulnerabilities in cross-chain operations
Regulatory Risk
- Global regulatory policies may impact both tokens differently, with DeFi lending platforms potentially facing increased scrutiny
VI. Conclusion: Which Is the Better Buy?
📌 Investment Value Summary:
- RDNT advantages: First-mover in cross-chain lending, potential for rapid growth in DeFi sector
- RUNE advantages: Established presence in Bitcoin ecosystem, higher liquidity and market cap
✅ Investment Advice:
- New investors: Consider a balanced approach, leaning towards RUNE for its established market position
- Experienced investors: Explore RDNT for higher growth potential, while maintaining exposure to RUNE
- Institutional investors: Evaluate both tokens based on specific DeFi strategy and risk tolerance
⚠️ Risk Warning: Cryptocurrency markets are highly volatile. This article does not constitute investment advice. None
VII. FAQ
Q1: What are the main differences between RDNT and RUNE? A: RDNT is the native token of Radiant Capital, focusing on cross-chain lending, while RUNE is the native token of THORChain, powering a decentralized exchange network. RDNT has a lower market cap and trading volume, while RUNE has a more established presence in the Bitcoin ecosystem.
Q2: Which token has shown better historical price performance? A: RUNE has shown better historical price performance, reaching an all-time high of $20.87 in May 2021, compared to RDNT's all-time high of $0.585268 in September 2022. However, both tokens have experienced significant price drops since their peaks.
Q3: What are the key factors affecting the investment value of RDNT and RUNE? A: Key factors include supply mechanisms, institutional adoption, technical development, ecosystem building, and macroeconomic conditions. Both tokens utilize utility-based tokenomics and are positioned as DeFi infrastructure plays.
Q4: How do the price predictions for RDNT and RUNE compare for 2030? A: For 2030, RDNT's base scenario predicts a range of $0.0197 - $0.0266, with an optimistic scenario of $0.0266 - $0.0293. RUNE's base scenario predicts a range of $1.2635 - $1.3162, with an optimistic scenario of $1.3162 - $1.5663.
Q5: What are the main risks associated with investing in RDNT and RUNE? A: Main risks include market volatility, technical risks such as scalability and network security, and regulatory risks, especially for DeFi lending platforms. RDNT may face higher volatility due to its lower market cap and trading volume.
Q6: How should investors approach allocating between RDNT and RUNE? A: Conservative investors might consider allocating 30% to RDNT and 70% to RUNE, while aggressive investors might allocate 60% to RDNT and 40% to RUNE. The specific allocation should be based on individual risk tolerance and investment goals.
Q7: Which token might be more suitable for different types of investors? A: New investors might lean towards RUNE for its established market position. Experienced investors could explore RDNT for higher growth potential while maintaining exposure to RUNE. Institutional investors should evaluate both tokens based on their specific DeFi strategy and risk tolerance.
Share
Content
Introduction: Investment Comparison of RDNT vs RUNE
I. Price History Comparison and Current Market Status
II. Core Factors Affecting RDNT vs RUNE Investment Value
III. 2025-2030 Price Prediction: RDNT vs RUNE
IV. Investment Strategy Comparison: RDNT vs RUNE
V. Potential Risk Comparison
VI. Conclusion: Which Is the Better Buy?
VII. FAQ

