SOV vs THETA: Comparing Two Innovative Blockchain Projects in the DeFi Space
Introduction: SOV vs THETA Investment Comparison
In the cryptocurrency market, the comparison between SOV and THETA has always been an unavoidable topic for investors. The two not only show significant differences in market cap ranking, application scenarios, and price performance, but also represent different positioning in crypto assets.
Sovryn (SOV): Since its launch in 2021, it has gained market recognition for its decentralized bitcoin lending and margin trading system.
Theta (THETA): Introduced in 2017, it has been hailed as a decentralized video streaming platform, and is one of the cryptocurrencies with high global trading volume and market capitalization.
This article will comprehensively analyze the investment value comparison between SOV and THETA, focusing on historical price trends, supply mechanisms, institutional adoption, technological ecosystems, and future predictions, attempting to answer the question investors care about most:
"Which is the better buy right now?"
I. Price History Comparison and Current Market Status
SOV and THETA Historical Price Trends
- 2021: THETA reached its all-time high of $15.72 on April 16, 2021, during the bull market.
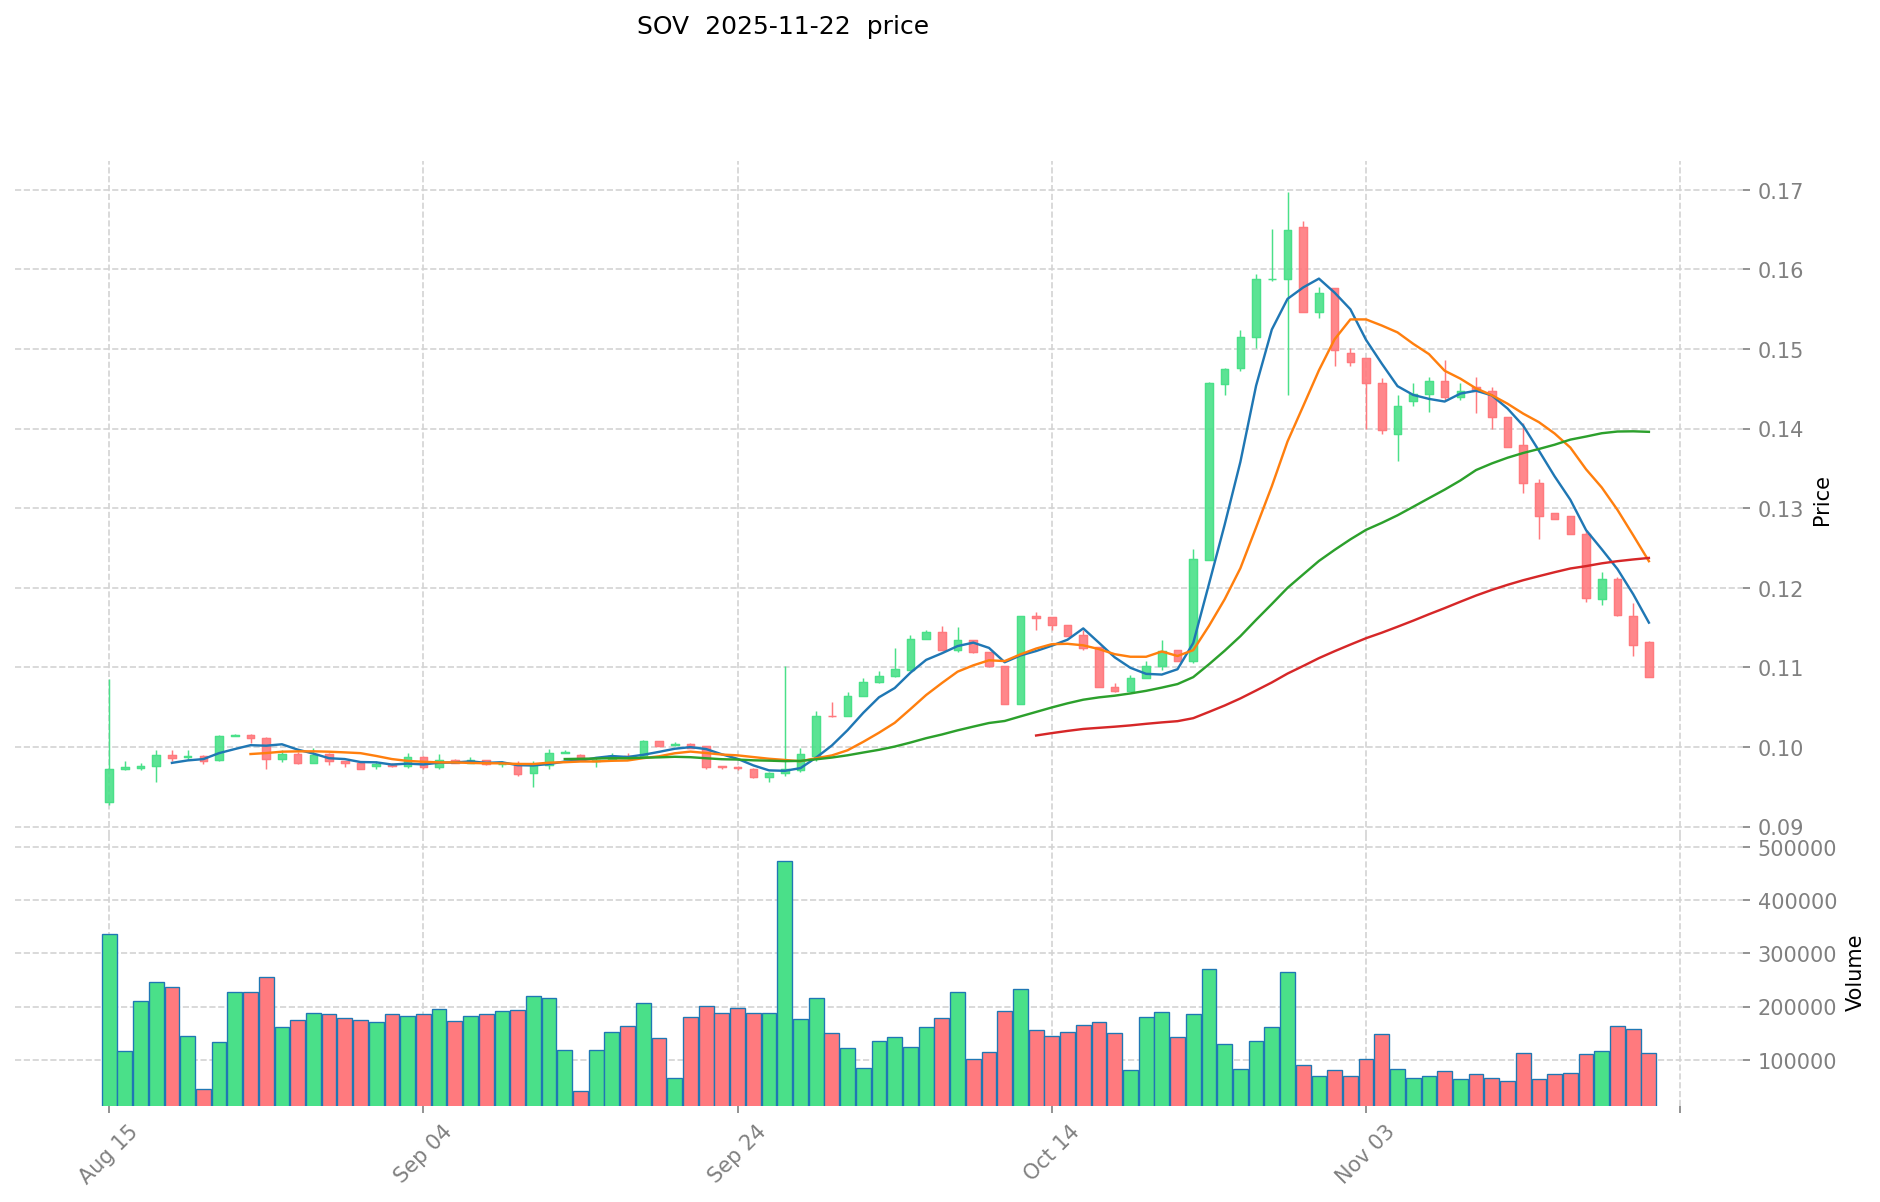
- 2025: SOV hit its all-time low of $0.087564 on August 3, 2025, indicating a significant price decline.
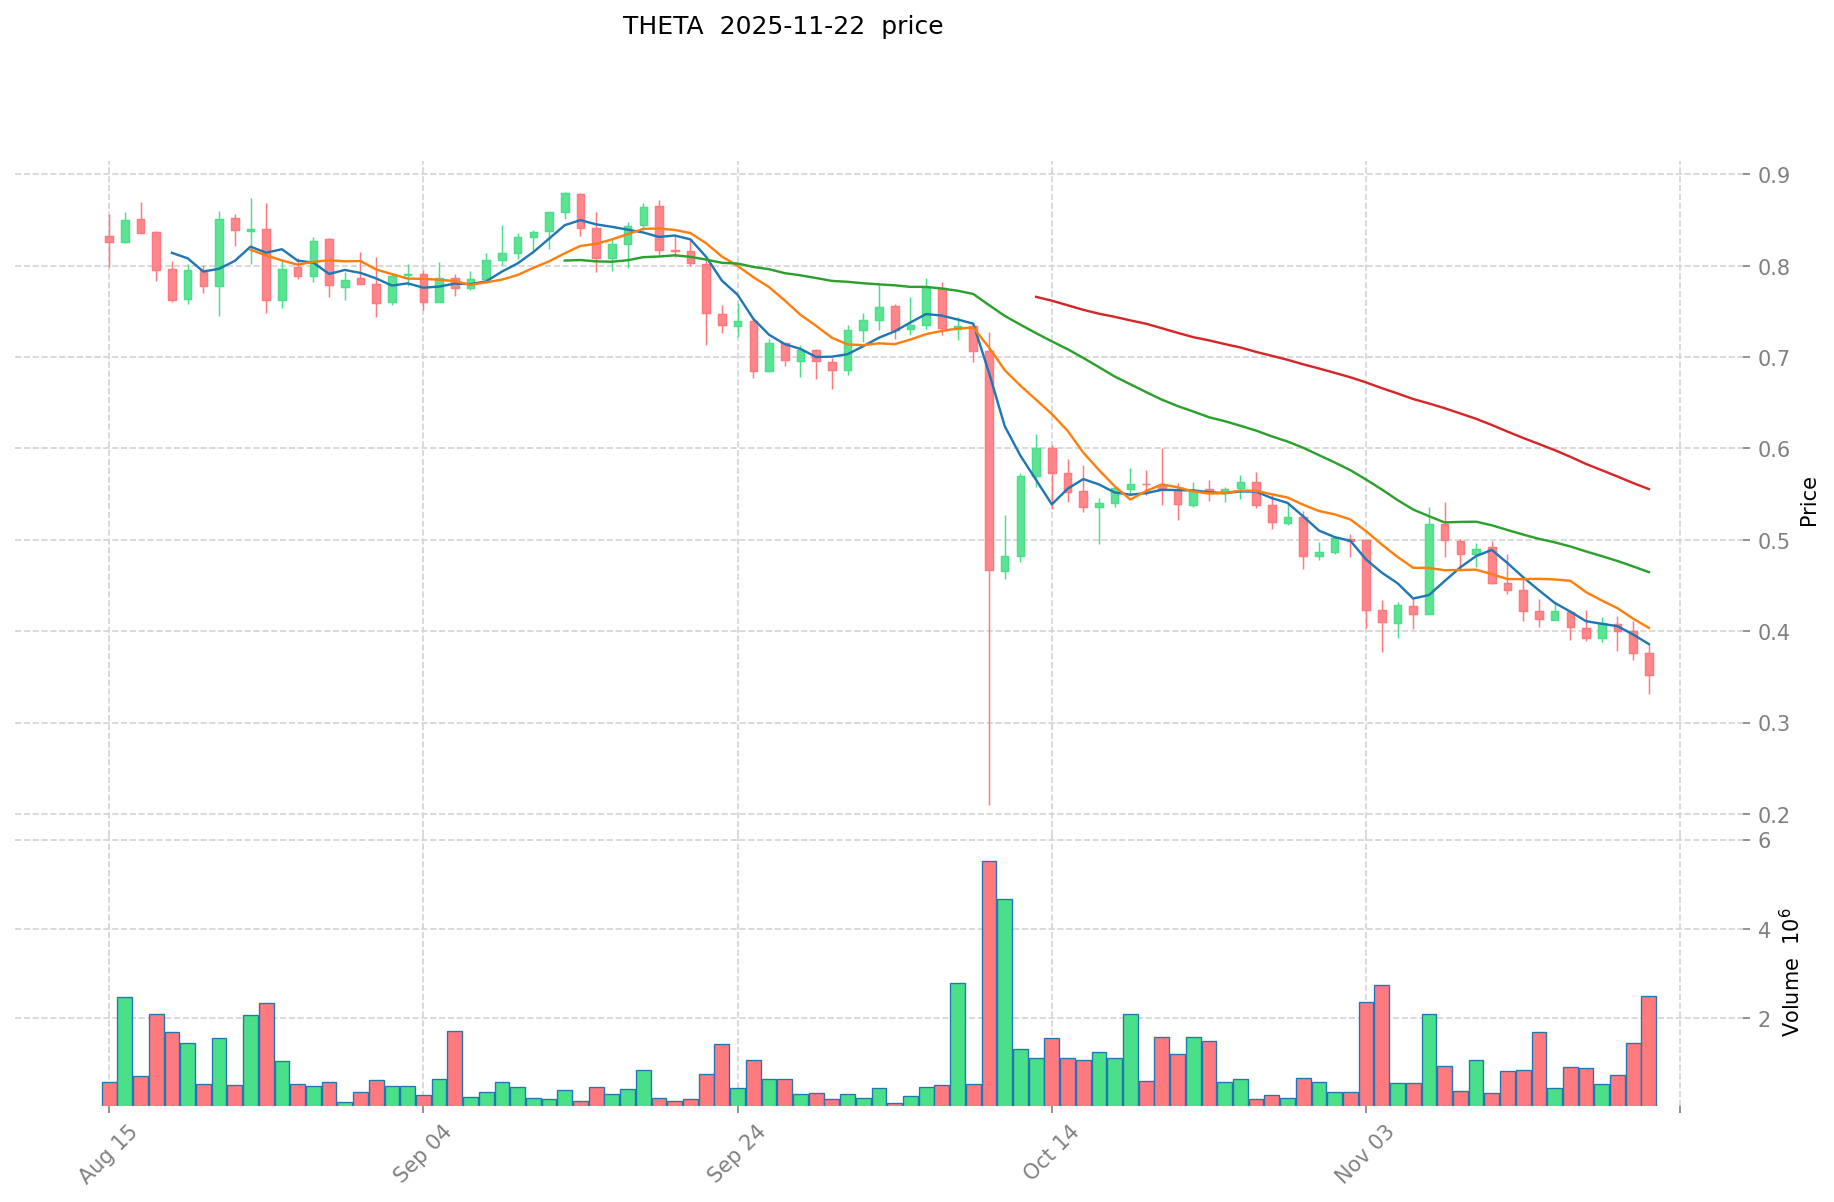
- Comparative analysis: In the recent market cycle, SOV has fallen from its all-time high of $43.98 to its current price of $0.10913, while THETA has dropped from its peak of $15.72 to $0.3399.
Current Market Situation (2025-11-22)
- SOV current price: $0.10913
- THETA current price: $0.3399
- 24-hour trading volume: SOV $9,328.61 vs THETA $674,200.11
- Market Sentiment Index (Fear & Greed Index): 11 (Extreme Fear)
Click to view real-time prices:
- Check SOV current price Market Price
- Check THETA current price Market Price
II. Core Factors Affecting SOV vs THETA Investment Value
Supply Mechanism Comparison (Tokenomics)
- SOV: Fixed supply with deflationary model, total supply capped at 21 million tokens
- THETA: Limited supply of 1 billion tokens with no further minting
- 📌 Historical Pattern: Fixed supply models tend to support price appreciation during periods of increased adoption and network growth.
Institutional Adoption and Market Applications
- Institutional Holdings: THETA has attracted more strategic partnerships from corporations like Sony and Samsung, while SOV has limited institutional exposure
- Enterprise Adoption: THETA has practical applications in video delivery and content streaming platforms, while SOV focuses on sovereignty-preserving financial infrastructure
- National Policies: Both tokens face varying regulatory treatment across jurisdictions, with clearer pathways for THETA due to its utility-focused approach
Technology Development and Ecosystem Building
- SOV Technology Upgrades: Layer 2 scaling solutions for faster transaction processing and enhanced security features
- THETA Technology Development: Multi-BFT consensus mechanism, advanced edge computing network, and decentralized video delivery infrastructure
- Ecosystem Comparison: THETA has a more established ecosystem around video streaming applications, while SOV's ecosystem is still developing its DeFi and payment applications
Macroeconomic Factors and Market Cycles
- Performance in Inflationary Environments: SOV is positioned as a potential inflation hedge due to its fixed supply, while THETA's value proposition is less correlated with inflation trends
- Macroeconomic Monetary Policy: Interest rate hikes tend to pressure both assets, but SOV typically experiences higher volatility in response to monetary policy changes
- Geopolitical Factors: SOV potentially benefits from sovereign wealth preservation demands during political instability, while THETA remains focused on technological adoption regardless of geopolitical tensions
III. 2025-2030 Price Prediction: SOV vs THETA
Short-term Prediction (2025)
- SOV: Conservative $0.0927 - $0.1091 | Optimistic $0.1091 - $0.1276
- THETA: Conservative $0.3135 - $0.3408 | Optimistic $0.3408 - $0.3953
Mid-term Prediction (2027)
- SOV may enter a growth phase, with an estimated price range of $0.0940 - $0.1880
- THETA may enter a steady growth phase, with an estimated price range of $0.3428 - $0.5447
- Key drivers: Institutional capital inflow, ETFs, ecosystem development
Long-term Prediction (2030)
- SOV: Base scenario $0.1752 - $0.1844 | Optimistic scenario $0.1844 - $0.2397
- THETA: Base scenario $0.4648 - $0.5469 | Optimistic scenario $0.5469 - $0.8039
Disclaimer
SOV:
| 年份 | 预测最高价 | 预测平均价格 | 预测最低价 | 涨跌幅 |
|---|---|---|---|---|
| 2025 | 0.1276821 | 0.10913 | 0.0927605 | 0 |
| 2026 | 0.1622162885 | 0.11840605 | 0.0651233275 | 8 |
| 2027 | 0.188016966795 | 0.14031116925 | 0.0940084833975 | 28 |
| 2028 | 0.18058047482475 | 0.1641640680225 | 0.10834828489485 | 50 |
| 2029 | 0.196504389422932 | 0.172372271423625 | 0.087909858426048 | 57 |
| 2030 | 0.239769829550262 | 0.184438330423278 | 0.175216413902114 | 69 |
THETA:
| 年份 | 预测最高价 | 预测平均价格 | 预测最低价 | 涨跌幅 |
|---|---|---|---|---|
| 2025 | 0.395328 | 0.3408 | 0.313536 | 0 |
| 2026 | 0.39382848 | 0.368064 | 0.19875456 | 8 |
| 2027 | 0.5447531232 | 0.38094624 | 0.342851616 | 12 |
| 2028 | 0.513763146576 | 0.4628496816 | 0.39342222936 | 36 |
| 2029 | 0.60549995346912 | 0.488306414088 | 0.43459270853832 | 43 |
| 2030 | 0.803947680154483 | 0.54690318377856 | 0.464867706211776 | 60 |
IV. Investment Strategy Comparison: SOV vs THETA
Long-term vs Short-term Investment Strategy
- SOV: Suitable for investors focused on DeFi applications and sovereignty-preserving financial infrastructure
- THETA: Suitable for investors interested in video streaming technology and content delivery networks
Risk Management and Asset Allocation
- Conservative investors: SOV: 30% vs THETA: 70%
- Aggressive investors: SOV: 60% vs THETA: 40%
- Hedging tools: Stablecoin allocation, options, cross-currency portfolios
V. Potential Risk Comparison
Market Risk
- SOV: Higher volatility due to smaller market cap and lower liquidity
- THETA: Exposure to fluctuations in the broader video streaming and content delivery market
Technical Risk
- SOV: Scalability challenges, network stability issues
- THETA: Network congestion during peak usage, potential security vulnerabilities
Regulatory Risk
- Global regulatory policies may have differing impacts on both tokens, with THETA potentially facing less scrutiny due to its utility-focused approach
VI. Conclusion: Which Is the Better Buy?
📌 Investment Value Summary:
- SOV advantages: Fixed supply with deflationary model, potential as an inflation hedge
- THETA advantages: Established partnerships, practical applications in video delivery, larger ecosystem
✅ Investment Advice:
- New investors: Consider a higher allocation to THETA due to its more established market position and clearer use case
- Experienced investors: Balanced approach with exposure to both SOV and THETA, adjusting based on risk tolerance
- Institutional investors: THETA may be more attractive due to its larger market cap and institutional partnerships
⚠️ Risk Warning: The cryptocurrency market is highly volatile. This article does not constitute investment advice. None
VII. FAQ
Q1: What are the main differences between SOV and THETA in terms of their use cases? A: SOV focuses on decentralized bitcoin lending and margin trading, while THETA is a decentralized video streaming platform. SOV is positioned as a sovereignty-preserving financial infrastructure, whereas THETA has practical applications in video delivery and content streaming.
Q2: How do the supply mechanisms of SOV and THETA compare? A: SOV has a fixed supply with a deflationary model, capped at 21 million tokens. THETA has a limited supply of 1 billion tokens with no further minting. Both have fixed supply models, which tend to support price appreciation during periods of increased adoption and network growth.
Q3: Which token has attracted more institutional adoption? A: THETA has attracted more strategic partnerships from corporations like Sony and Samsung, while SOV has limited institutional exposure. This gives THETA an advantage in terms of enterprise adoption and market applications.
Q4: How do the ecosystems of SOV and THETA compare? A: THETA has a more established ecosystem around video streaming applications, while SOV's ecosystem is still developing its DeFi and payment applications. THETA's ecosystem is more mature and diverse at this point.
Q5: What are the key factors affecting the long-term price predictions for SOV and THETA? A: Key factors include institutional capital inflow, potential ETF approvals, ecosystem development, technological advancements, regulatory environment, and overall market conditions. These factors contribute to the projected growth for both tokens by 2030.
Q6: How do the investment strategies differ for SOV and THETA? A: SOV is suitable for investors focused on DeFi applications and sovereignty-preserving financial infrastructure. THETA is more appropriate for those interested in video streaming technology and content delivery networks. Conservative investors might consider a 30% SOV / 70% THETA split, while aggressive investors might opt for a 60% SOV / 40% THETA allocation.
Q7: What are the main risks associated with investing in SOV and THETA? A: For SOV, risks include higher volatility due to smaller market cap, lower liquidity, scalability challenges, and network stability issues. THETA faces risks related to fluctuations in the video streaming market, potential network congestion during peak usage, and security vulnerabilities. Both tokens are subject to regulatory risks, though THETA may face less scrutiny due to its utility-focused approach.
Share
Content
Introduction: SOV vs THETA Investment Comparison
I. Price History Comparison and Current Market Status
II. Core Factors Affecting SOV vs THETA Investment Value
III. 2025-2030 Price Prediction: SOV vs THETA
IV. Investment Strategy Comparison: SOV vs THETA
V. Potential Risk Comparison
VI. Conclusion: Which Is the Better Buy?
VII. FAQ

