Gate Research: BTC and ETH in Weak Consolidation as MA Strategy Captures Trend Breakouts
Market Overview
To systematically present the current capital behavior and structural changes in the cryptocurrency market, this report examines five key dimensions: the price volatility of Bitcoin and Ethereum, the long–short ratio (LSR), the size of futures open interest, funding rates, and liquidation data. Together, these indicators cover price trends, capital sentiment, and risk conditions, providing a comprehensive view of the market’s trading intensity and structural characteristics. The following sections analyze the latest developments in each metric since November 4:
1. Bitcoin and Ethereum Price Volatility Analysis
According to CoinGecko data, during the period from November 4 to November 17, BTC and ETH continued to exhibit a weak consolidation pattern, with prices trending downward since October and overall market sentiment remaining cautious. After falling from the 125,000-USD region, BTC continued to weaken, attempting several short-term rebounds but failing to break previous highs, leaving the overall trend biased to the downside. ETH moved in general alignment with BTC, slipping from above 4,000 USD and showing even more muted rebound strength.【1】【2】【3】During this period, BTC briefly broke below 95,000 USD before stabilizing sideways, though with limited buying momentum; ETH found temporary support near 3,000 USD but its rebound was noticeably weaker than BTC. Overall, both assets remain in a downward structure, with recent rebounds largely driven by short-covering rather than a trend reversal.
Macro and on-chain factors have jointly intensified the downward pressure. Despite the government shutdown ending last week, liquidity has not returned to markets; instead, crypto assets continued to weaken. Expectations for a December rate cut fell sharply from around 67% to 46%. Spot ETFs saw net outflows of 3.6 billion USD over the past two weeks. Long-term on-chain holders sold approximately 815,000 BTC within the past 30 days—the largest amount in nearly a year—further weighing on prices. High-leverage liquidations amplified volatility, keeping sentiment subdued. From a medium-term perspective, as deleveraging progresses, structural opportunities may gradually emerge and warrant investor attention.
In summary, BTC and ETH remain in a weak post-correction consolidation phase. Unless BTC can reclaim the 115,000-USD region, or ETH can regain the 3,800–4,000-USD range with meaningful volume, short-term market action is likely to remain in a weak, range-bound mode.
Figure 1: BTC and ETH continue to retrace from their highs; rebounds throughout the period remain weak, sustaining a downward-bias trend.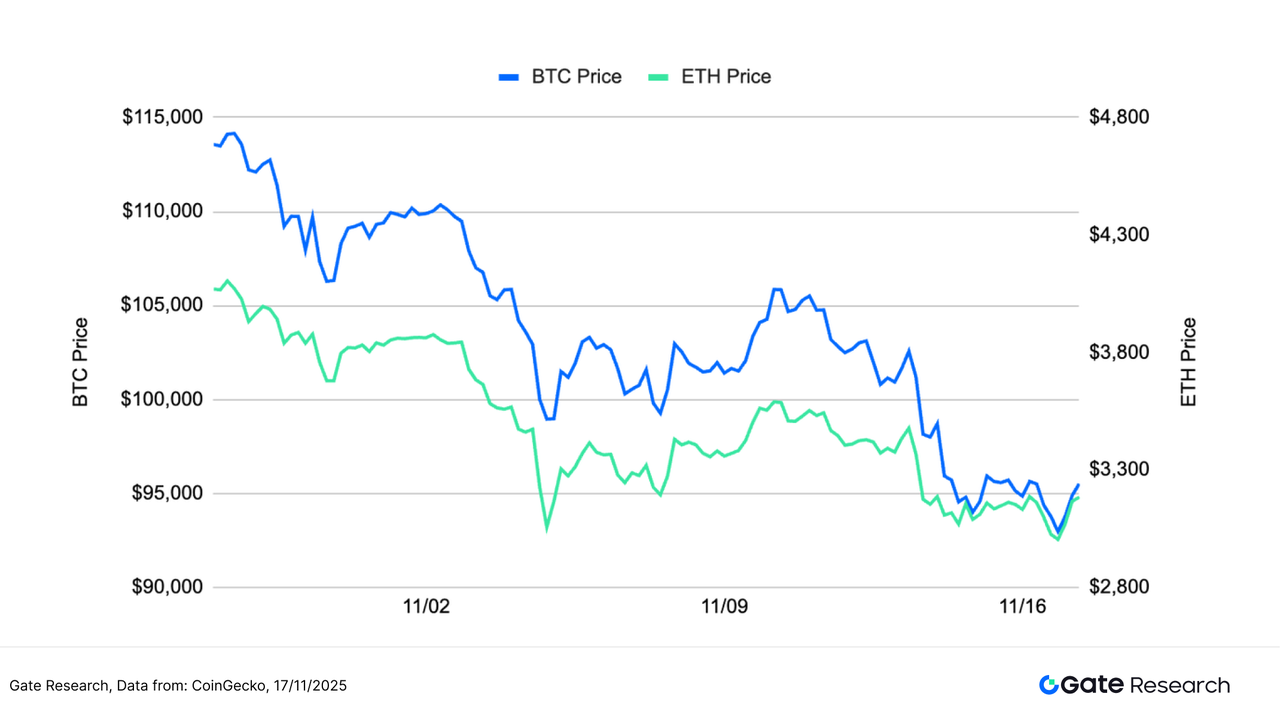
BTC and ETH’s short-term volatility has shown a pattern of frequent oscillations, with multiple sharp spikes throughout the period. BTC’s volatility surged significantly on several key trading days—more pronounced than ETH—indicating stronger emotional reactions during price declines. ETH volatility also remained active, though with generally lower peak magnitudes, reflecting frequent short-term fluctuations but with comparatively moderate strength.
Overall, the market remains in a sensitive and unstable state. BTC’s pronounced volatility spikes highlight intensified battles between longs and shorts at key price levels, while ETH’s persistent volatility suggests continuous short-term capital rotation and elevated sentiment sensitivity. If subsequent volatility for both assets expands further alongside rising trading volume, it may signal the start of a new directional move. Continued observation of the interaction between volatility and volume is recommended.
Figure 2: BTC volatility spikes multiple times, reflecting strong emotional responses; ETH volatility remains active with comparatively softer peaks.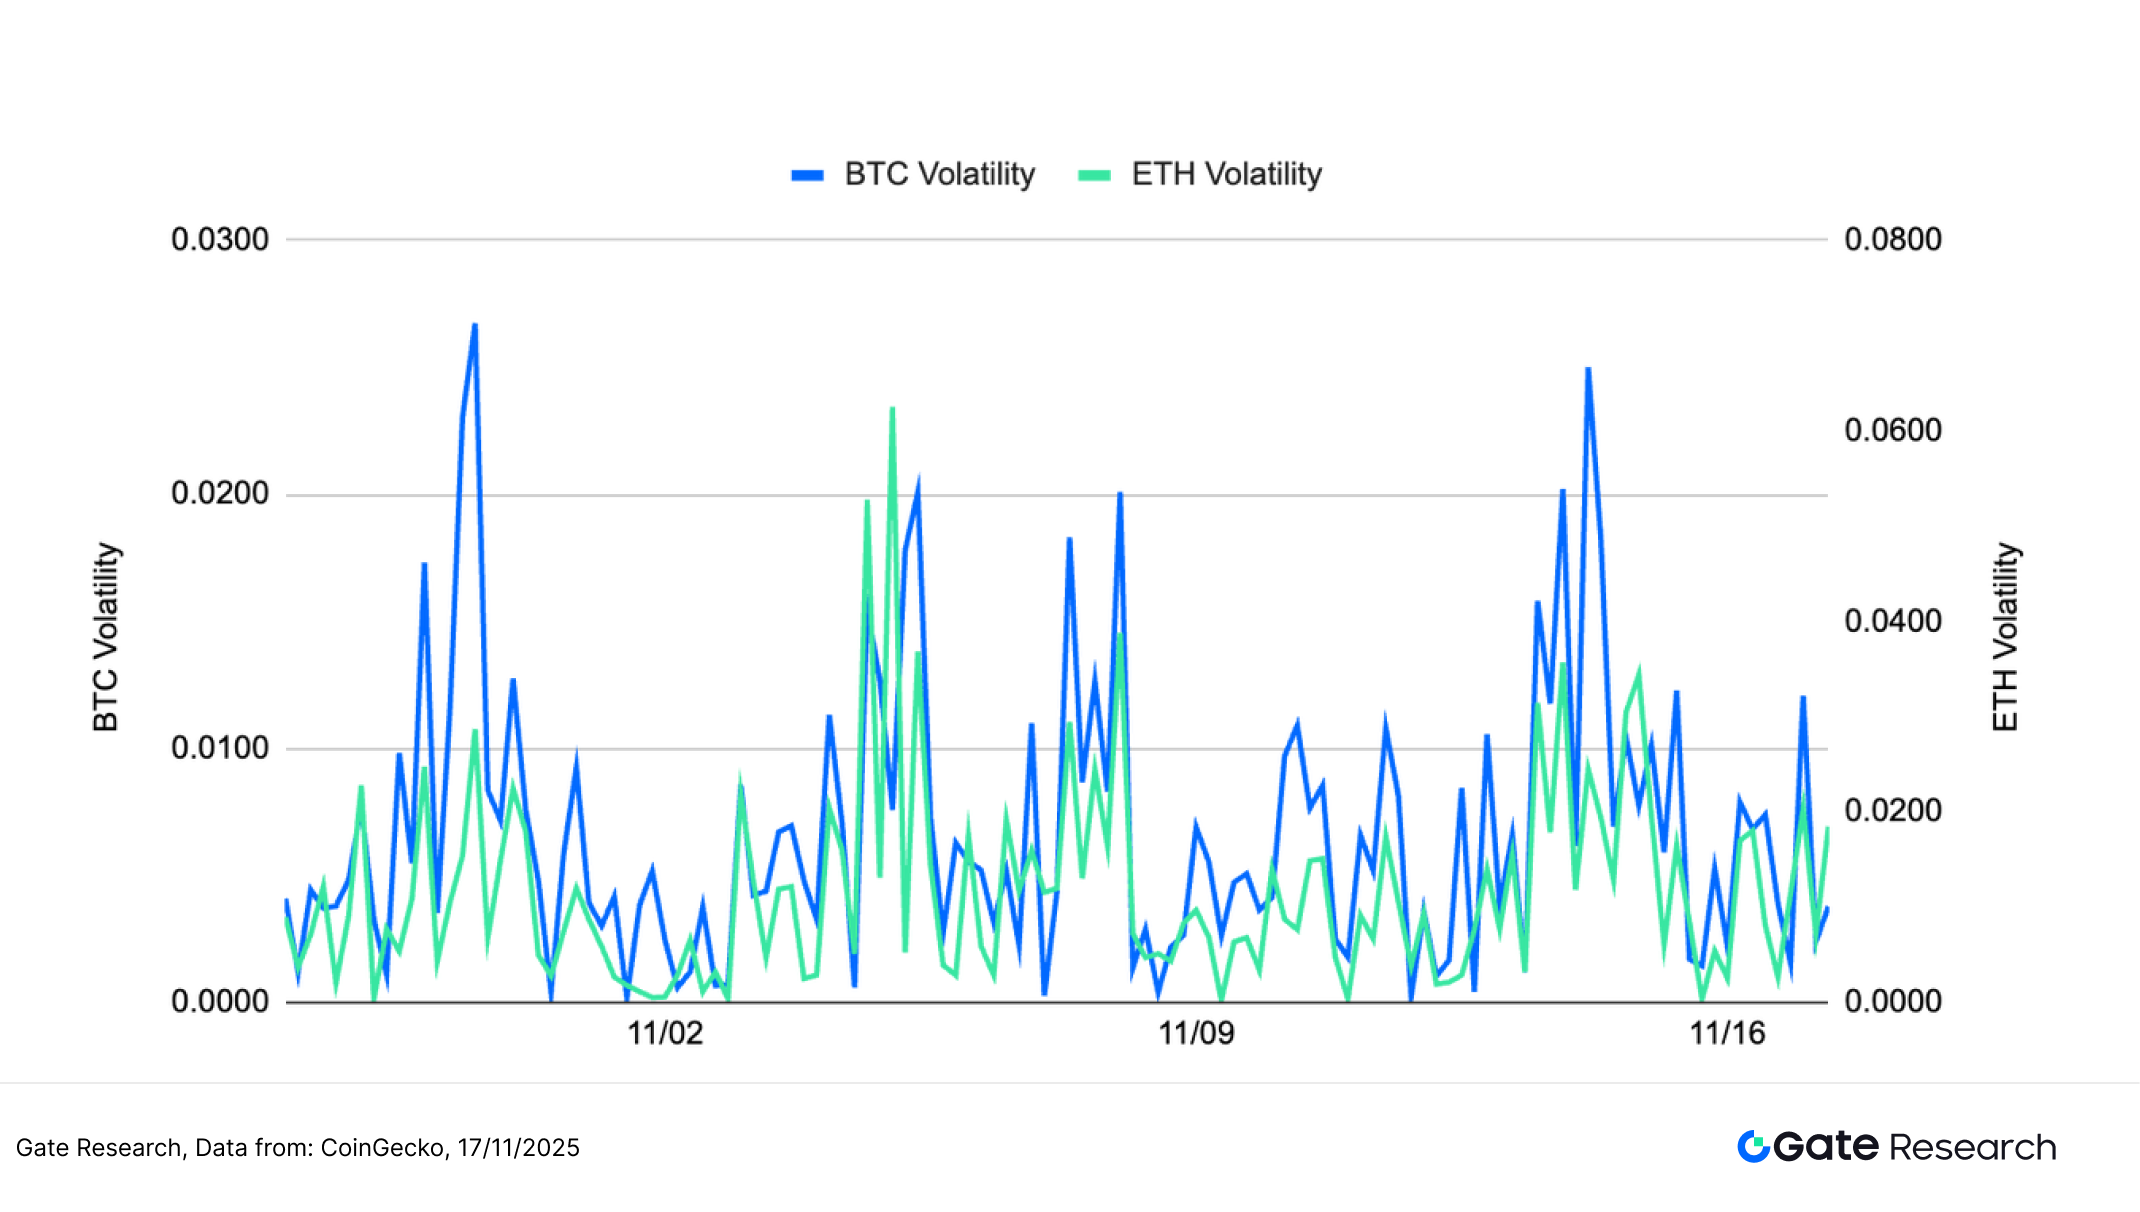
Recently, BTC and ETH prices have continued to weaken, with multiple rapid volatility surges occurring during the downtrend—reflecting fragile sentiment and heightened market sensitivity around key price levels. If volatility continues to rise and coincides with increased trading volume, a short-term directional move may soon unfold.
2. Analysis of Long/Short Taker Size Ratio (LSR) for Bitcoin and Ethereum
The Long/Short Taker Size Ratio (LSR) is a key indicator that measures the volume of aggressive buying versus aggressive selling, often used to gauge market sentiment and trend strength. An LSR greater than 1 indicates that the volume of market buys (aggressive longs) exceeds that of market sells (aggressive shorts), suggesting a bullish market bias.
According to Coinglass data, during the period from November 4 to November 17, the long–short ratio (LSR) for both BTC and ETH fluctuated narrowly around 1, indicating persistent tug-of-war sentiment in a weak market environment, with no clear directional bias forming among traders.【5】
BTC’s LSR oscillated repeatedly within the 0.9–1.0 range, with short-term buying and selling pressure alternating in dominance. Only on a few occasions did the ratio briefly rise above 1, reflecting still-weak momentum on the long side. Overall, the market remained characterized by cautious positioning and tentative rebound attempts. ETH’s LSR displayed larger fluctuations, frequently dipping toward 0.9 before quickly rebounding into the 1.0–1.05 range, suggesting more active short-term capital flows and faster shifts between bullish and bearish sentiment, particularly at lower price levels where sensitivity is heightened.
In general, the long–short ratios for BTC and ETH remain in a range-bound oscillatory pattern. Although sentiment has not fully strengthened, the slight upward bias in mid-November suggests that bearish pressure has eased to some extent. If the LSR can stabilize above 1 in the coming sessions, accompanied by a recovery in trading volume, it may serve as an early signal of market stabilization or even a short-term rebound.
Figure 3: BTC’s LSR oscillates repeatedly between 0.9 and 1.0, reflecting still-weak long momentum.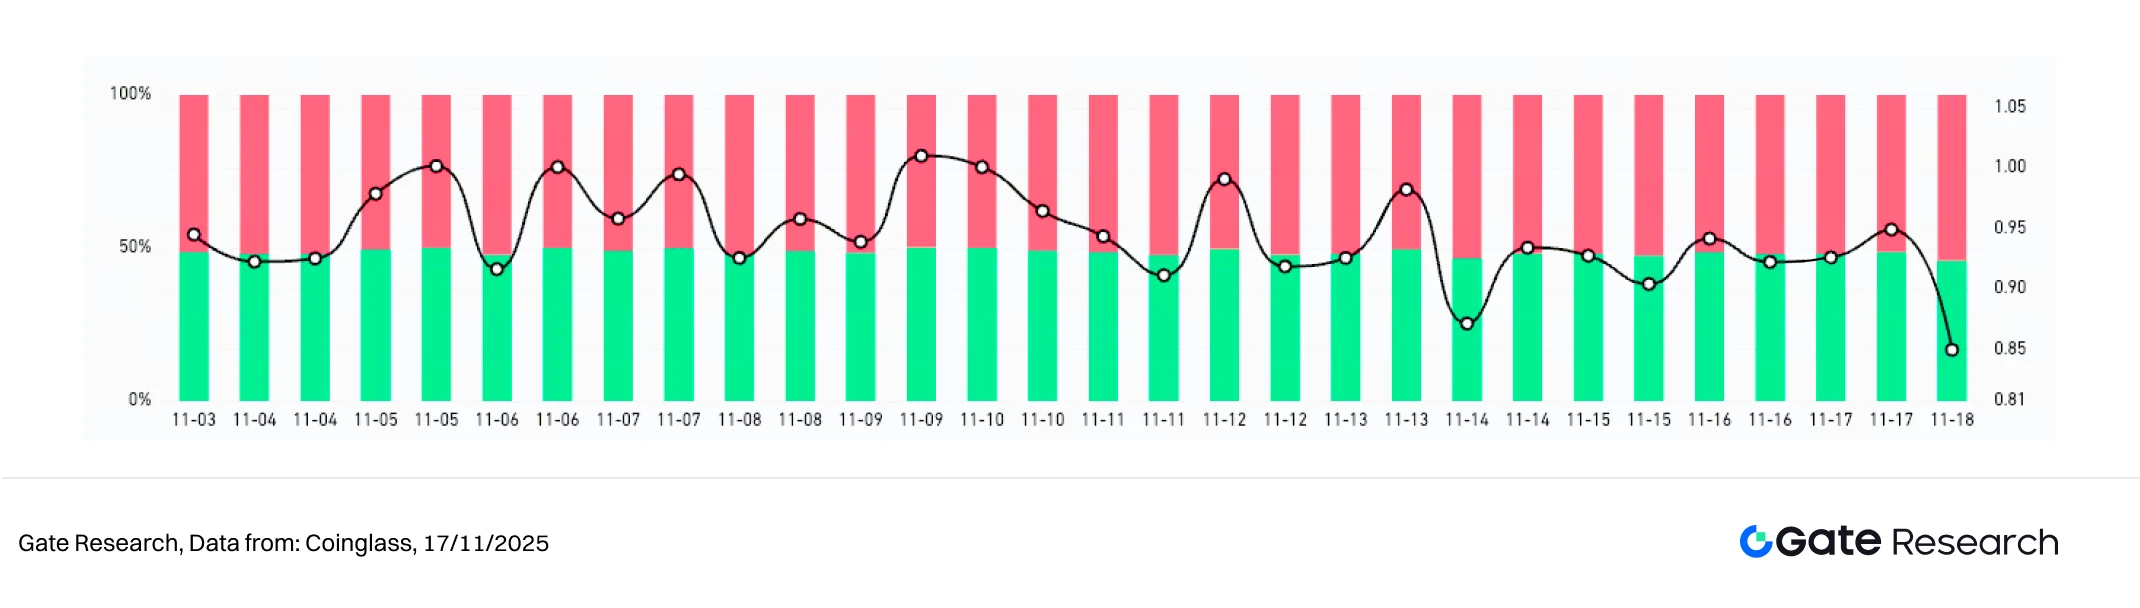
Figure 4: ETH’s LSR shows more active fluctuations, with faster shifts in short-term sentiment.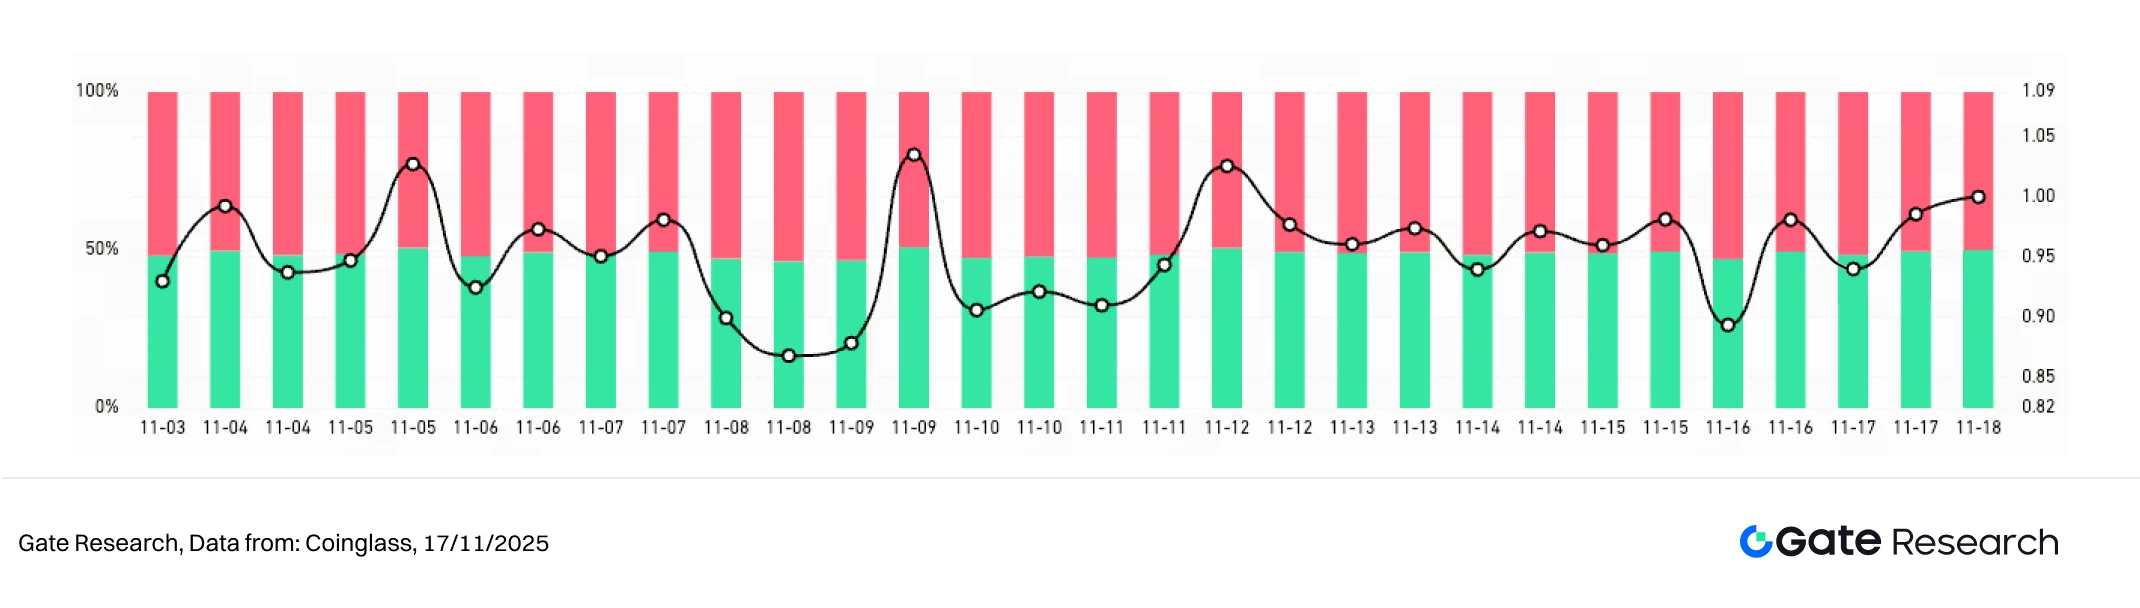
3. Open Interest Analysis
According to Coinglass data, over the past two weeks, the futures open interest (OI) of BTC and ETH has continued to weaken. After experiencing significant deleveraging at the end of October, OI has not shown meaningful recovery and remains in a low-range consolidation. The current OI structure suggests that market leverage sentiment remains conservative, with no large-scale capital re-entry observed.【6】
For BTC, open interest has hovered at relatively low levels after falling sharply from its early-October peak, with no clear signs of re-leveraging. This indicates ongoing caution among long positions in a weak market environment, and highlights the strong wait-and-see attitude among institutions and major participants. ETH’s OI also shows a step-down pattern, with a notable drop in early November followed by mild fluctuations at low levels. Compared with BTC, ETH’s OI has shown no stronger recovery, suggesting that capital remains cautious toward its medium-term outlook.
Overall, the current leverage structure is still in a “post-deleveraging observation phase,” with limited capital inflows and insufficient momentum to drive a clear trend. If prices stabilize and rebound with rising trading volume, OI may begin to recover; however, if the market weakens again, the currently low OI structure could amplify short-term volatility risks.
Figure 5: BTC open interest drops sharply from its peak and remains in a low-range consolidation, showing weak capital inflow willingness.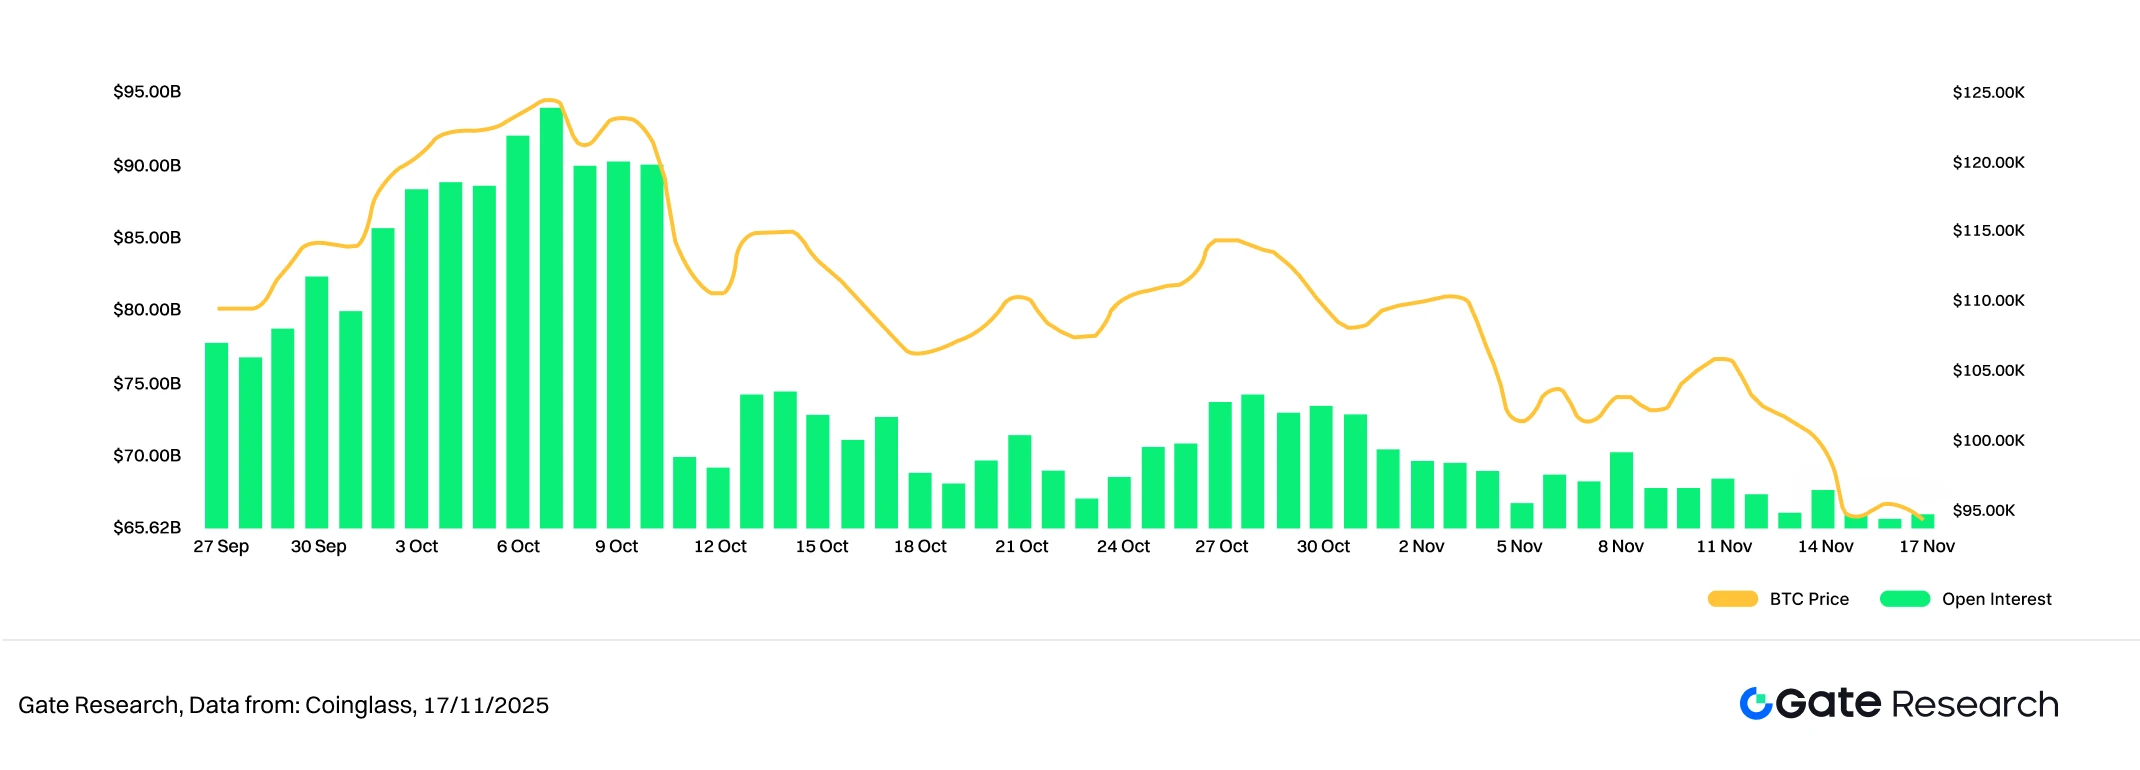
Figure 6: ETH open interest continues to decline into a low range, indicating leveraged capital remains hesitant.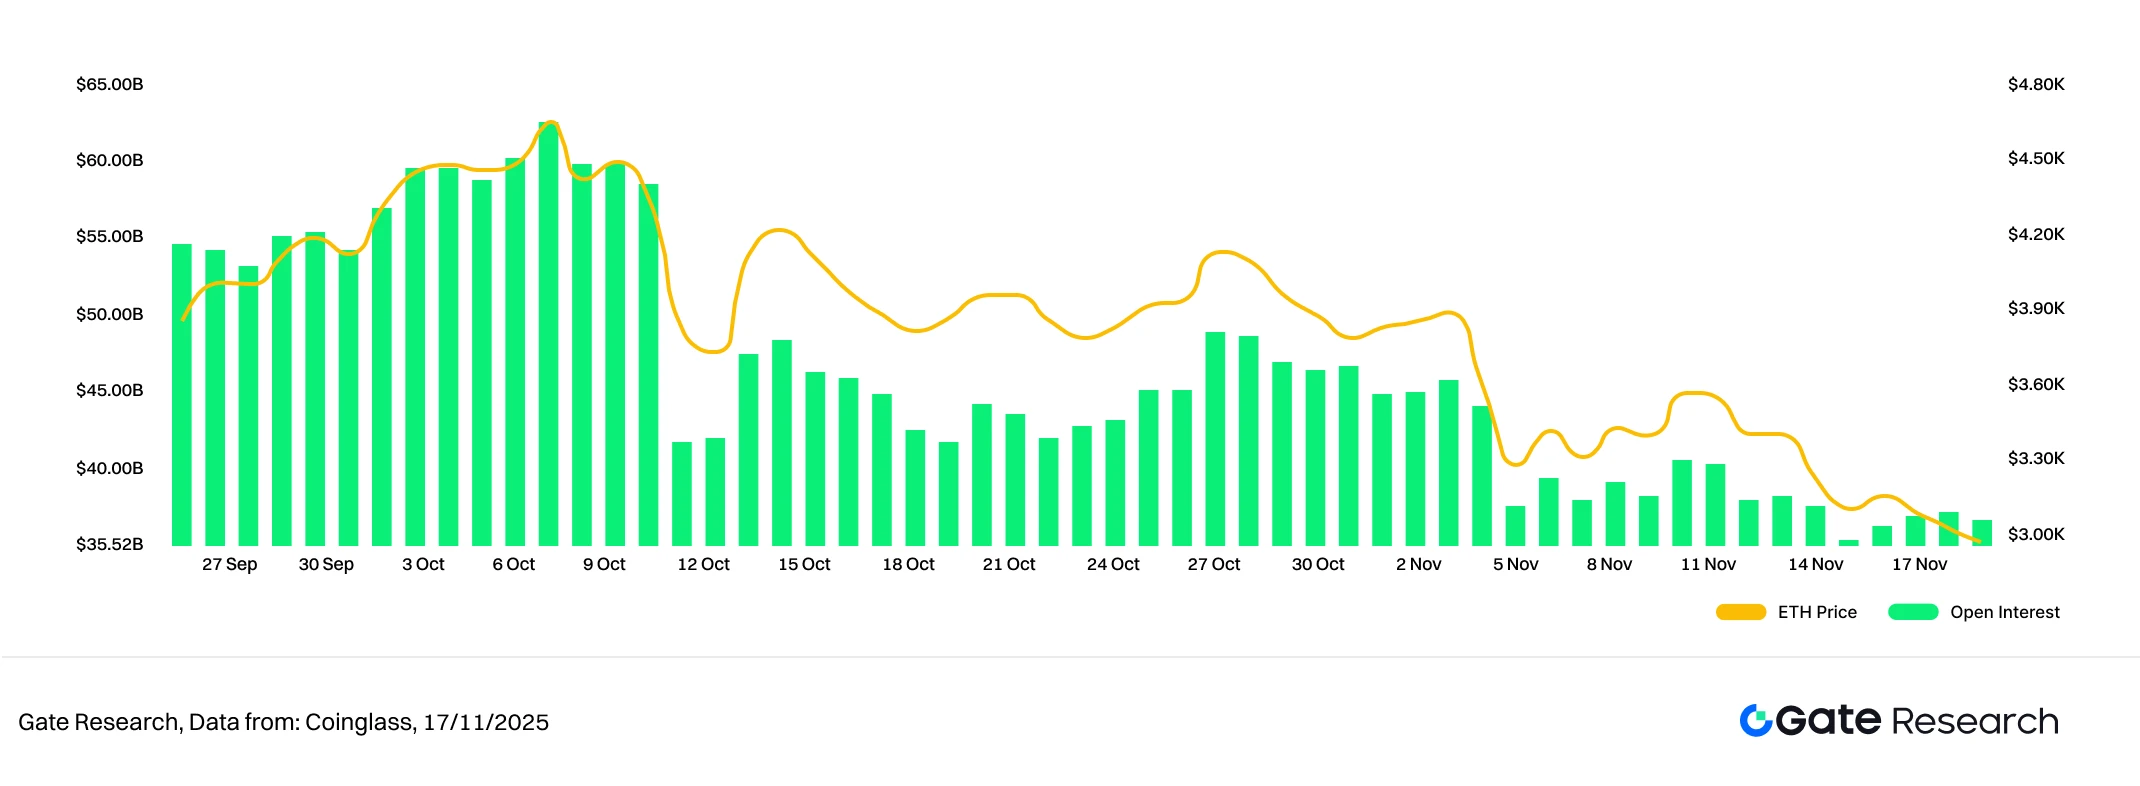
4. Funding Rate
The funding rates for both BTC and ETH have exhibited high-frequency fluctuations, rapidly switching between positive and negative territory around the zero level. This reflects a market environment where bullish and bearish sentiment repeatedly oscillates and no clear directional consensus has formed. As shown in the chart, BTC’s funding rate volatility has increased significantly, with multiple rapid shifts from positive to negative and swift reversals back above zero. This indicates that leveraged traders are frequently adjusting their positions in a weak market, and short-term sentiment remains cautious.【7】【8】
ETH’s funding rate shows similarly sharp swings, turning negative quickly during several pullback phases and then bouncing back above zero just as rapidly. This suggests that short-term capital flows are more sensitive and react more quickly to price changes. Overall, ETH’s amplitude of fluctuation is slightly higher than BTC’s, reflecting stronger short-term trading activity and more active position adjustments.
In summary, funding rates across the market are currently in a “non-directional, fast-paced” oscillatory state, while open interest continues to decline and remains at low levels. If funding rates can stabilize in positive territory alongside rising trading volume, it may signal potential market stabilization or even a rebound. Conversely, if funding rates stay negative for an extended period, it could indicate strengthening bearish momentum and further downside pressure on prices.
Figure 7: BTC and ETH funding rates oscillate rapidly around zero, reflecting repeated shifts in sentiment and lack of directional clarity.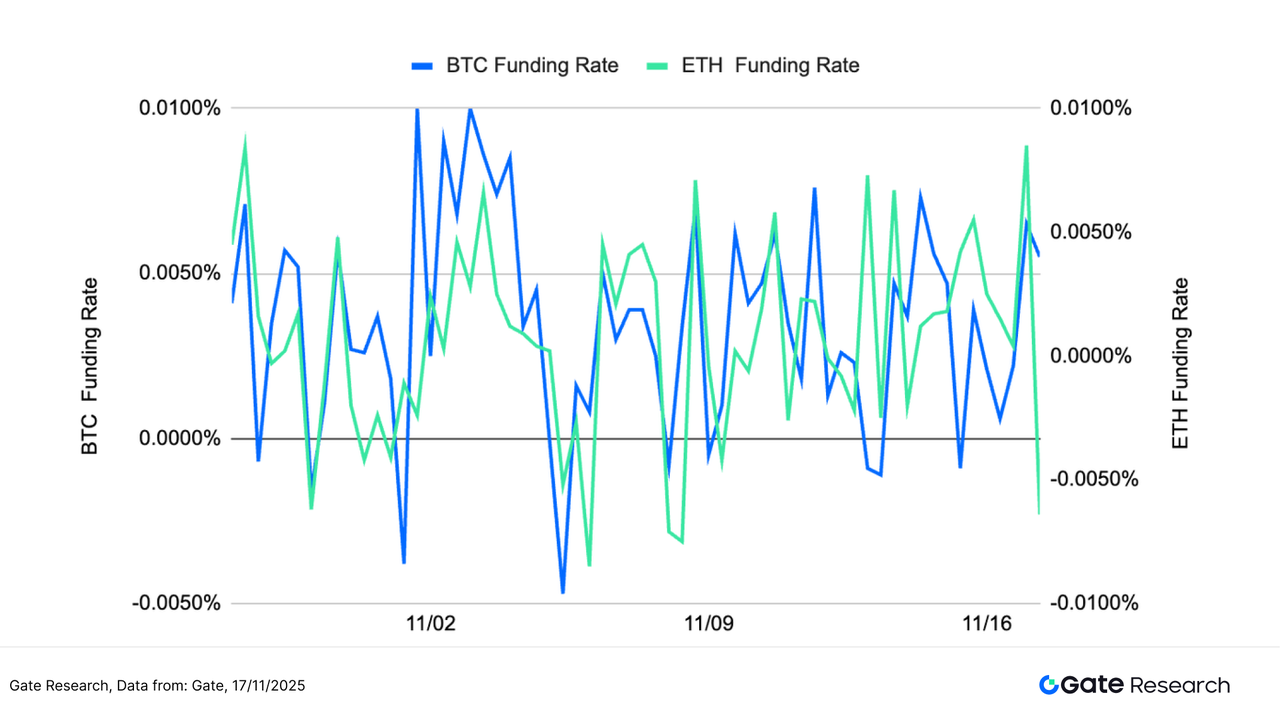
5. Cryptocurrency Liquidation Chart
According to Coinglass data, long liquidations in the crypto market over the past two weeks have been significantly larger than short liquidations, indicating that long positions under high leverage remain the most pressured during the ongoing market downturn. On November 3 and November 4, the market saw the largest liquidation events of the month, with single-day long liquidations surging to the 1.0–1.5 billion USD range. This reflects a wave of forced long-position unwinding triggered after prices broke below key support levels.【9】
In the two weeks that followed, although long liquidations declined from their peak, frequent multi-hundred-million-dollar liquidation events continued, showing that dip-buying capital consistently faced stop-outs after failed rebounds. Short liquidations, by contrast, remained relatively small, only expanding briefly during minor price bounces and never becoming a dominant force.
Overall, the liquidation structure currently reflects a “fragile longs, resilient shorts” pattern, suggesting that downward leverage pressure has not yet been fully resolved. If prices fail to stabilize or if volatility continues to rise, the market may again be at risk of concentrated liquidations in the short term. Conversely, if liquidation volumes continue to contract, the market would be closer to completing its deleveraging cycle and stabilizing sentiment.
Figure 8: Long liquidations surged in early November; subsequent long liquidations remained higher than short liquidations, indicating unresolved downside pressure.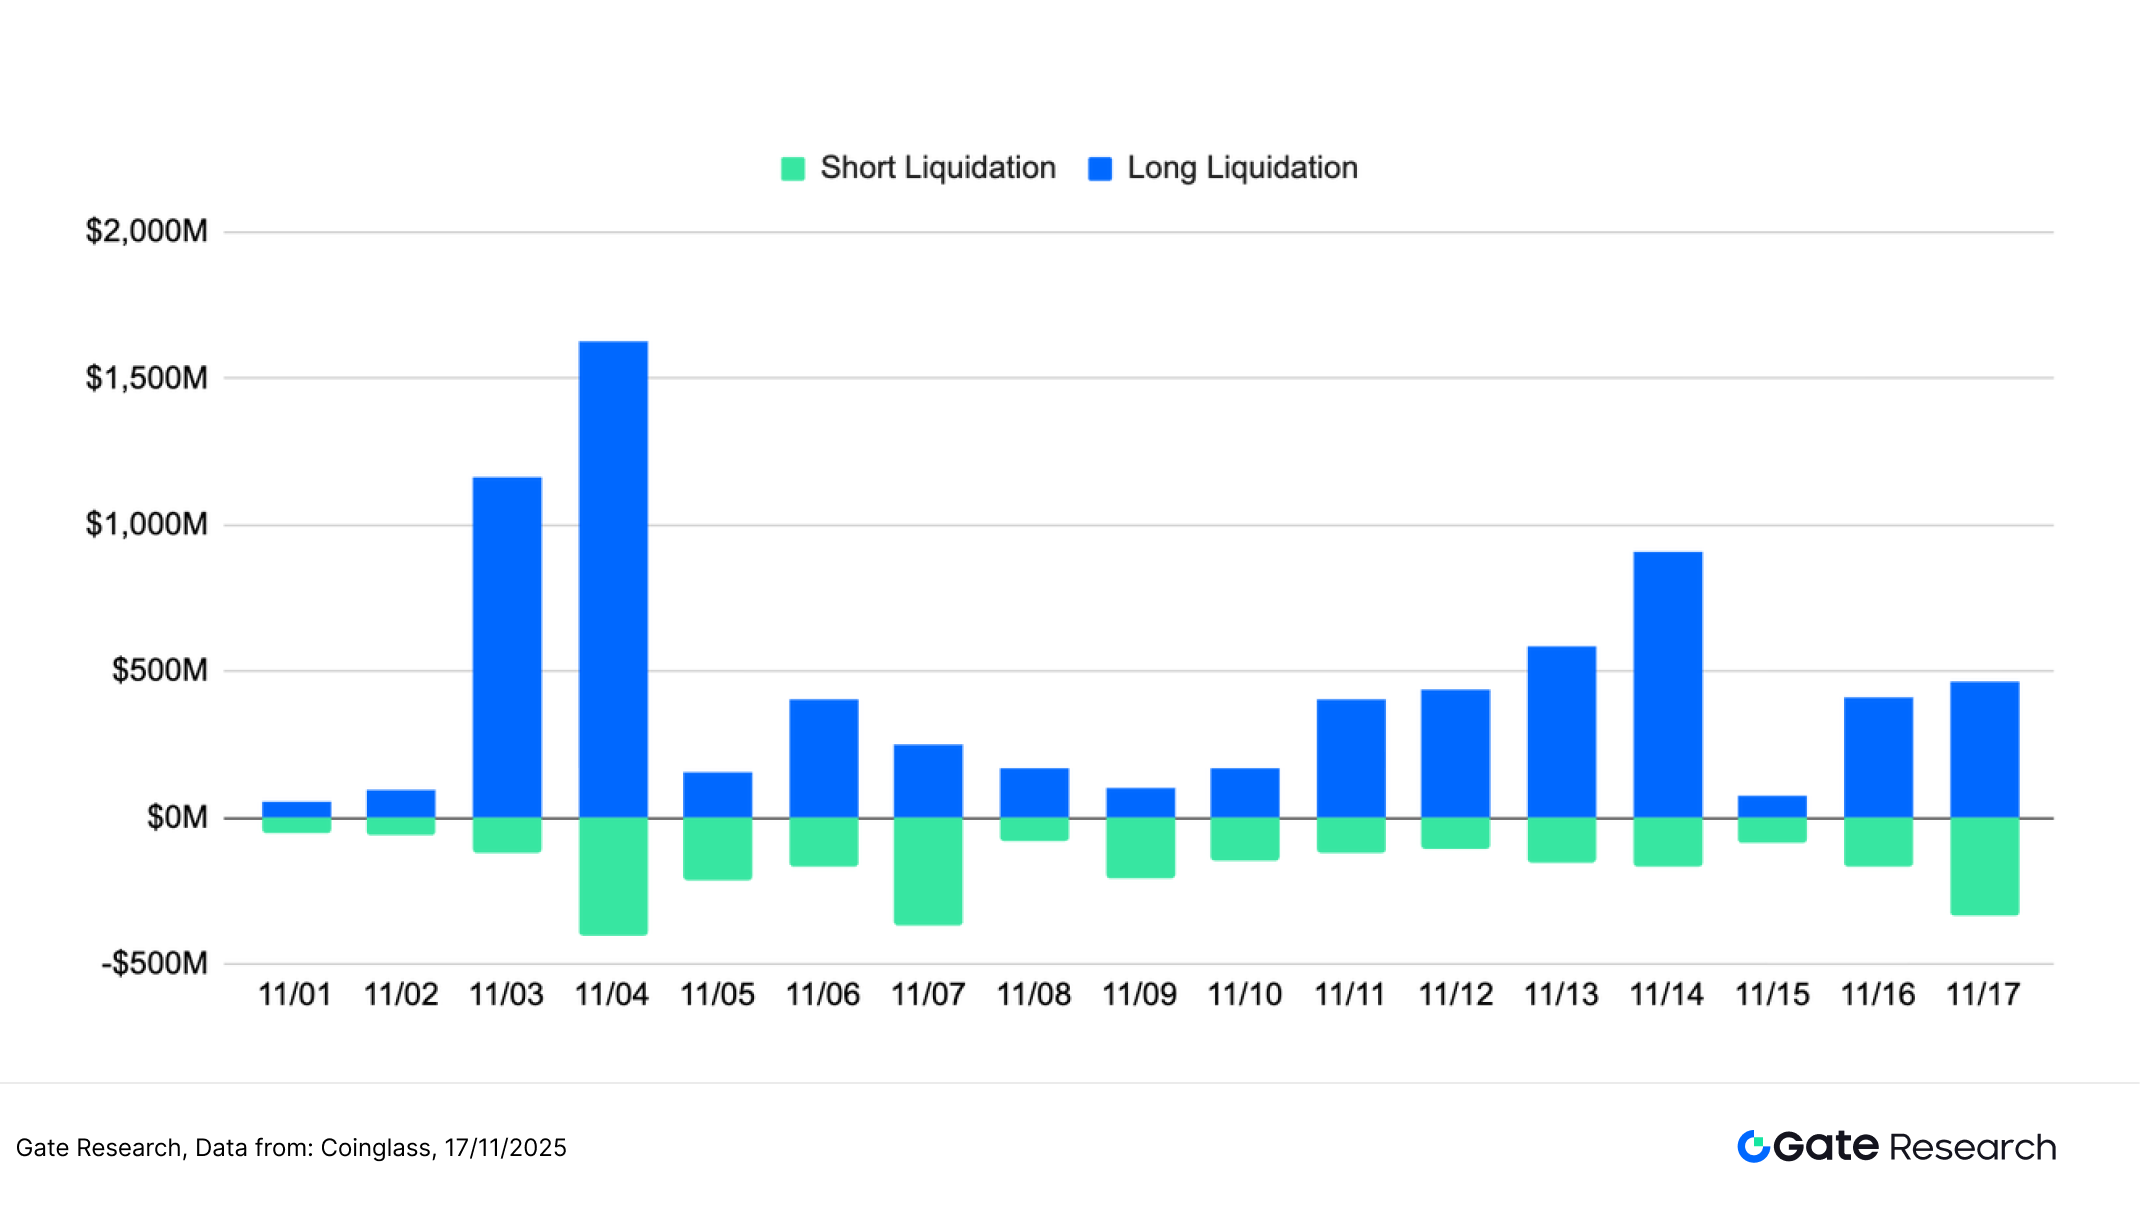
Against the backdrop of weak consolidation and continued price decline, overall capital behavior in the crypto market remains cautious, with a distinctly neutral-to-bearish structure. In terms of price action, BTC and ETH have fallen steadily with limited rebound strength, and no signs of a trend reversal have emerged. Volatility has repeatedly spiked, indicating fragile sentiment and heightened sensitivity to key price levels. The long–short ratio continues to oscillate around 1 with rapid shifts, showing indecisive directional positioning. After significant deleveraging at the end of October, futures open interest remains depressed, indicating that leveraged capital has not re-entered. Funding rates also fluctuate sharply around zero with frequent positive–negative flips, highlighting the lack of market consensus. Meanwhile, liquidations remain dominated by long positions, showing that downward pressure is still not fully digested.
In this structural context, market sentiment has not deteriorated systemically, but short-term support has weakened noticeably, limiting trend extension. The lack of directional momentum, weakened leverage structure, and repeated sentiment swings all indicate that the current market environment resembles a “trendless, weak-rebound consolidation phase.” In an environment where long–short sentiment diverges and leverage continues to contract at the margin, successful trading increasingly depends on accurately identifying trend shifts and volatility patterns.
The following section will focus on the empirical performance of the Moving Average Trend Breakout Strategy during phases of weak consolidation and trend transitions. We will evaluate its ability to capture structural breakouts, filter short-term noise, enhance risk-control efficiency, and reduce emotional chasing-and-selling behaviors, as well as assess its stability and applicability across different market rhythms.
Quantitative Analysis – Moving Average Trend Breakout Strategy
(Disclaimer: All forecasts in this article are based on historical data and market trends and are for informational purposes only. They should not be considered investment advice or a guarantee of future market performance. Investors should carefully assess risks and make prudent decisions when engaging in related investments.)
1. Strategy Overview
The Moving Average Trend Breakout Strategy is a medium-to-short-term trading approach based on trend identification through moving-average crossovers and price dynamics. By combining Simple Moving Averages (SMA) and Exponential Moving Averages (EMA), the strategy monitors directional changes in price trends, using short-term moving averages crossing above or below long-term moving averages as entry and exit signals. In addition, the strategy incorporates dynamic stop-loss and take-profit mechanisms to lock in gains or limit losses, making it suitable for choppy markets with embedded trend structures.
2. Core Parameter Settings
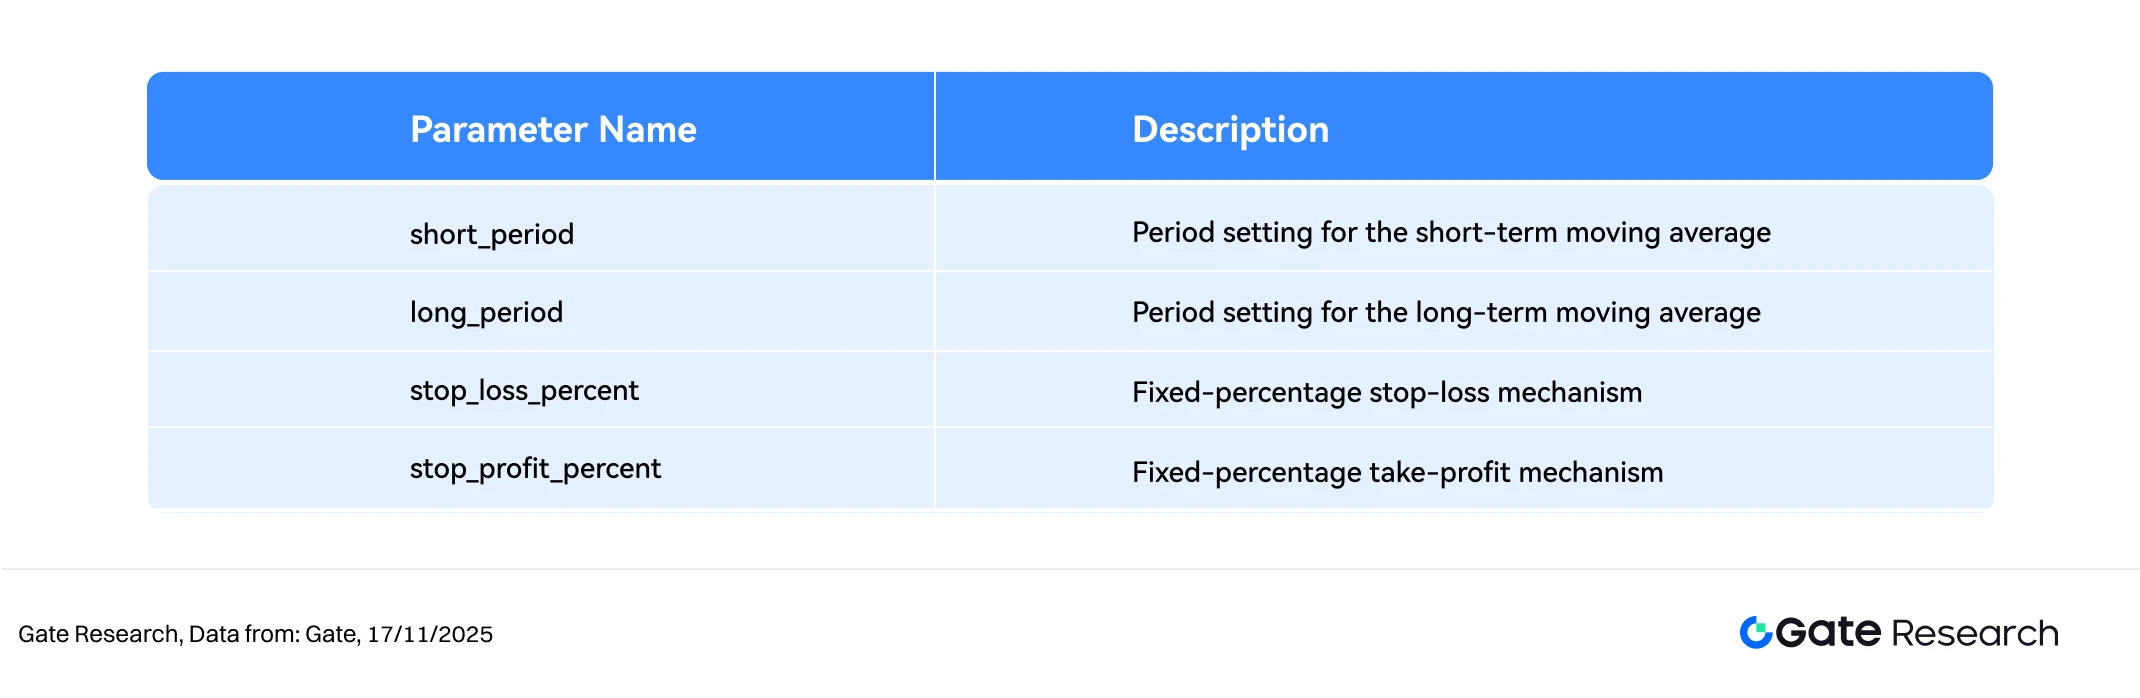
3. Strategy Logic and Operational Mechanism
Entry Conditions
- When there is no existing position, a buy signal is generated when the short-term moving average crosses above the long-term moving average.
Exit Conditions
- Short-term MA crossing below long-term MA: When the short-term moving average falls below the long-term moving average, the trend is considered weakening, triggering a close-position signal.
- Stop-loss exit: If price declines to
entry_price× (1 –stop_loss_percent), a forced stop-loss is triggered. - Take-profit exit: If price rises to
entry_price× (1 +take_profit_percent), a take-profit exit is triggered.
Practical Example Chart
- Trading Signal Triggered
The chart below shows the most recent entry signal generated by the strategy on June 3, 2025, using the XRP/USDT 4-hour candlestick chart. After a brief pullback, a technical reversal signal appeared in the early hours of June 3: the short-term MA5 began crossing above the mid-to-long-term MA10, the MACD fast and slow lines formed a bullish crossover, and trading volume rose simultaneously—indicating strengthening bullish momentum. The strategy initiated a long position at this point and successfully captured the subsequent upward movement, aligning well with the logic of a trend-following long strategy.
Figure 9: Example of the actual entry point triggered by the XRP/USDT strategy (June 3, 2025)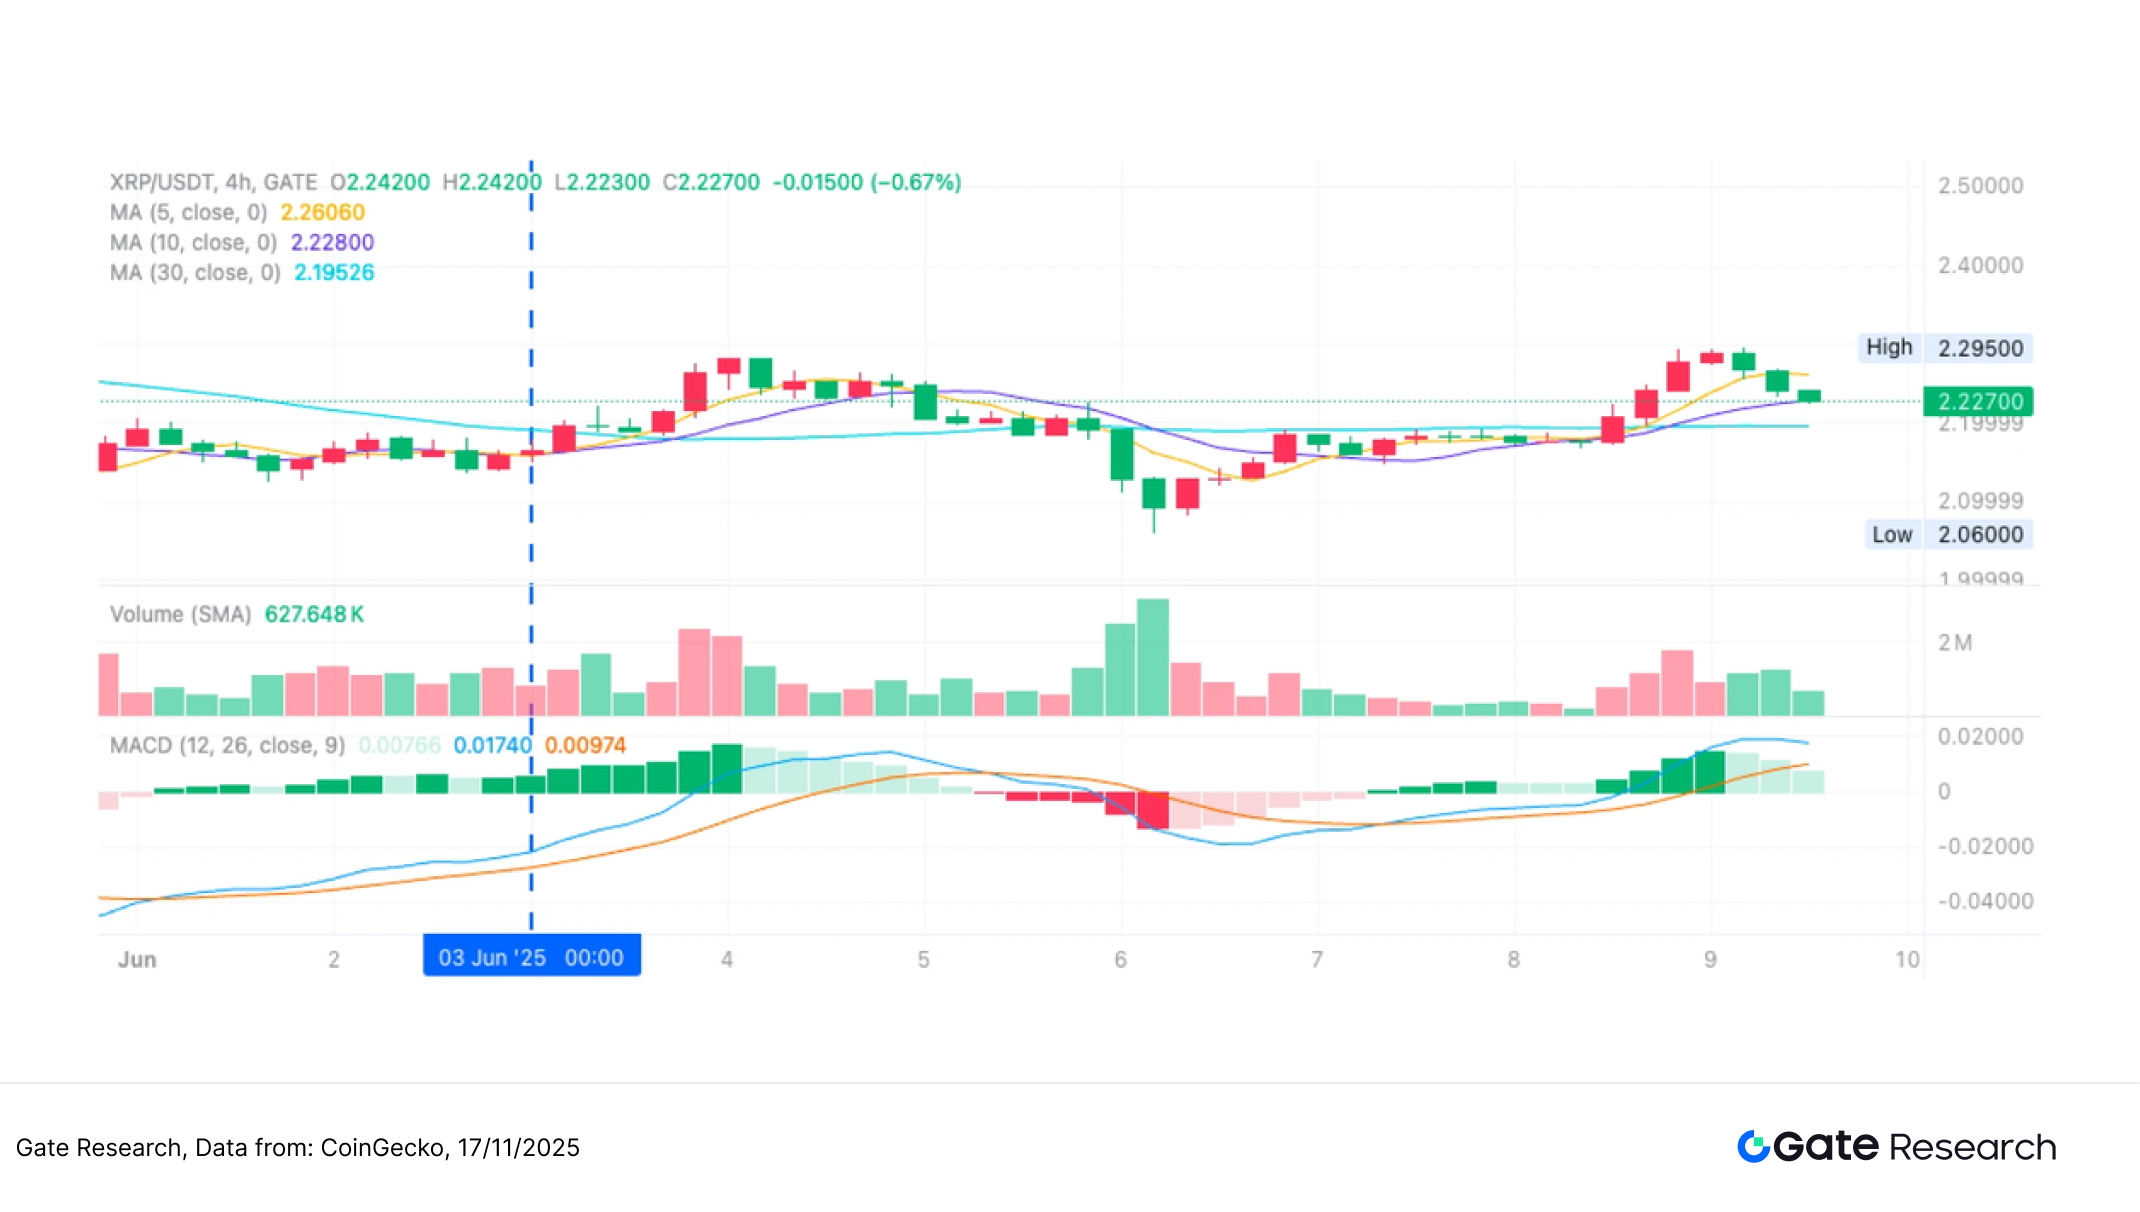
- Trading Action and Outcome
After a sustained upward move, XRP began showing signs of short-term exhaustion. A bearish MACD crossover formed, and the short-term moving averages started to turn downward. The strategy executed a sell operation at this point, successfully locking in the profits from the prior rebound. Although the subsequent price pullback was relatively mild, this exit aligned with the risk-management principle of trend-following strategies—“exit when momentum weakens.” This demonstrates strong discipline in swing-trading environments. In the future, incorporating dynamic take-profit rules or trend-tracking mechanisms may further enhance holding efficiency and expand overall profit potential.
Figure 10: Illustration of the XRP/USDT strategy exit point (June 5, 2025)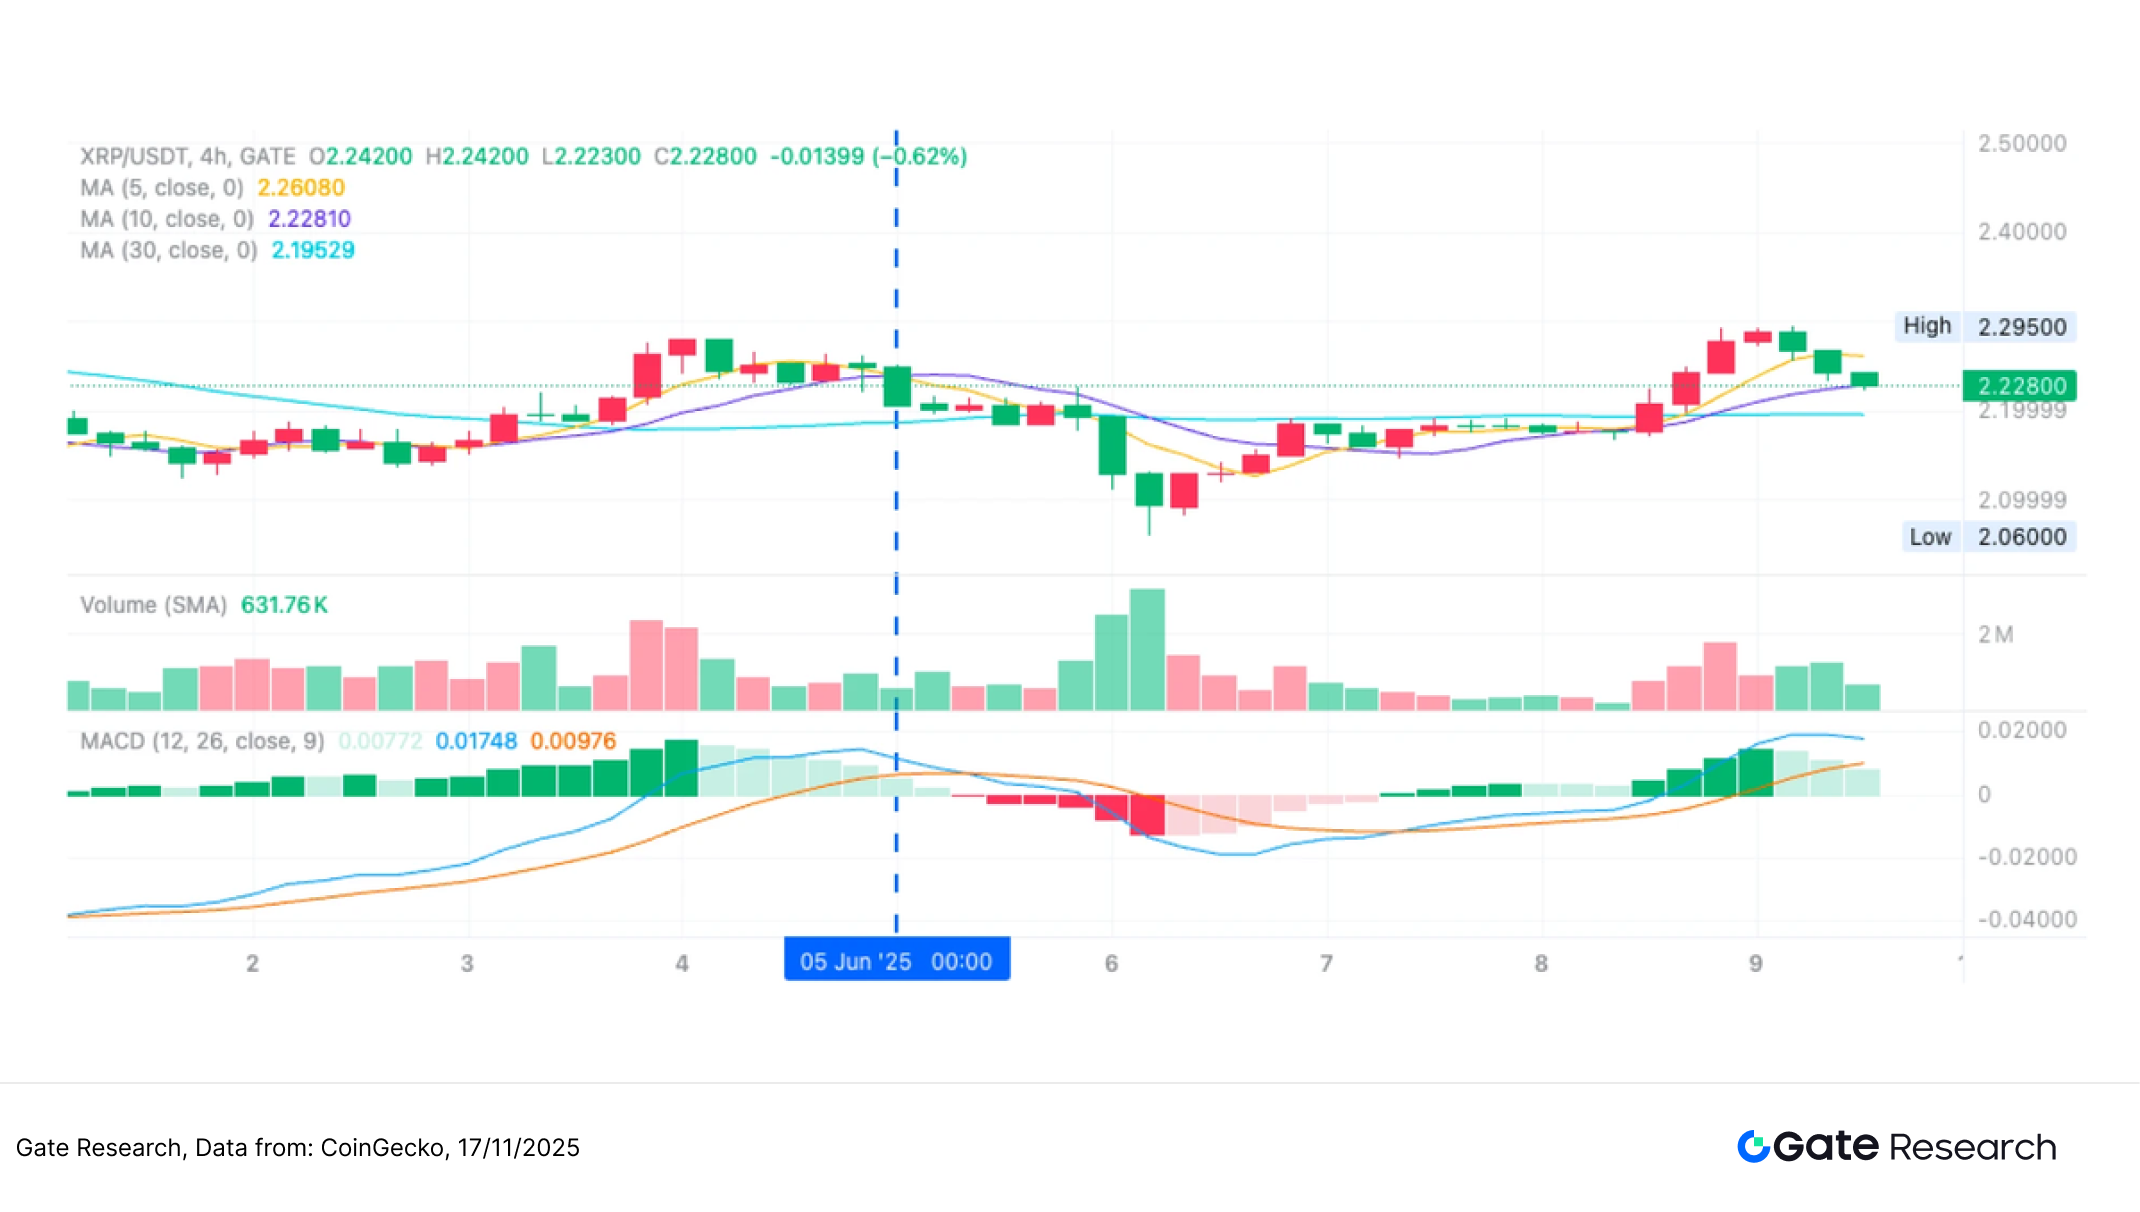
Through the above practical example, we clearly demonstrate how the trend-following strategy determines entry and exit points and applies dynamic risk control as price momentum shifts. The strategy identifies trend direction using crossover signals between short-term and long-term moving averages. It enters when the short-term MA crosses above the long-term MA to capture upward momentum, and it exits promptly when the short-term MA crosses below or when momentum indicators weaken—effectively avoiding drawdown risk. While managing profit–loss volatility, the strategy succeeds in securing the majority of the trend’s profit segment.
This case not only validates the strategy’s operability and disciplined execution in real market conditions, but also shows its strong profit-holding capability and defensive characteristics in highly volatile environments. It provides a solid empirical foundation for further parameter optimization and cross-asset application in the future.
4. Practical Backtesting Example
Parameter Backtesting Setup
To identify the optimal parameter combinations, we conducted a systematic grid search across the following ranges:
short_period: 2 to 10 (step size = 1)long_period: 10 to 20 (step size = 1)stop_loss_percent: 1% to 2% (step size = 0.5%)take_profit_percent: 10% to 16% (step size = 5%)
Using the top 10 crypto assets by market capitalization (excluding stablecoins) as the test universe, this study backtested 2-hour candlestick data from October 2024 to October 2025. A total of 891 parameter combinations were evaluated, and the ten best-performing sets—ranked by annualized return—were selected.
The evaluation metrics include annualized return, Sharpe ratio, maximum drawdown, and ROMAD (Return Over Maximum Drawdown), providing a comprehensive assessment of the strategy’s stability and risk-adjusted performance across different market conditions.
Figure 11: Performance comparison of the five best-performing parameter sets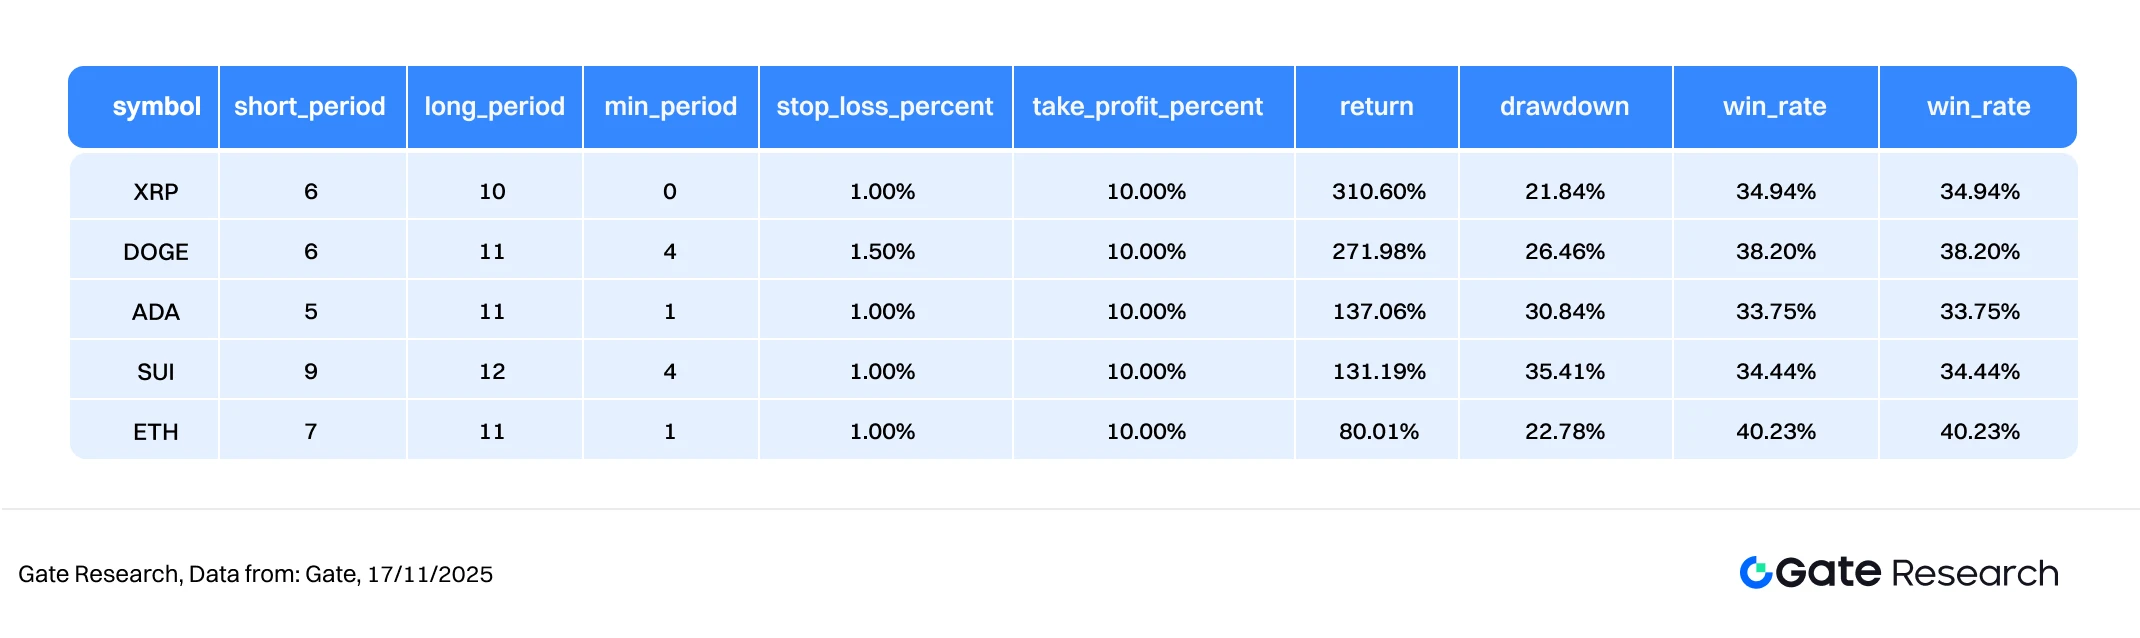
Strategy Logic Description
When the program detects that the short-term moving average crosses above the long-term moving average, it is interpreted as a trend initiation signal, triggering an immediate buy action. This structure aims to capture the early strengthening phase of a trend by identifying directional shifts through moving-average crossovers. Combined with dynamic take-profit and stop-loss rules, the strategy incorporates risk control at both ends. If the short-term MA subsequently crosses below the long-term MA, or if price reaches the predefined stop-loss or take-profit thresholds, the system automatically exits the position to ensure stable profit locking and risk mitigation.
Using XRP as an example, the strategy parameters are as follows:
short_period= 6 (short-term moving average period for tracking price movement)long_period= 10 (long-term moving average period for identifying trend direction)stop_loss_percent= 1%take_profit_percent= 10%
This logic combines trend-breakout signals with fixed-percentage risk-management rules. It is particularly well-suited to environments where market direction is clear and price swings form recognizable waves. The combination of trend-following and controlled drawdown improves trading stability and overall return quality.
Performance and Results Analysis
The backtest period covers October 2024 to November 2025. Based on the cumulative return trends, the Moving Average Trend Breakout Strategy shows differentiated performance across major and mid-cap crypto assets, but overall maintains a steady upward trajectory. Most of the five tested assets exhibit stepwise cumulative gains after long-entry signals, with XRP, DOGE, and ADA displaying the strongest performance—at one point reaching returns of approximately +250% to +330%. This demonstrates the strategy’s strong ability to capture upside momentum in outperforming sectors.
In comparison, SUI and ETH saw more moderate gains, yet still maintained stable upward trends. Both assets repeatedly recovered after market pullbacks and continued accumulating returns, indicating that the strategy retains trend-following capability even with different volatility characteristics. Observing the curves, most assets experienced accelerated rallies after breaking through key MA structures, while the strategy’s dynamic stop-loss mechanism helped preserve realized profits during periods of heightened volatility, resulting in smoother upward-sloping equity lines.
Overall, the strategy’s performance from late 2024 through 2025 demonstrates strong trend-capture ability and effective risk control. High-momentum assets amplified returns, while higher-volatility assets achieved moderate, stable accumulation—reducing the risk of large portfolio drawdowns driven by any single asset. These characteristics complement more market-neutral quantitative strategies (such as Gate Quant Fund), which focus on stable, low-volatility returns. Trend strategies provide alpha during directional or rotational phases, while neutral strategies offer long-term risk-controlled compounding.
Figure 12: One-Year Cumulative Return Comparison of the Five Best-Performing Strategies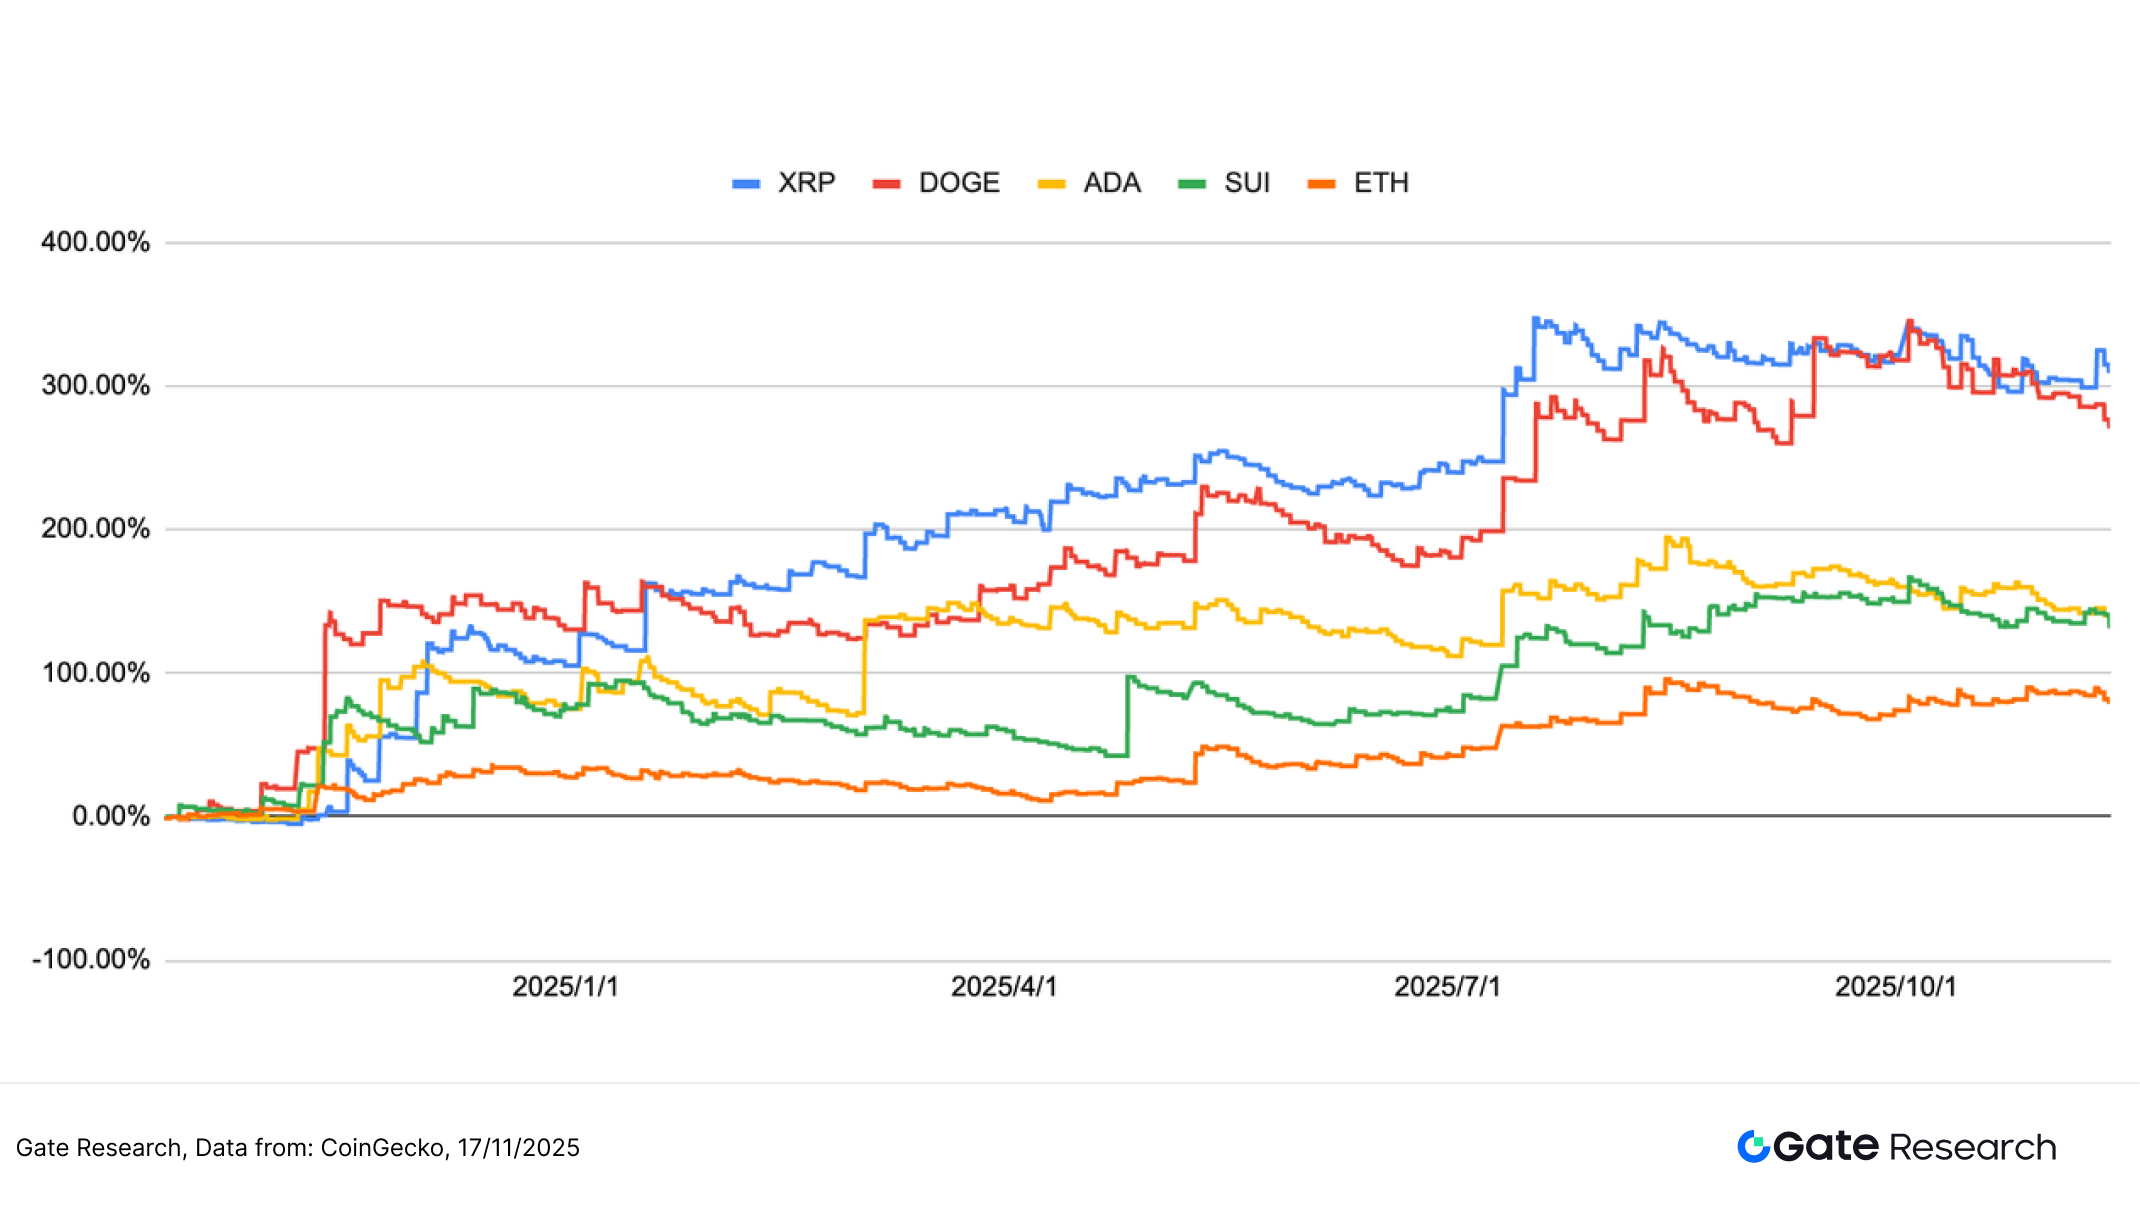
5. Strategy Summary
The Moving Average Trend Breakout Strategy uses short- and medium-term MA cross structures as the basis for trend determination. Combined with dynamic stop-loss and take-profit mechanisms, it delivers stable and scalable performance across a variety of mainstream crypto assets. Based on the past year’s results, XRP, DOGE, and ADA demonstrated strong stepwise gains after trend breakouts, with cumulative returns exceeding +250% to +330% at peak levels. SUI and ETH, while more moderate, also advanced steadily, illustrating the strategy’s ability to accumulate returns consistently across different volatility regimes.
Backtest results show that the strategy performs particularly well in markets with clear trend structures and noticeable capital rotation. It is able to protect gains during pullbacks, producing a smooth, steadily rising equity curve. However, in strong one-sided markets, the strategy may enter slightly late due to MA confirmation requirements or give back a portion of gains due to stop-loss retracements—resulting in performance that may lag high-beta assets.
From a long-term risk–return perspective, robust quantitative asset allocation requires not only the alpha generated by trend strategies but also the stability provided by lower-volatility, risk-controlled approaches. For example, Gate Quant Fund, anchored in market-neutral arbitrage and hedging strategies, enhances portfolio stability across market cycles. By maintaining strict risk controls, it targets long-term compounding with limited drawdowns. Compared with the higher volatility and more frequent rebalancing cycles of trend strategies, market-neutral strategies offer smoother return patterns and are better suited as core defensive holdings.
Conclusion
Between November 4 and November 17, 2025, the crypto market remained in a weak consolidation phase, with both capital flows and sentiment deteriorating. BTC and ETH continued to decline with limited rebounds, while volatility spiked repeatedly—indicating fragile sentiment and high sensitivity to key price levels. The long–short ratio fluctuated around 1, and funding rates oscillated rapidly around zero, reflecting weak long-side conviction and a lack of directional alignment in short-term sentiment.
In derivatives positioning, BTC and ETH open interest remained low after the significant deleveraging at the end of October, showing no signs of meaningful re-leveraging. The leverage ecosystem stayed in a “post-deleveraging observation” state. Liquidations were dominated by long positions, with short liquidations remaining limited—indicating that downward pressure had not yet been fully released. Overall, the market entered the later stage of weak consolidation, marked by alternating phases of structural cleansing and sentiment fluctuation. Without capital inflows or synchronized increases in volatility and trading volume, the market remains at risk of continued downside or another liquidation-driven selloff.
In this environment, the Moving Average Trend Breakout Strategy demonstrates promising real-world potential. Backtests show that strong assets such as XRP, DOGE, and ADA achieved significant trend-driven gains, reaching cumulative returns of +250% to +330%. ETH and SUI, while more moderate, still showed smooth upward accumulation—indicating the strategy’s consistency across different volatility conditions. Although the strategy may miss part of the rally in rapid one-sided markets due to signal confirmation or retracement stops, its performance can be enhanced through volatility filters, slope factors, or volume indicators to improve entry precision and adaptability.
By comparison, Gate Quant Fund, centered on market-neutral arbitrage and hedging, provides low drawdown and stable compounding through diversified allocation and strict risk management—offering a more balanced quantitative option for investors seeking steady returns. Together, the two approaches form a complementary structure, combining trend-driven alpha generation with stable defensive positioning.
References:
- CoinGecko, https://www.coingecko.com/
- Gate, https://www.gate.com/trade/BTC_USDT
- Gate, https://www.gate.com/trade/ETH_USDT
- Sosovalue, https://sosovalue.com/assets/etf/us-btc-spot?from=moved
- Coinglass, https://www.coinglass.com/LongShortRatio
- Coinglass, https://www.coinglass.com/BitcoinOpenInterest?utm_source=chatgpt.com
- Gate, https://www.gate.com/futures_market_info/BTC_USD/capital_rate_history
- Gate, https://www.gate.com/futures/introduction/funding-rate-history?from=USDT-M&contract=ETH_USDT
- Coinglass, https://www.coinglass.com/pro/futures/Liquidations
- Gate, https://www.gate.com/institution/quant-fund
Gate Research is a comprehensive blockchain and cryptocurrency research platform that provides deep content for readers, including technical analysis, market insights, industry research, trend forecasting, and macroeconomic policy analysis.
Disclaimer
Investing in cryptocurrency markets involves high risk. Users are advised to conduct their own research and fully understand the nature of the assets and products before making any investment decisions. Gate is not responsible for any losses or damages arising from such decisions.
Share


Related Articles

Reflections on Ethereum Governance Following the 3074 Saga

Gate Research: 2024 Cryptocurrency Market Review and 2025 Trend Forecast

Perpetual Contract Funding Rate Arbitrage Strategy in 2025

Gate Research: BTC Breaks $100K Milestone, November Crypto Trading Volume Exceeds $10 Trillion For First Time

NFTs and Memecoins in Last vs Current Bull Markets
