The price of Pi Coin (PI) is currently fluctuating around the threshold of 0.188 USD after several sessions of sideways accumulation in a contracted range. However, the 8-hour chart is reflecting a similar cash flow structure to the period before the market recorded a strong increase of 76% earlier this month.
During the period from February 28 to March 4, the price moved within a narrow range while institutional cash flow significantly increased, triggering a notable breakout. Currently, three important technical signals indicate that the selling pressure in the current price area may be nearing an end.
Cash flow shows signs of accumulation returning
The Chaikin Money Flow (CMF) indicator – a measure of buying and selling pressure by volume – has maintained an upward trend on the 8-hour chart since March 24, with the current value at 0.09, above the neutral threshold. This reflects that large cash flow is leaning towards net buying, despite the price volatility lacking a clear trend.
On the flip side, the Money Flow Index (MFI) continues to weaken to 37.51, indicating that retail cash flow remains cautious and has not confirmed the support zone.
This structure previously appeared in late February when the price moved sideways around 0.164 USD amidst rising CMF and falling MFI. When the MFI created a bottom and reversed upwards in phase with the CMF, the market triggered a strong acceleration.
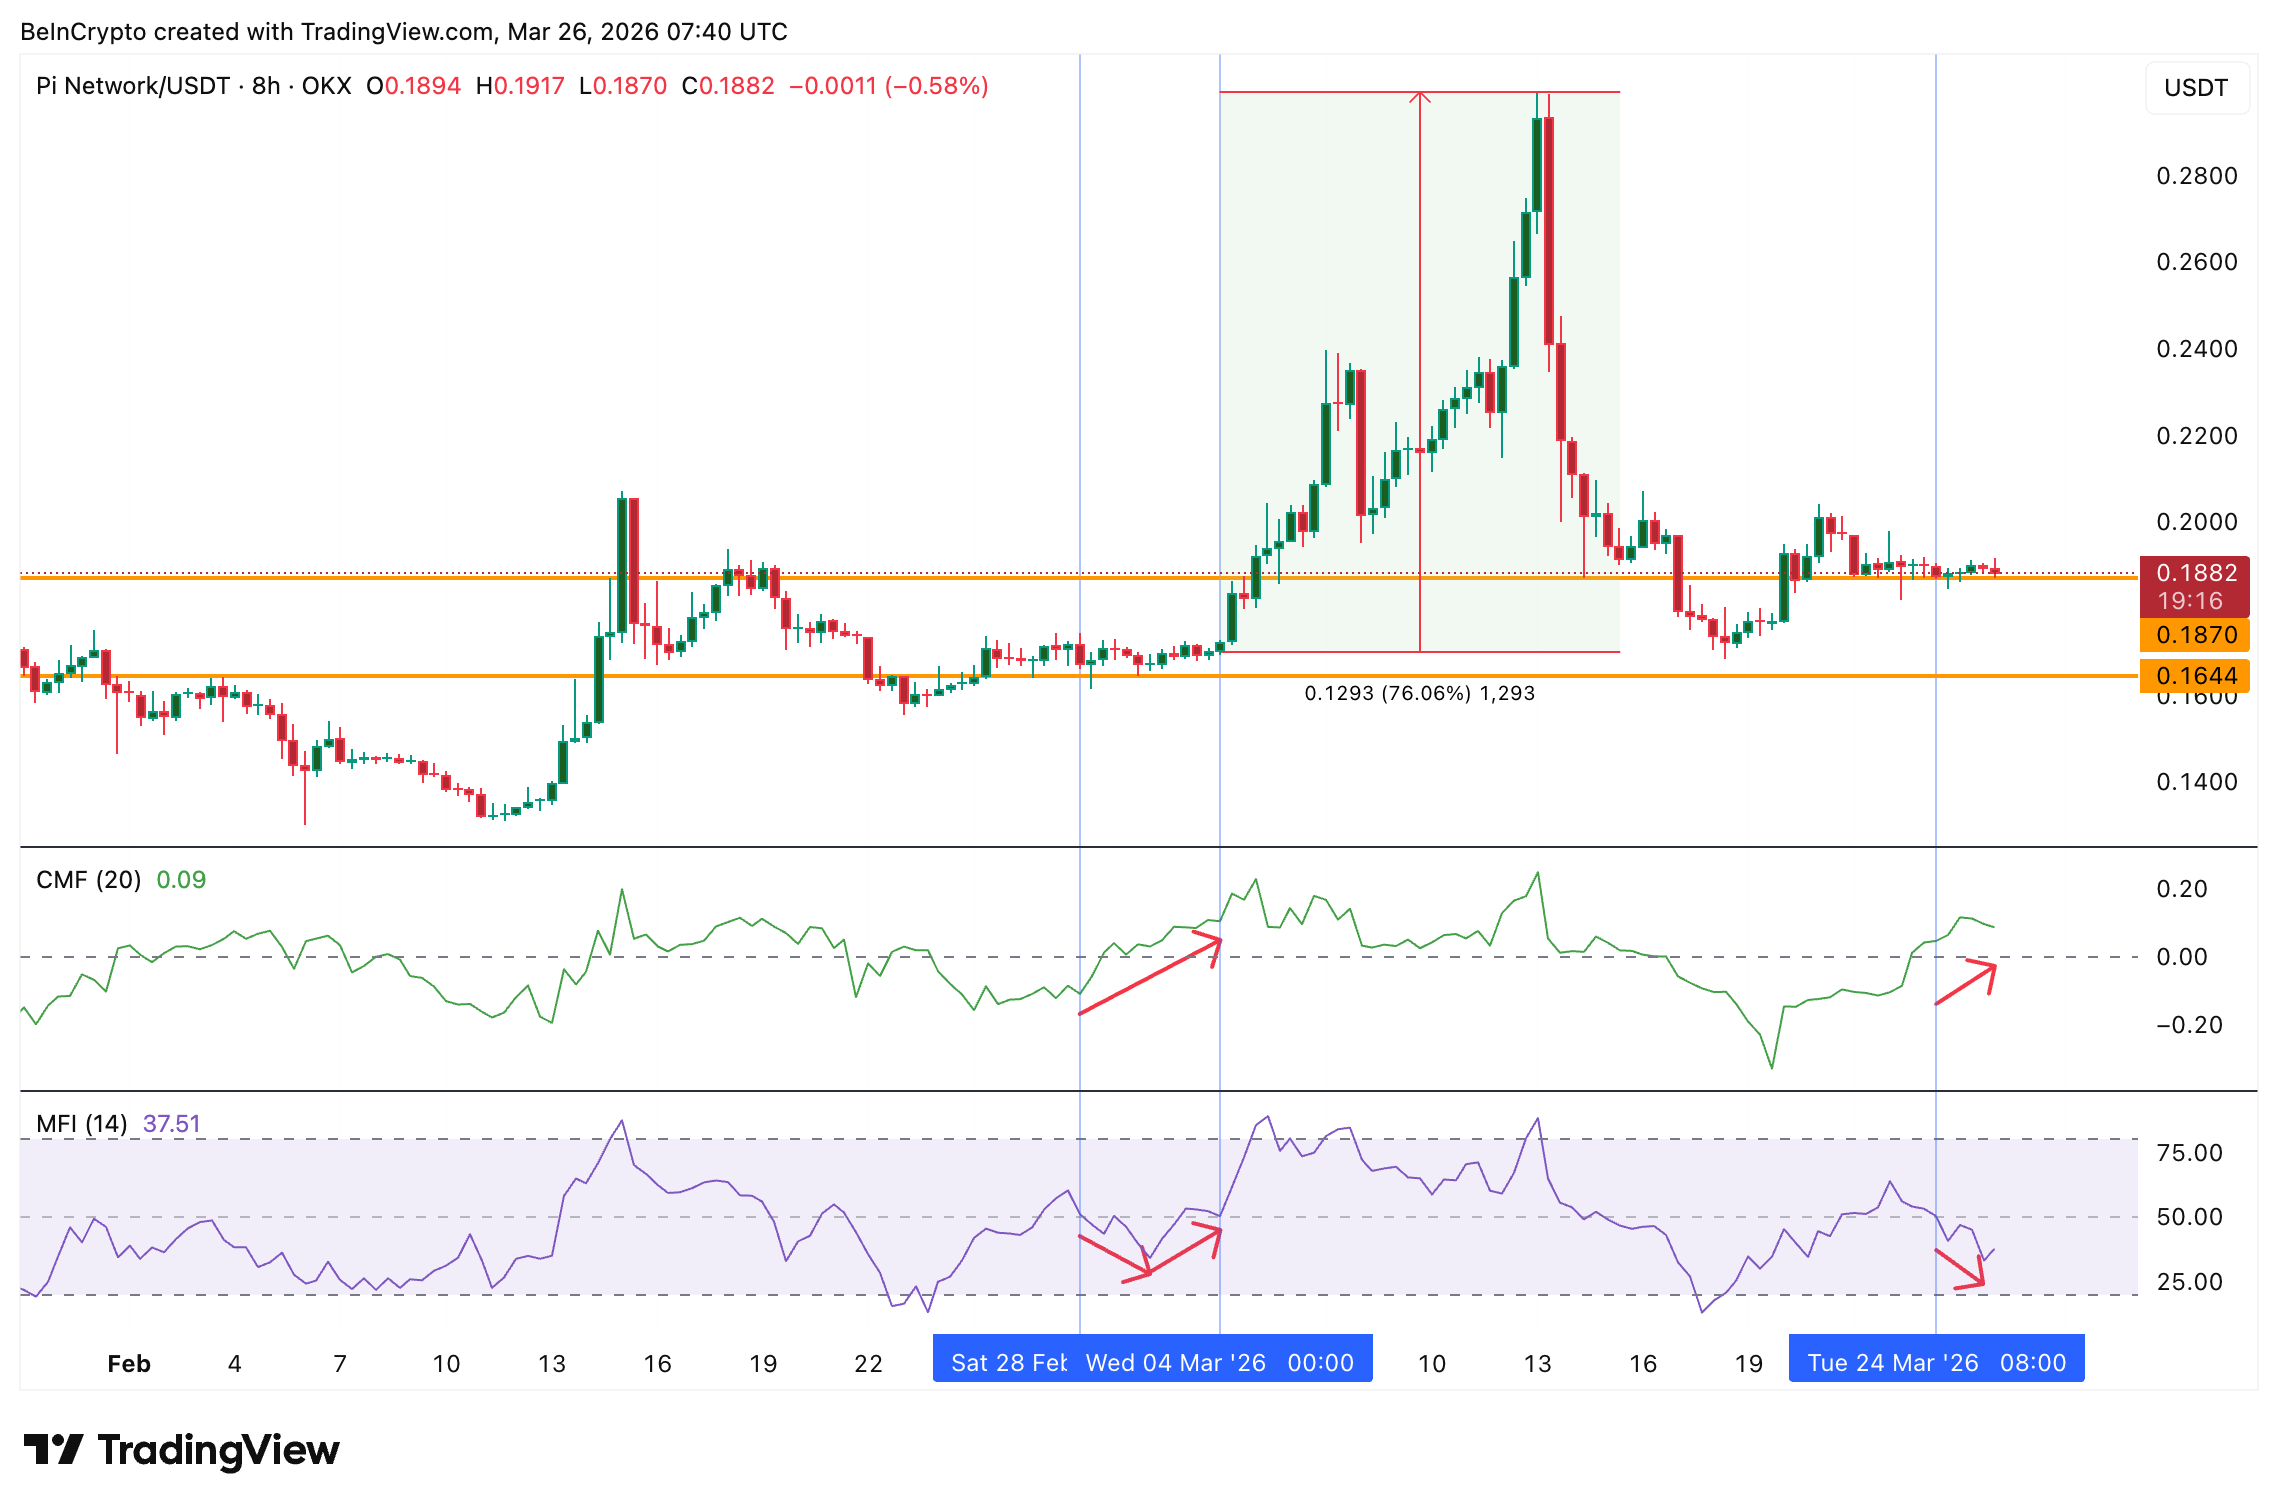 Set up CMF and MFI | Source: TradingViewA notable difference this time is that the CMF has early maintained above 0, indicating that the demand from large cash flow is stronger right from the accumulation phase. However, the MFI’s failure to confirm a bottom means that the signal still needs additional conditions to be fulfilled.
RSI divergence strengthens the potential for a bottom
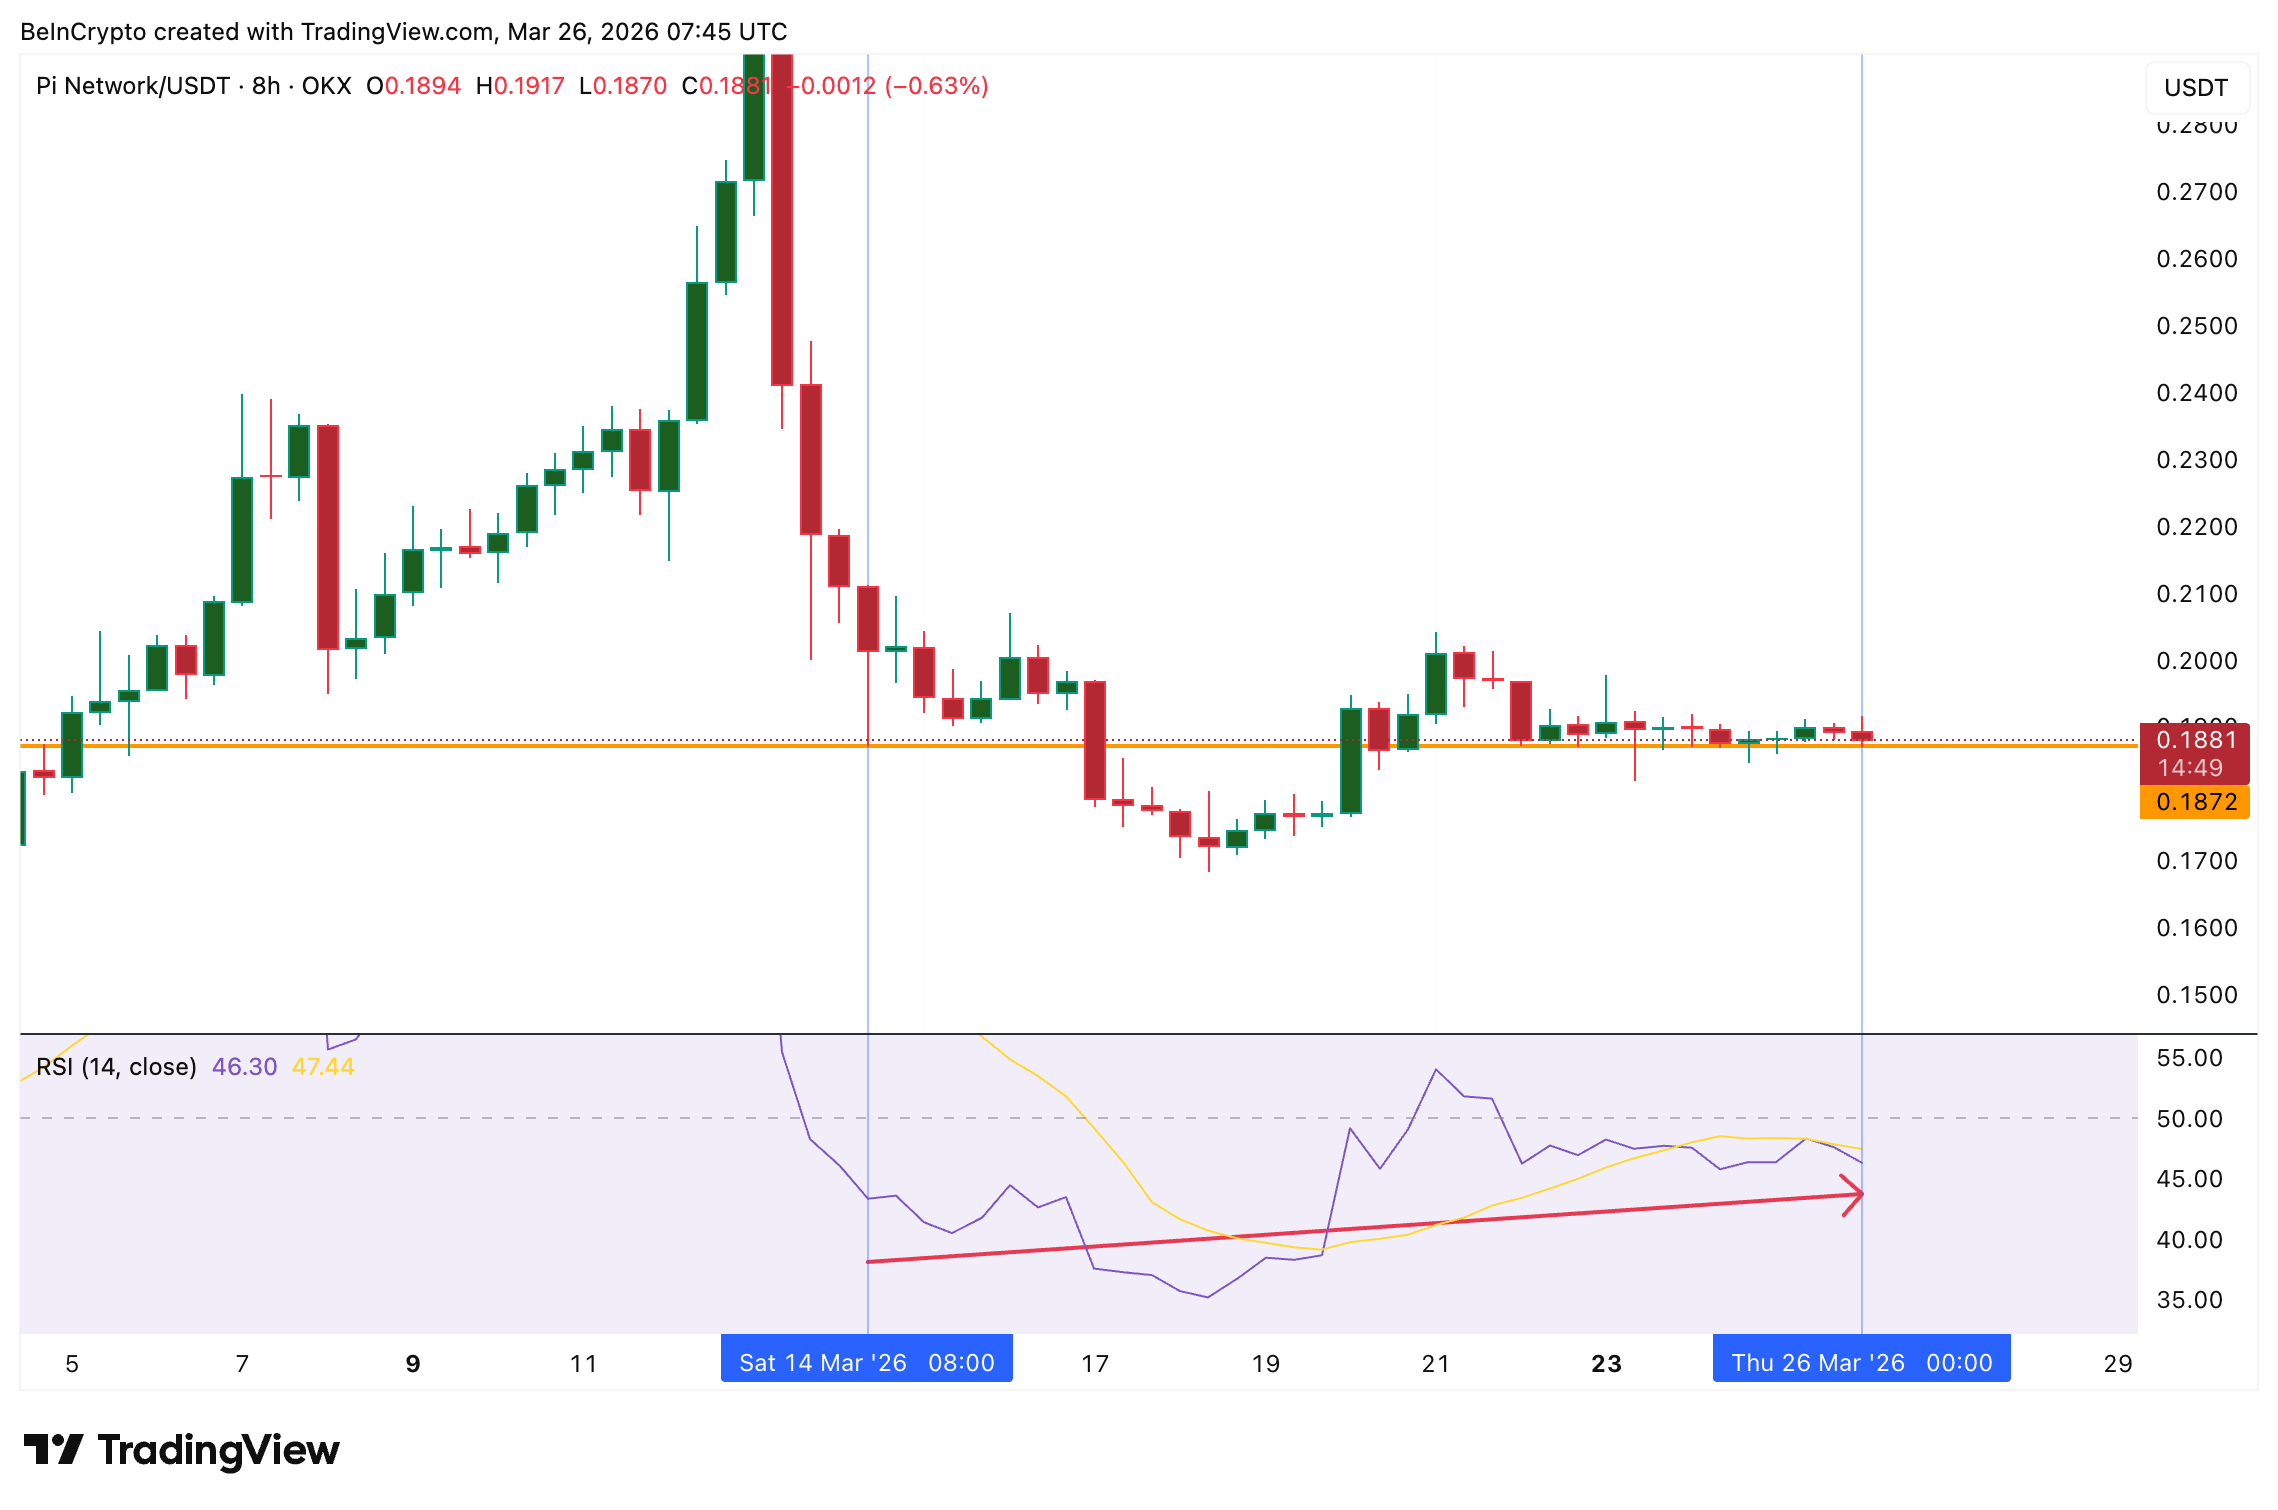
From March 14 to March 26, the price of Pi Coin tested the 0.187 USD area twice, forming a double bottom pattern on the 8-hour chart. At the same time, the RSI indicator recorded a higher low after the previous low, creating a bullish divergence – a signal that selling pressure is gradually weakening.
This divergence is still in the process of completion and requires an 8-hour candle to close higher to confirm the short-term bottom.
 Bullish divergence of RSI | Source: TradingViewNotably, the 20-period EMA just crossed below the 200-period EMA at the 0.190 USD area. Bearish crossovers occurring right at the bottom often associate with a state of “selling exhaustion,” when selling pressure finally withdraws from the market, paving the way for a potential reversal.
The convergence of the two EMA lines at the same price level also creates a pivotal resistance-support zone. If the price decisively breaks above the 0.190 USD mark, the technical structure could shift towards a more positive direction.
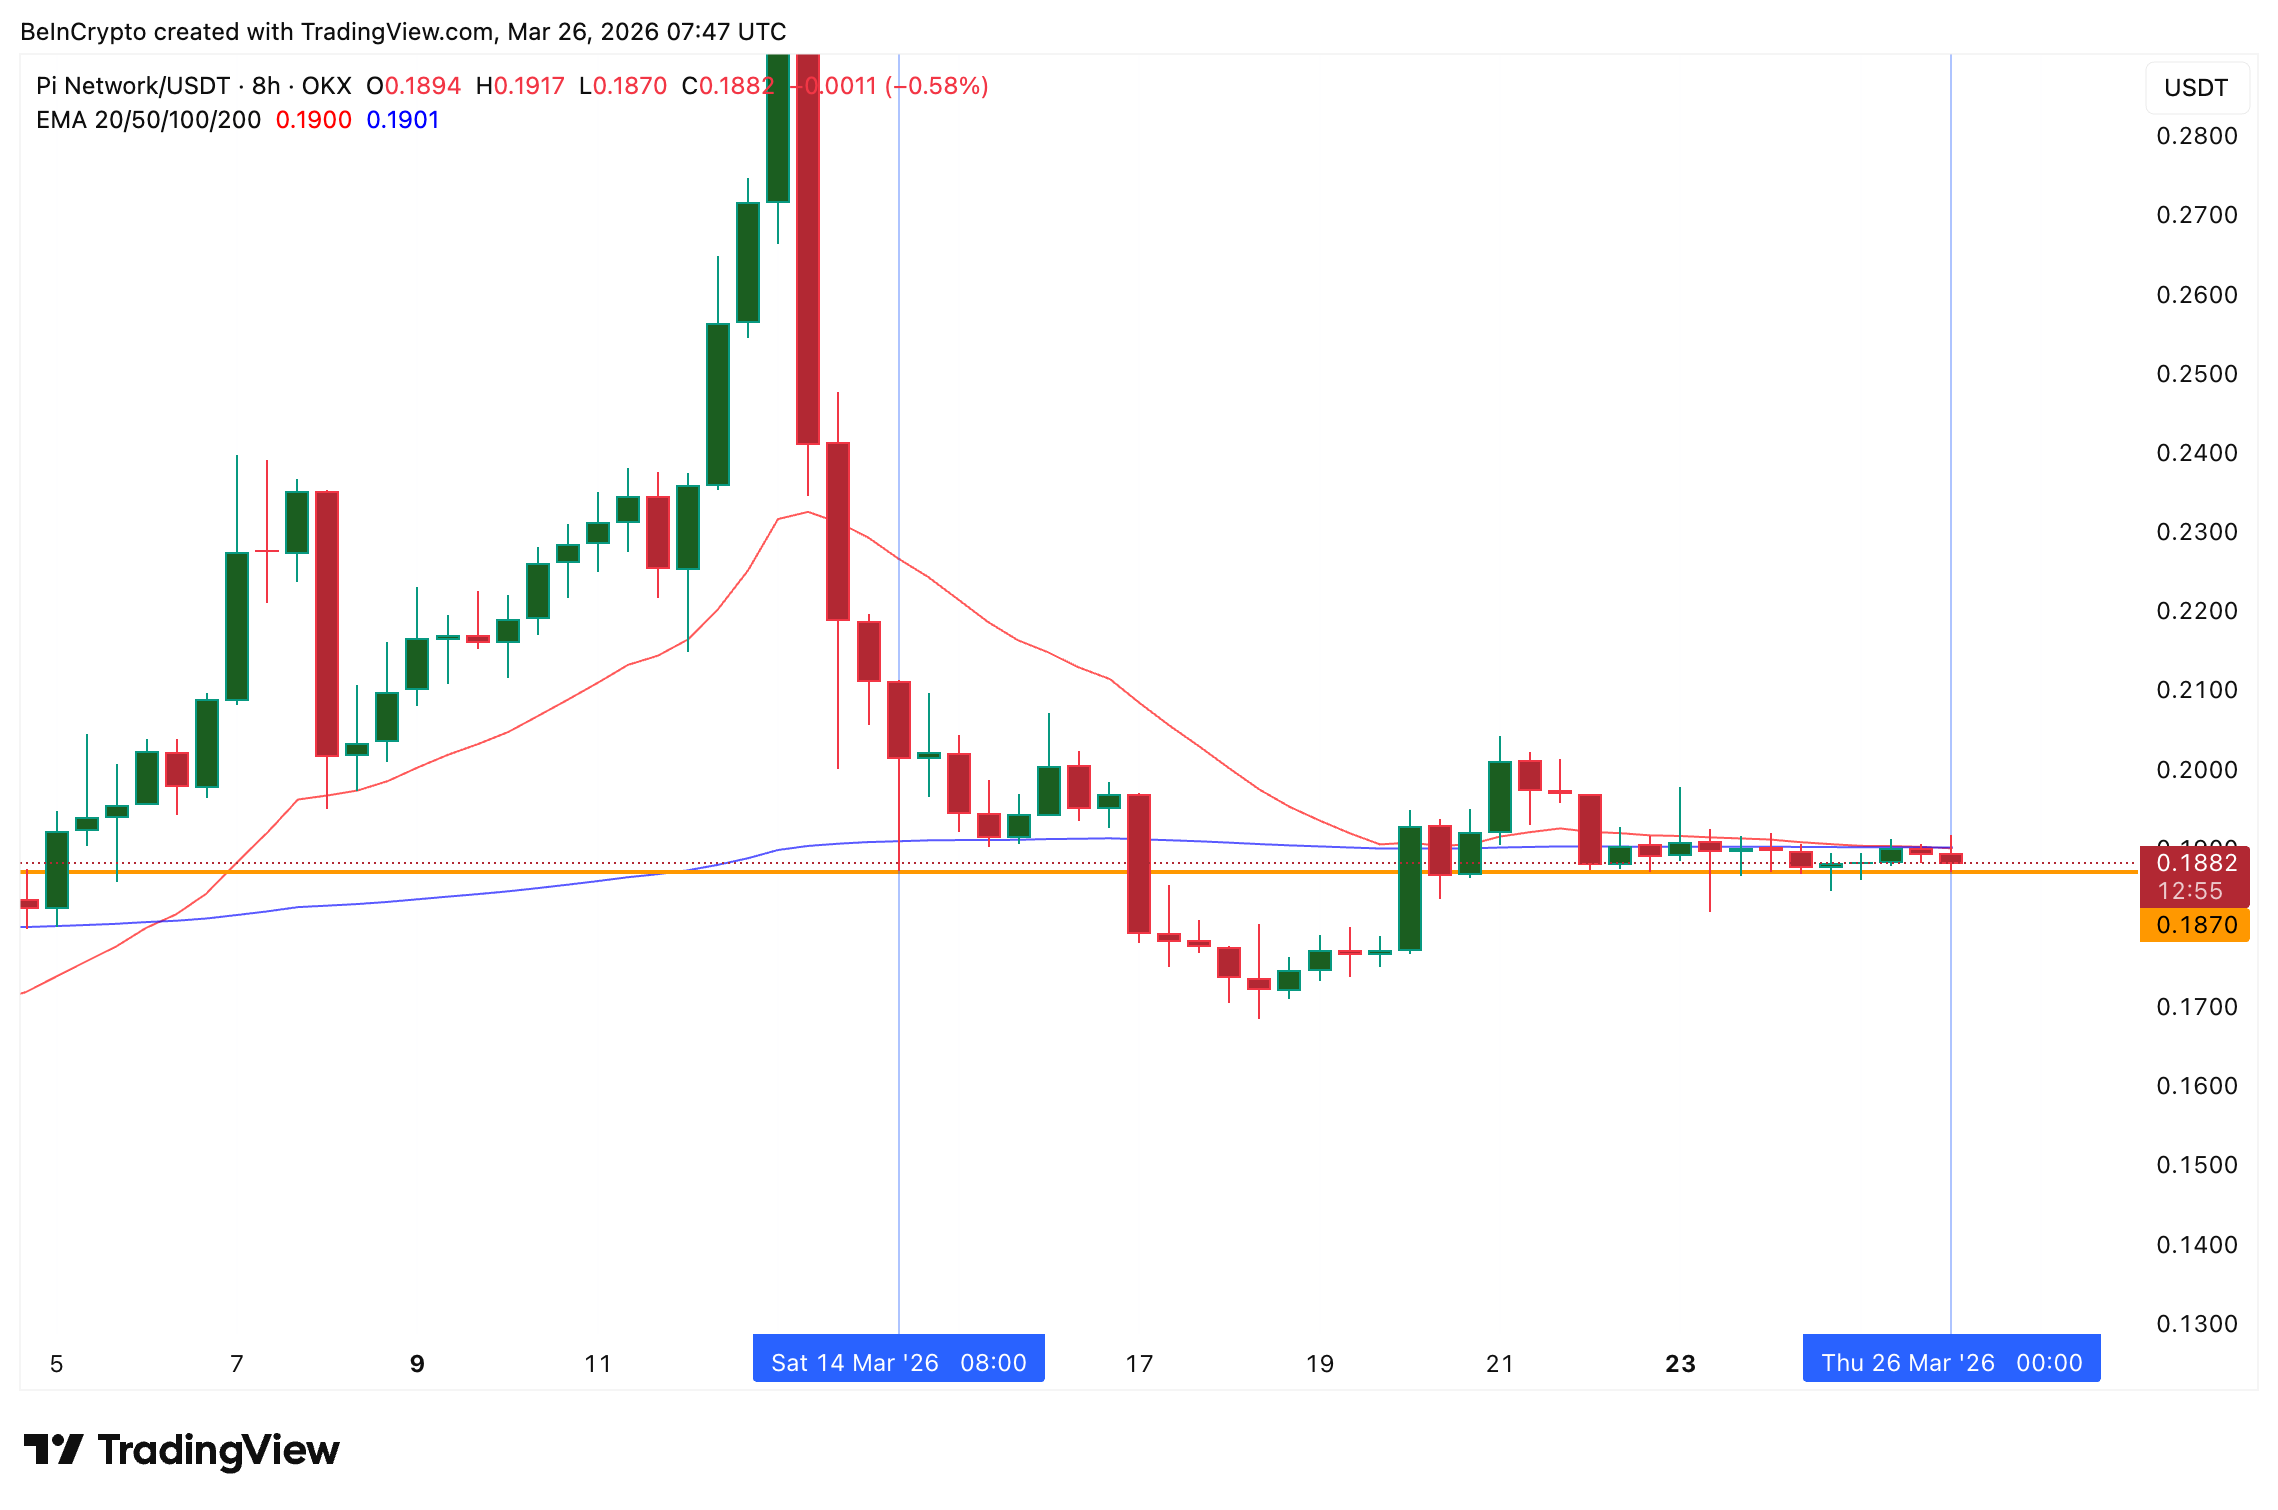 PI line crossing EMA | Source: TradingViewWhen combining the RSI divergence, the CMF remaining positive, and the EMA crossover signal being completed, the market is approaching a relatively clear confirmation cluster for a bottoming.
Expectation to extend to 0.240 USD if the structure breaks
The 8-hour chart is currently forming an inverse head and shoulders pattern, with the right shoulder around 0.182 USD. The neckline coincides with the 0.5 Fibonacci level at 0.200 USD – simultaneously an important psychological zone.
A breakout and solid close above 0.200 USD will complete the pattern, thereby opening a target increase of about 20%, corresponding to a price range of 0.240 USD.
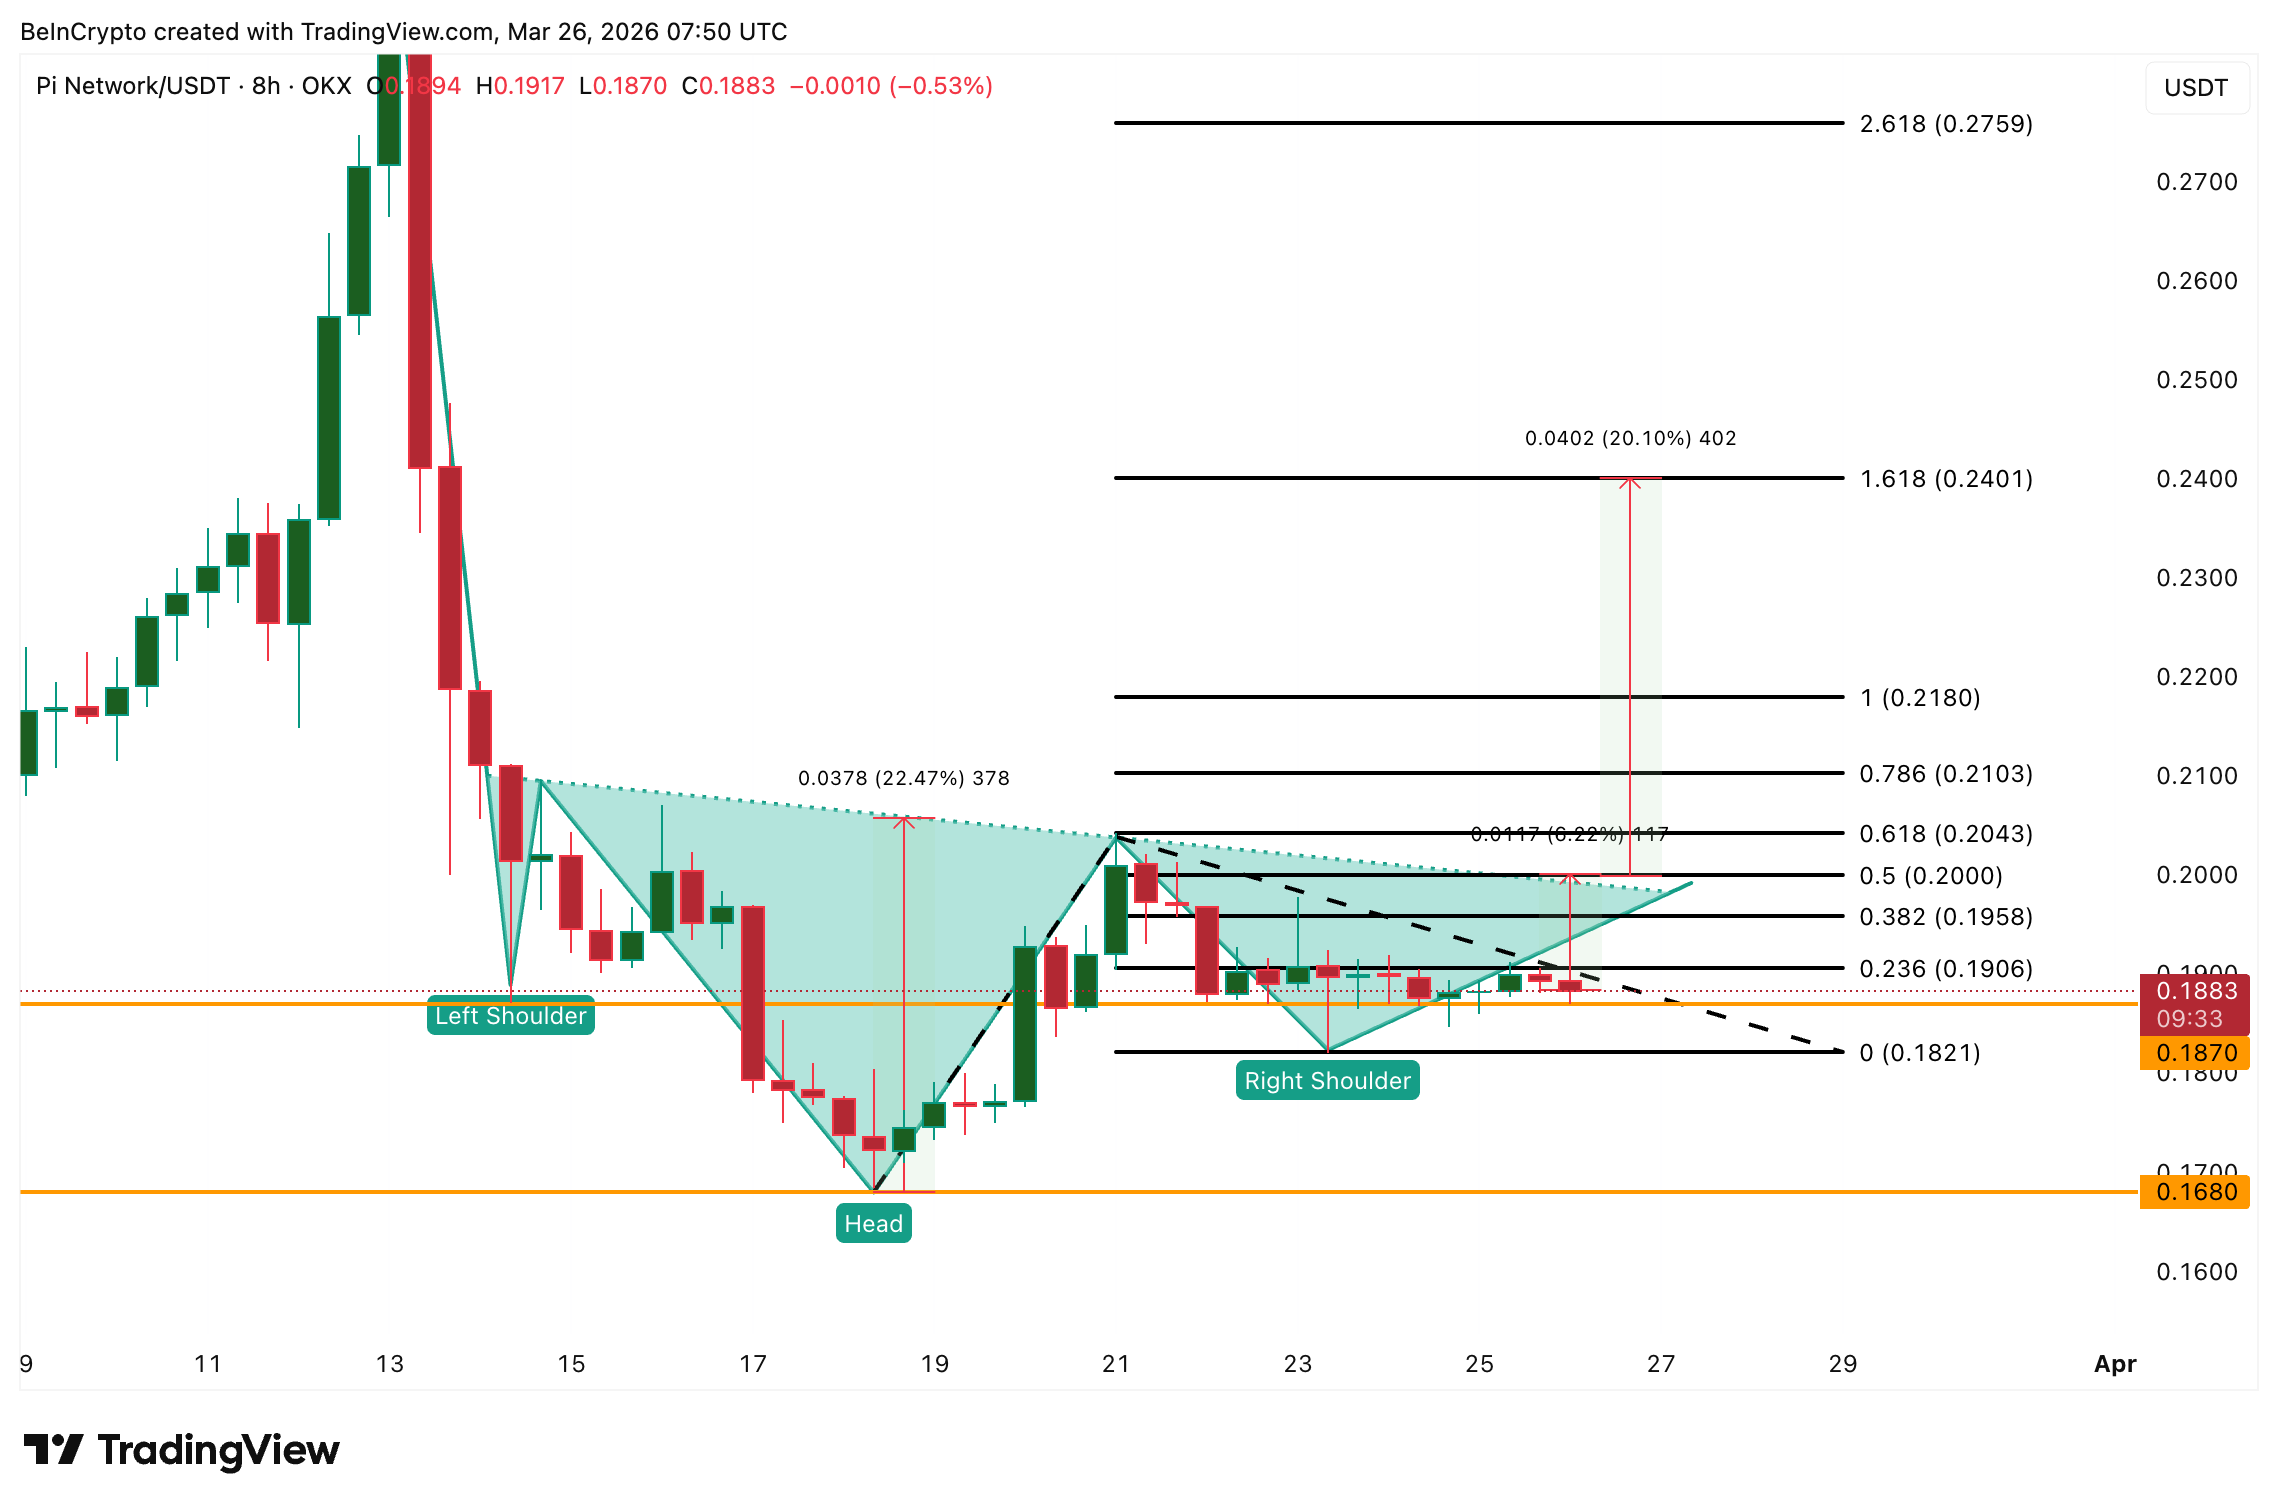 Price analysis of Pi Coin | Source: TradingViewPreviously, the 0.190 USD area – where the 20 EMA and 200 EMA converge – serves as the nearest resistance that needs to be surpassed. Upon successfully conquering this level, the Fibonacci levels of 0.210 USD and 0.218 USD will successively become intermediate targets.
On the downside, the 0.187 USD area remains a crucial support level. Losing this level will weaken the double bottom structure and the bullish divergence. However, the inverse head and shoulders pattern remains valid if the price stays above the 0.168 USD area. A drop below this threshold will completely negate the bullish scenario.
Overall, the market is nearing a decisive point: breaking above 0.200 USD will confirm the bottom and open up room for a rise to 0.240 USD, while dropping below 0.168 USD will trigger the risk of deeper correction.
Disclaimer: The information on this page may come from third parties and does not represent the views or opinions of Gate. The content displayed on this page is for reference only and does not constitute any financial, investment, or legal advice. Gate does not guarantee the accuracy or completeness of the information and shall not be liable for any losses arising from the use of this information. Virtual asset investments carry high risks and are subject to significant price volatility. You may lose all of your invested principal. Please fully understand the relevant risks and make prudent decisions based on your own financial situation and risk tolerance. For details, please refer to
Disclaimer.
Related Articles
Pi Network founder May 7 discussed human identity verification in the AI era at Consensus 2026
Pi Network founder Nicolas Kokkalis will attend the Consensus 2026 conference in Miami on May 7, joining an expert panel to discuss online human identity verification issues in the age of artificial intelligence (AI). According to the official event schedule, this panel discussion will bring together experts in the fields of identity, privacy, and digital trust.
MarketWhisper4h ago
Pi Network issues a node upgrade warning: if you haven’t upgraded by April 27, you risk being disconnected
Pi Network has issued an official notice to node operators, requiring them to complete the mandatory upgrade of the agreement version 22.1 (v22.1) by April 27, 2026; otherwise, they face the risk of their nodes being cut off from network connectivity. According to a Pi Network announcement, this upgrade must be carried out in strict version order. Currently, the system is running on version 21.2; the next step is to upgrade to v22.1, and no versions may be skipped.
MarketWhisper04-20 06:51
Pi Network Requires Protocol 22 Upgrade by April 27 or Nodes Will Disconnect
Pi Network mandates node operators to upgrade to Protocol 22 by April 27, 2026, to ensure network connectivity. The upgrade enhances stability and prepares for future smart contract features. Delaying could result in disconnection and missed opportunities.
GateNews04-20 05:51
Pi Network mainnet unlocks 5.3 million tokens, increasing circulation and drawing market attention
Pi Network completed a token unlock on April 18, releasing about 5.3 million Pi tokens, which boosts market liquidity, but also sparks discussion about supply-and-demand pressure. The unlocking plan is intended to control market supply and support ecosystem development. The long-term impact will depend on how quickly the token’s utility expands through real-world applications. If demand and supply can grow in step, the price impact will be limited; otherwise, it may face pressure.
MarketWhisper04-20 02:50
Pi Network Launches First Smart Contract Feature on Testnet, Enabling Subscription Payments
Pi Network has launched its first Smart Contract feature on Testnet, enabling users to set up automatic subscription payments while maintaining control of their funds. This marks a shift toward ecosystem utility and lays the groundwork for potential mainnet deployment.
GateNews04-18 05:31
