- TD Sequential flashes buy signal as Solana trades near $75–$80 support zone
- SOL remains in downtrend with lower highs despite short-term stabilization signs
- Resistance at $100 holds while RSI stays neutral and MACD shows weak momentum
Solana Rebound Hopes Rise After TD Sequential Issues a Buy Signal on $SOL Today.
The latest signal has attracted interest as price trades near a key support zone. Market participants are assessing whether this setup can support a short-term recovery.
TD Sequential Signal and Market Context
A TD Sequential buy signal has appeared on the daily chart for Solana. This indicator is often used to identify potential trend exhaustion points. Traders monitor it closely when price approaches strong support areas.
TD Sequential flashes a buy signal on Solana $SOL, suggesting a rebound. pic.twitter.com/NVwoeMgEXu
— Ali Charts (@alicharts) March 27, 2026
The signal comes as SOL trades near the $75 to $80 range. This zone has acted as support in recent sessions. The timing of the signal aligns with a period of slowing downside momentum.
Historical use of the indicator shows that such signals can mark a reaction zone.
However, they do not always indicate an immediate reversal. As one analyst noted, “the signal suggests a rebound zone, not a confirmed trend change.”
Trend Structure Remains Under Pressure
Solana continues to show a broader downtrend on the daily timeframe. Price has formed lower highs and lower lows since the peak near $260. This pattern reflects sustained selling pressure over time.
Recent price movement toward $80 to $85 represents a limited recovery. The structure has not shifted, as resistance levels remain intact. Sellers continue to defend higher price zones.
The absence of a higher high pattern keeps the trend unchanged. Until such a shift occurs, the market structure remains weak. Price action continues to reflect a corrective phase within a downtrend.
Key Levels Define Near-Term Direction
Support levels remain critical for the current setup. The $75 to $80 range is the immediate area being tested. A break below this zone may open a move toward $60 to $65.
The $50 level stands as a broader support area on the macro chart. It has served as a base during previous cycles. Market analysts often watch such levels during extended declines.
On the upside, resistance is seen near $100. This level aligns with a prior breakdown zone and psychological barrier. Above this, the $120 to $130 range represents a stronger supply area.
Momentum Indicators Show Early Stabilization
Momentum indicators reflect mixed conditions on the daily chart.
The Relative Strength Index is between 40 and 51, which suggests neutral momentum. It remains below levels typically associated with strong buying pressure.
The MACD indicator has turned slightly positive but remains near the zero line. This positioning indicates early stabilization rather than strong momentum.
The lack of expansion suggests limited follow-through so far.
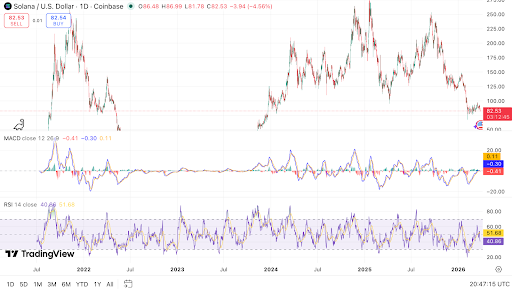
Solana tests support near $82, Source: TradingView
Solana tests support near $82, Source: TradingView
Price action shows consolidation after a sharp decline. Candles indicate reduced volatility, and this often appears before a directional move. Traders continue to monitor whether the current signal aligns with a sustained recovery.
Disclaimer: The information on this page may come from third parties and does not represent the views or opinions of Gate. The content displayed on this page is for reference only and does not constitute any financial, investment, or legal advice. Gate does not guarantee the accuracy or completeness of the information and shall not be liable for any losses arising from the use of this information. Virtual asset investments carry high risks and are subject to significant price volatility. You may lose all of your invested principal. Please fully understand the relevant risks and make prudent decisions based on your own financial situation and risk tolerance. For details, please refer to
Disclaimer.
Related Articles
Solana Adoption Surges to 167M While Usage and Price Diverge
Key Insights
Solana reached 167 million holders, signaling strong adoption growth even as active addresses declined, showing a widening gap between ownership and usage trends.
Institutional interest increased as DeFi Development Corp accumulated over 2.22 million SOL, reinforcing long-term c
CryptoNewsLand9h ago
Singapore Gulf Bank Launches Zero-Fee Stablecoin Service on Solana for Institutional Clients
Singapore Gulf Bank has introduced a stablecoin conversion service for corporate and high-net-worth clients, enabling zero-fee fiat-to-stablecoin transactions on the Solana network. It supports multiple blockchains and enhances liquidity management.
GateNews21h ago
XRP Goes Live on Solana as Official Wrapped Token
Ripple's XRP launched on Solana as a wrapped cross-chain asset on April 17, partnering with Hex Trust and others. This move, aimed at boosting liquidity and expanding access to Solana's DEX ecosystem, highlights Solana's growing role in cross-chain tokenization.
GateNews22h ago
Singapore Gulf Bank Launches Stablecoin Minting Service, Offering Zero Fees on Solana
Singapore Gulf Bank launched a stablecoin minting and redemption service for corporate clients, allowing conversions between fiat and USD stablecoins with no fees on Solana for transactions over $100,000. This aims to enhance cash flow and boost USDC adoption.
GateNews04-17 16:51
Bitcoin ETFs See Daily Outflow While Ethereum and Solana ETFs Post Gains on April 17
Gate News message, according to the April 17 update, Bitcoin ETFs recorded a 1-day net outflow of 142 BTC ($10.98M) and a 7-day net inflow of 7,093 BTC ($550.09M). Ethereum ETFs showed a 1-day net inflow of 22,357 ETH ($54.55M) and a 7-day net inflow of 89,684 ETH ($218.83M). Solana ETFs posted a 1-
GateNews04-17 15:54
Solana Targets $120 if Bulls Hold $87 Support; Technical Setup Shows Cup-and-Handle Pattern
Solana (SOL) is trading at $88.87, with a daily gain of 3.84%. Analysts indicate that maintaining support above $87 is crucial to potentially reach $120. Liquidation clusters influence price action, and a breakout above $107 could confirm upward momentum.
GateNews04-17 14:22
