【Bitcoin Ascending Flag Pattern Formed, Rebound Target Points to 79660?】
BTC has been experiencing frequent whipsaws in smaller timeframes due to Middle East geopolitical influences, so we need to increase the cycle duration to better observe the market.
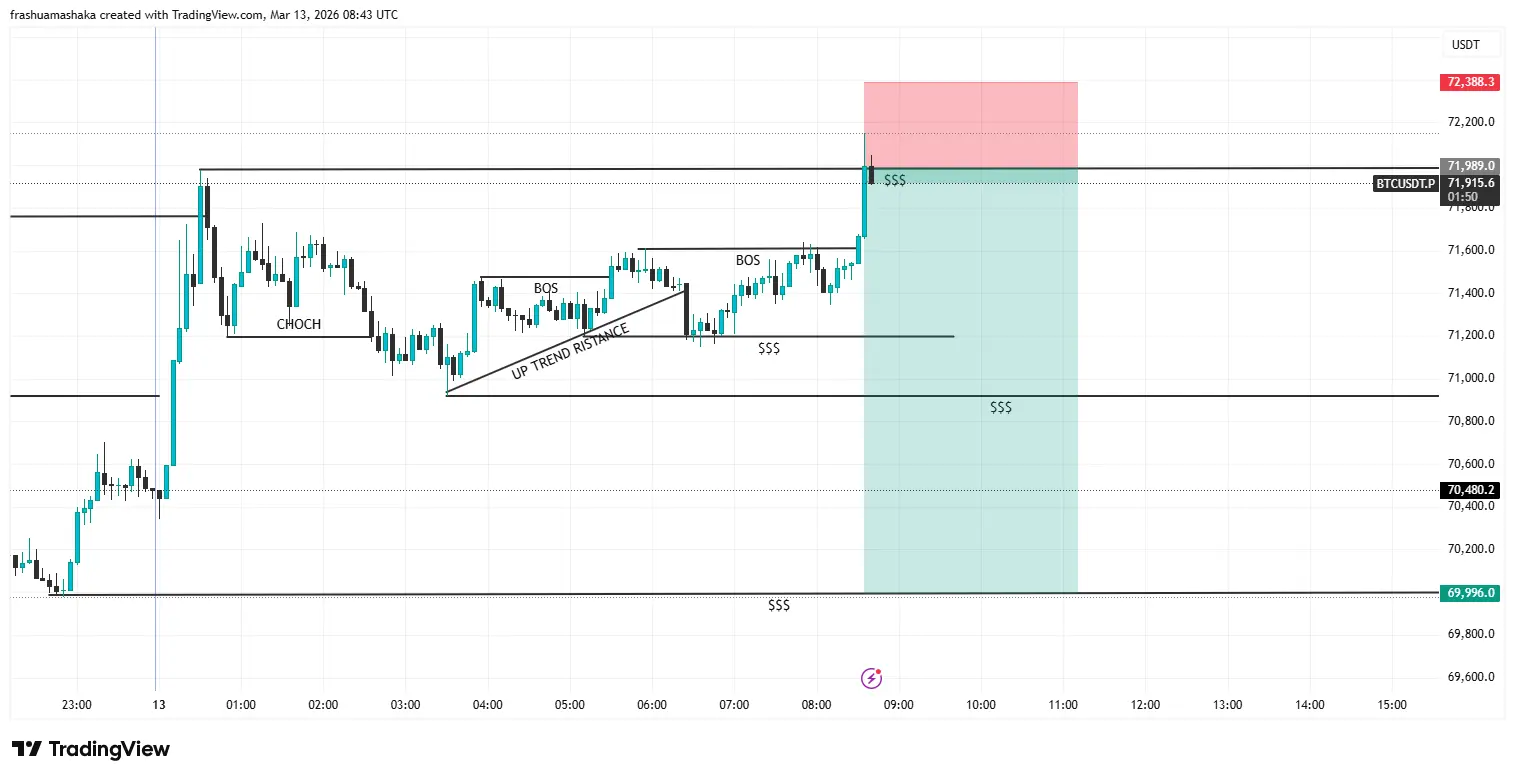
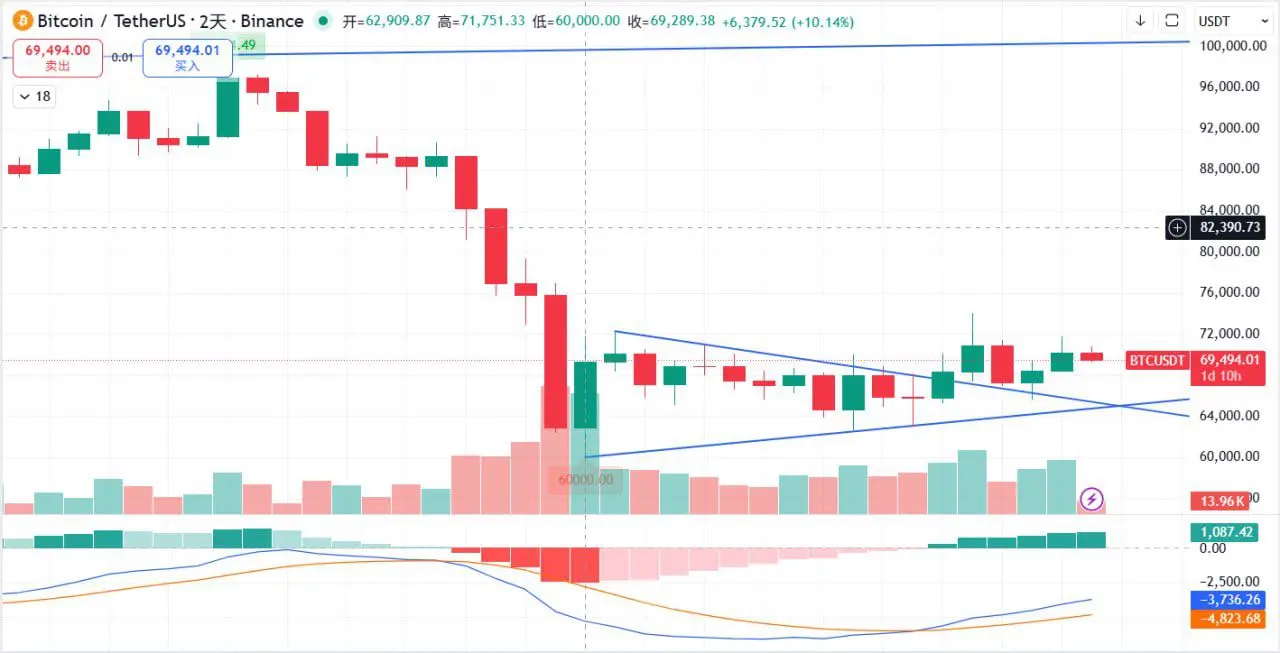
From the perspective of the adjusted 2-day chart, Bitcoin's triangle has broken through the upper boundary and completed retest confirmation, with the upper support remaining effective. The structure for continued upward movement is still quite clear. Currently, the price is under pressure and retracing near the important 73000 resistance zone.
With multiple resistance levels above, any rebound will inevitably involve oscillations, so short-term operations present considerable difficulty.
At this stage of the market, the retest is expected to be relatively gentle. After all, the Middle East conflict news hasn't directly crashed BTC, and short-term resilience still appears decent. Below, focus first on support around the 68000—69000 range.
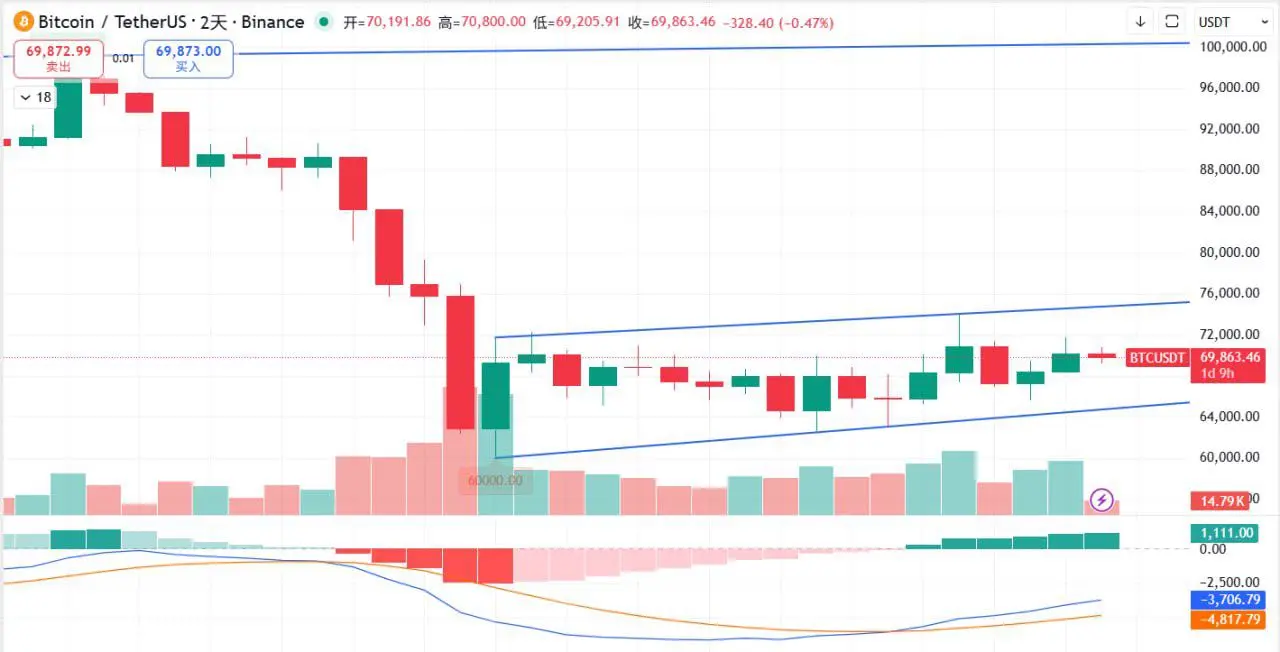
Regarding resistance above, Bitcoin has formed an ascending flag pattern. The upper edge of the flag represents the resistance level, approximately around 74900, coinciding with the 73000—74000 pressure zone, creating significant resistance here.
Unless a breakout with volume occurs, it will be difficult to break through in the short term, so this level can still serve as a reference for the first position reduction.
If the market can truly break through this resistance zone, the upper target can continue to reference the CME gap fill around 79660.
Final reminder:
Ascending flag patterns often exist to be broken downward.
Rebounds will come, but once subsequent breakdown occurs, Bitcoin's overall downtrend will not have ended, and the true major-cycle low likely hasn't appeared yet. Everyone must keep this in mind clearly.
#比特币重新站上7万美元大关 $BTC #BTC $ETH
BTC has been experiencing frequent whipsaws in smaller timeframes due to Middle East geopolitical influences, so we need to increase the cycle duration to better observe the market.
From the perspective of the adjusted 2-day chart, Bitcoin's triangle has broken through the upper boundary and completed retest confirmation, with the upper support remaining effective. The structure for continued upward movement is still quite clear. Currently, the price is under pressure and retracing near the important 73000 resistance zone.
With multiple resistance levels above, any rebound will inevitably involve oscillations, so short-term operations present considerable difficulty.
At this stage of the market, the retest is expected to be relatively gentle. After all, the Middle East conflict news hasn't directly crashed BTC, and short-term resilience still appears decent. Below, focus first on support around the 68000—69000 range.
Regarding resistance above, Bitcoin has formed an ascending flag pattern. The upper edge of the flag represents the resistance level, approximately around 74900, coinciding with the 73000—74000 pressure zone, creating significant resistance here.
Unless a breakout with volume occurs, it will be difficult to break through in the short term, so this level can still serve as a reference for the first position reduction.
If the market can truly break through this resistance zone, the upper target can continue to reference the CME gap fill around 79660.
Final reminder:
Ascending flag patterns often exist to be broken downward.
Rebounds will come, but once subsequent breakdown occurs, Bitcoin's overall downtrend will not have ended, and the true major-cycle low likely hasn't appeared yet. Everyone must keep this in mind clearly.
#比特币重新站上7万美元大关 $BTC #BTC $ETH