#BTC Bitcoin is sitting right around the 63,000-63,100 zone, and the way price has been behaving across both the daily and monthly timeframes tells us a very clear story about where the smart money is positioning and where the real buyers are waiting. This is not a moment for guessing or chasing. It is a moment for patience, for respecting levels, and for understanding that the market rewards discipline far more than aggression. Let me walk you through the structure of both charts so you can see not just where price is, but why price is there, and what the next move is most likely to look like.
Let us start with the one-day chart, because that is where the near-term battle is being fought. If you look at the daily candles over the last several weeks, you will see that Bitcoin made a very clear high around the 82,800 level, and from that high the market has been in a persistent, grinding decline. That decline has not been a straight line. It has been a staircase of lower highs and lower lows, with periodic bounces that have repeatedly sold off. This kind of price action, where every rally is met with fresh selling and every attempt to reclaim a level fails, is the classic signature of a market that is correcting and redistributing. The high was made, the buyers that were chasing that high are now trapped, and the market is systematically working its way down to find the level where the remaining buyers are strong enough to stop the selling.
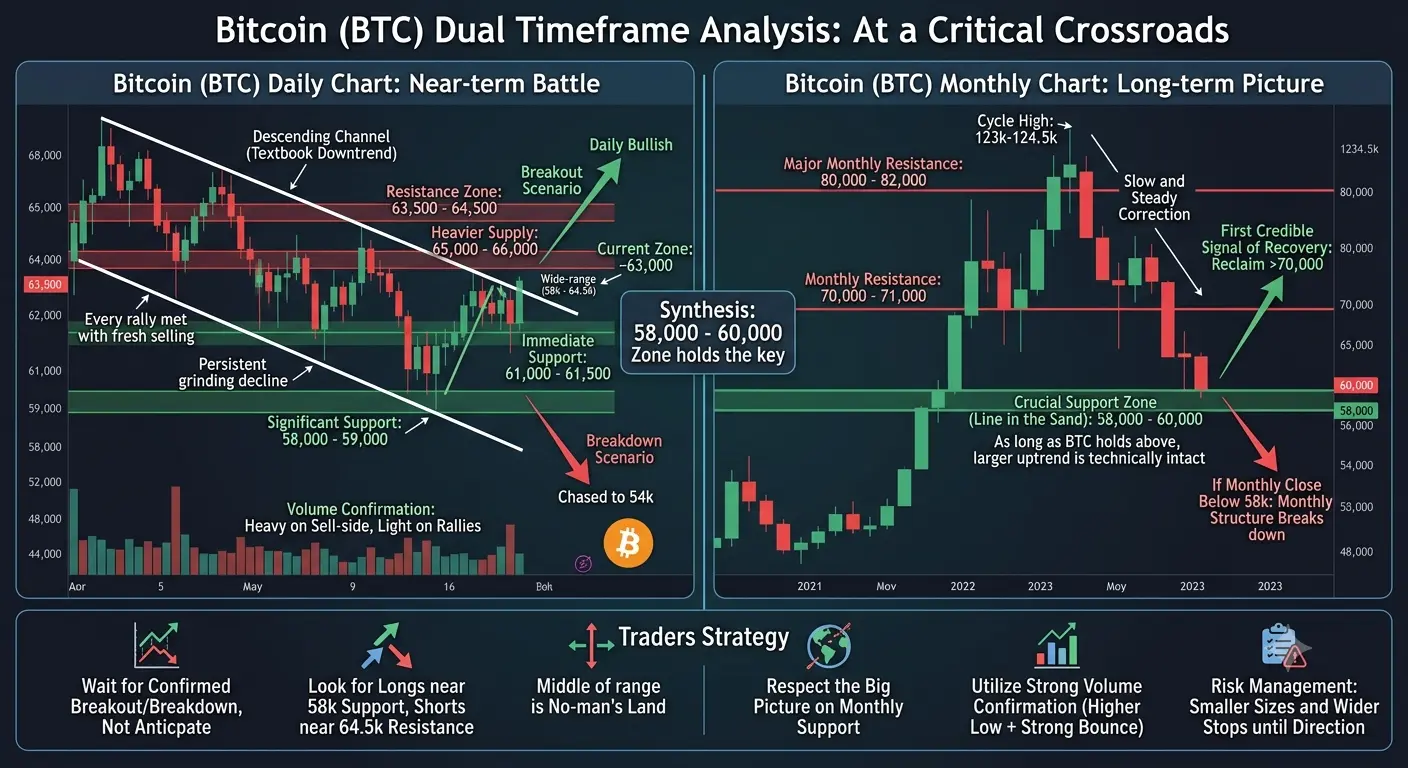
On the daily chart right now, the key resistance structure sits just overhead. The immediate ceiling that price needs to overcome before anything changes is the 63,500-64,500 zone. Above that, we have a heavier layer of supply between 65,000 and 66,000, and if price can somehow break and hold above that, we would be looking at a serious retest of the 68,000-69,000 region. But I want to be honest with you. Every time price has approached these resistance levels in recent sessions, the sellers have defended them with real conviction. We have seen repeated lower highs against that overhead supply, and until we see a daily close that decisively takes out 64,500 with strong volume, I do not think the daily chart gives us a reason to be aggressively bullish. The path of least resistance on the daily remains lower until proven otherwise.
Now let me talk about the support on the daily chart, because this is where the interesting part of the trade really is. Below current price, the first meaningful support region sits around 61,000-61,500. That is the level that price respected during the previous sell-off, and it is the nearest floor. However, the bigger and more significant support is down at the 58,000-59,000 zone. That is the level that has been tested repeatedly over the past month and has held multiple times, and it is the level that the longer-term buyers have been defending. If Bitcoin can hold the 61,000 level on any dip and then start printing higher lows, we have a chance to build a base and work back up toward the resistance. But if that 61,000 gives way with volume, then the 58,000-59,000 zone becomes the real battleground, and a break of that would open up much deeper downside toward the 54,000-55,000 area.
So on the daily, my honest read is that we are in a wide-range consolidation between roughly 58,000 and 64,500, with the bias still tilted toward the lower end until we get a confirmed shift in momentum. The daily chart is telling me that the market has done heavy damage to the recent upside structure, and that rebuilding trust takes time. We need to see the seller step away, we need to see lower selling pressure on bounces, and we need to see a close back above the mid-range before I would start to look for a meaningful reversal. Until that happens, the daily setup rewards patient sellers of strength and patient buyers of the deep support, and it punishes anyone who tries to catch a falling knife or chase a weak bounce.
Now let me zoom out and address the monthly chart, because this is where the longer-term picture really comes into focus. If you look at the monthly candles, you will see that Bitcoin spent months building a massive run-up from well below 60,000, climbing through the 80,000s, breaking above 100,000, and eventually reaching a cycle high in the region of 123,000-124,500 around the middle of last year. That was the peak of the most recent major push, and from that monthly high, the market has been slowly and steadily giving back a significant portion of those gains. We have now seen multiple consecutive monthly candles that are red, and price has pulled back from that high to trade roughly around the 63,000 level. That is a very substantial drawdown from the cycle top, and it tells us that the big picture on the monthly chart has shifted from a pure bull trend into a corrective phase.
Here is the crucial thing about the monthly chart. The monthly support zone that matters more than almost anything else is the 60,000-61,000 region, and just below that, the 58,000 level, which is the neckline and the pivot of all of last year's major breakout structure. The way I read the monthly chart is that as long as Bitcoin can hold above that 58,000-60,000 monthly support, the larger uptrend is still technically intact, even if it looks ugly right now. That monthly support is the line in the sand. It is the level that, if defended, gives this correction its legitimacy and sets up the next phase of the cycle. But if the monthly candle closes decisively below 58,000, then the monthly structure would break down in a serious way, and the next major support on the monthly chart would be down in the 50,000 region and possibly lower.
On the flip side, the monthly resistance is equally important for the recovery case. For the monthly chart to turn back bullish on a structural level, Bitcoin needs to reclaim and hold above the 70,000-71,000 zone first, and then the real monthly resistance sits up near the 80,000-82,000 area where the previous all-time-high zone was. A move back above 70,000 on the monthly close would be the first credible signal that the correction is over and that the next leg higher is underway. Until we get that kind of monthly confirmation, the longer-term picture remains one of a market that is correcting within a larger structure, and that means the upside rallies on the daily chart should be treated with a healthy dose of skepticism.
So let me bring both timeframes together and give you the synthesis. On the daily, we are in a 58,000-64,500 range with downward pressure and repeated rejections at resistance. On the monthly, we are in a corrective phase that is being defined by the 58,000-60,000 monthly support line. When you put those together, the message is unified and consistent: Bitcoin is testing the foundations of its recent bull structure, and the outcome of that test is going to determine the direction for the coming weeks or even months. The most probable scenario, in my view, is that we continue to chop and grind within this wide range, with the daily oscillating against the 58,000 support and the 64,500 resistance, while the market works out the overhang of trapped longs and waits for a catalyst to decide the next major direction.
For a trader, this kind of setup is actually quite clean, even if it feels messy emotionally. On the daily, the disciplined approach is to look for longs near the 58,000-59,000 support with a tight invalidation below it, and to look for shorts near the 64,000-64,500 resistance with a tight invalidation above it. The middle of the range, around 61,000-62,000, is no-man's land, and that is where most people lose money by getting chopped up. The monthly tells you to keep your stops meaningful and to respect the big picture, because if the 58,000 support breaks on a monthly close, then all of that daily-range logic goes out the window and the downside targets shift dramatically lower. Conversely, if we see a daily close back above 64,500 and then a follow-through above 66,000, the range is being broken to the upside and the monthly recovery case starts to build real momentum.
I also want to talk about volume and volume confirmation, because it has been conspicuously heavy on the sell-side and lighter on the rallies. The daily candles that have pushed the market lower have come on increasing volume, which tells me there is genuine distribution happening, not just noise. The bounces, by contrast, have been on comparatively lighter volume, which is the signature of a weak, fading rally rather than a genuine accumulation phase. For the bullish case to become credible, we need to see a bounce that comes on heavier volume, and ideally we want to see that bounce hold above the recent swing low, establishing a higher low on the daily. A higher low on strong volume, followed by a break of the 64,500 resistance on strong volume, would be the kind of sequence that flips the daily structure from bearish to neutral and then to constructive. We are not there yet, and I will not pretend otherwise, but that is precisely the sequence I am watching for.
And one more thing about risk and position management, because this is the part that separates professionals from gamblers. A market that is sitting right at a major decision point, where both the daily and the monthly are converging on the same critical support region, is a market that demands smaller position sizes and wider stops until the direction is confirmed. The smart play right now is not to go all-in on a thesis in either direction. The smart play is to wait for the confirmation, whether that is a defended support with a higher-low reversal or a broken support that opens the path lower, and then commit with clear invalidation levels. Trying to front-run the decision, trying to guess whether the 58,000 support will hold, is how accounts get blown up. Let the market make its move, and then take your cue from price, not from hope.
So what is my honest bottom line? Bitcoin is at a critical structural crossroads. The daily chart is weak, showing a persistent correction with lower highs and lighter-volume rallies, and the monthly chart is corrective, testing the major support line that defined the last bull leg. The single most important level on the entire map right now is the 58,000-60,000 zone, because it is the convergence of both the daily support and the monthly support, and it is the level that will most likely decide the next major directional move. Above us, the 64,500 level is the key to turning the daily structure bullish, and the 70,000-71,000 region is the key to restoring the monthly bull case. Until one of those levels is decisively taken and held, the disciplined approach is to wait, to respect the range, to trade the edges with tight invalidation, and to never abandon risk management just because the temptation of a big move is close. The market will give you a clear signal. Your job is to be patient enough to see it, and disciplined enough to act on it only when it appears. Trade well, protect your capital, and let the structure, not the emotion, guide every decision you make.
#BTCMarketAnalysis @Gate_Square