discovery

vip
Peak Tier 5
Memecoin Hunter
Diamond Hands
I will be patient to win.\n‎
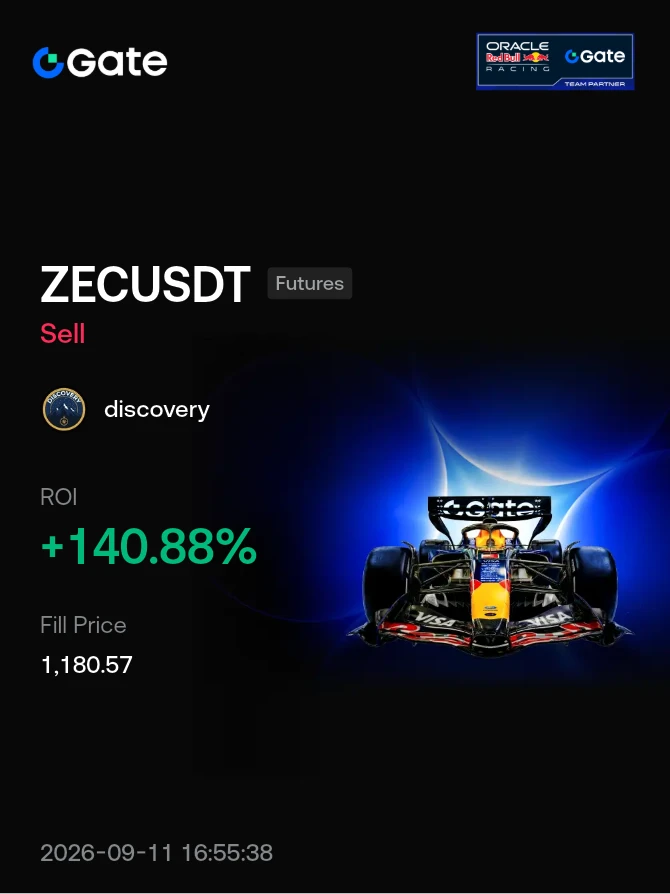
#Share My Futures Return#
post-image
  • 27
  • 1
There are no criteria here; there is only discrimination. 😉😉
User_any
Which of Gate's criteria does this not meet?
@Gate_Square 😡😡😡😡
  • 43
  • 2
#Gate60MillionUsers
60 MILLION USERS. ONE COMMUNITY. MILLIONS OF STORIES. 💙
There are milestones you see on a screen, and then there are milestones that make you stop and think about how many people are actually behind that number.
Gate has now officially surpassed 60 million global users.
Six crore users.
But behind those 60 million accounts are 60 million different journeys.
Someone joined Gate because they wanted to make their first crypto trade. Someone came looking for a new opportunity. Someone was already an experienced trader searching for a broader ecosystem. Someone probably joined
HighAmbition
#Gate60MillionUsers
60 MILLION USERS. ONE COMMUNITY. MILLIONS OF STORIES. 💙
There are milestones you see on a screen, and then there are milestones that make you stop and think about how many people are actually behind that number.
Gate has now officially surpassed 60 million global users.
Six crore users.
But behind those 60 million accounts are 60 million different journeys.
Someone joined Gate because they wanted to make their first crypto trade. Someone came looking for a new opportunity. Someone was already an experienced trader searching for a broader ecosystem. Someone probably joined during a major market rally, while another person may have entered during a difficult correction.
And somewhere inside those 60 million stories is mine.
When I look back at my Gate journey, I don't remember only the profitable trades. Honestly, some of the most memorable moments were the trades that taught me something.
There were moments when the market moved exactly as expected.
There were moments when the market completely surprised me.
There were trades where patience paid off.
And there were also those moments when you look at your position and think:
“Okay… that was definitely not part of the plan.” 😂
But that's crypto.
The market doesn't care about our expectations.
It teaches us through every candle.
My first trades on Gate were not about having perfect knowledge. They were about learning. Learning how markets move, how sentiment changes, why support and resistance matter, why volume can completely change a setup, and most importantly, why risk management matters more than excitement.
Over time, my approach changed.
Instead of asking only, “How high can this coin go?”, I started asking better questions.
Where is the invalidation level?
Where is support?
Where is resistance?
What happens if the breakout fails?
Where should I protect profit?
What is the market sentiment?
Is the move supported by volume?
And what happens if my original idea is simply wrong?
Those questions have become more valuable to me than any single trade.
One of my biggest lessons from trading is that being right is not everything.
Sometimes the best decision is to wait.
Sometimes doing nothing is a position.
Sometimes taking partial profit is better than trying to catch the absolute top.
And sometimes protecting capital is the biggest win of the day.
That is why reaching 60 million users feels bigger than just another platform statistic.
It shows how far the crypto community has grown.
Think about it.
60 million people can have 60 million different reasons for being here.
Different countries.
Different strategies.
Different goals.
Different experiences.
Different first trades.
Different unforgettable market moves.
But we can all understand the same feeling when a trade suddenly goes in our favor. 😂
And we can definitely understand the feeling when the market decides to do the exact opposite.
That shared experience is what makes a trading community interesting.
For me, Gate has also become a place where I can follow the market, explore opportunities, share ideas, create content, and interact with other members of the crypto community.
And now Gate is giving users another reason to share their stories.
The 60 Million Users Celebration Campaign is running from September 3 to September 10.
The reward structure is definitely worth noticing:
🍀 1 lucky participant will have the chance to receive an exclusive 6,000 USDT Futures Position Trial Voucher.
🎁 60 additional lucky participants will each receive a 60 USDT Futures Position Trial Voucher.
💙 And quality content can also qualify for additional rewards, including 1 GT or a Gate merchandise blind box.
The interesting part is that Gate isn't asking everyone to write the same thing.
The idea is to share YOUR story.
When did you join Gate?
What was your first trade?
What was your most profitable trade?
What was the market move you will never forget?
Which trade made you celebrate?
Which one made you laugh?
Which one taught you a lesson?
Maybe your first trade was Bitcoin.
Maybe it was Ethereum.
Maybe it was GT.
Maybe you discovered a completely different asset and that became your most memorable experience.
Maybe your biggest lesson came from a trade that didn't go according to plan.
There is no single definition of a great trading story.
That's what makes this campaign interesting.
My favorite trading stories aren't necessarily the ones where someone says, “I made a huge profit.”
I like the stories where someone explains what they learned.
Because profit can disappear with the next market move.
A lesson can stay with you for years.
That is why I believe every trader should keep a record of their journey.
Remember your first trade.
Remember your first profit.
Remember your first mistake.
Remember the market that scared you.
Remember the trade that made you believe in your strategy.
Remember the moment you realized that emotional decisions can be expensive.
These experiences build a trader.
So today, rather than simply saying “Congratulations Gate on 60 million users,” I want to say congratulations to the 60 million individual stories that helped create this milestone.
To the beginners.
To the experienced traders.
To the investors.
To the creators.
To the people still learning.
And to everyone who has ever stared at a chart at an unreasonable hour thinking:
“Just one more candle.” 😂
We've all been there.
The next 60 million may bring another completely different chapter for crypto.
New users will arrive.
New assets will emerge.
New market cycles will come.
Some trades will work.
Some won't.
But the journey will continue.
And that's the beauty of this market.
There is always another chart.
Another setup.
Another lesson.
Another opportunity to improve.
For this celebration, I am sharing my Gate journey — not because every trade was perfect, but because every experience added something to the journey.
Now I want to see yours.
When did you join Gate?
What was your first trade?
What is the one Gate market moment you will never forget?
Share your story on Gate Square and participate in the celebration.
Use the official campaign hashtag:
#Gate用户突破6000万
Campaign period:
September 3 – September 10
And who knows…
Among 60 million users, perhaps one story will belong to the person who becomes the 6,000 USDT super-lucky winner. 🍀👀
Good luck to everyone participating.
And congratulations, Gate, on reaching 60 million global users. 🎉💙
60 million users.
60 million journeys.
Countless lessons.
Countless memories.
And the next chapter is only beginning.
repost-content-media
BTC+0.50%
ETH+3.25%
GT+3.06%
  • 48
  • 2
$MINIMAX GROUP
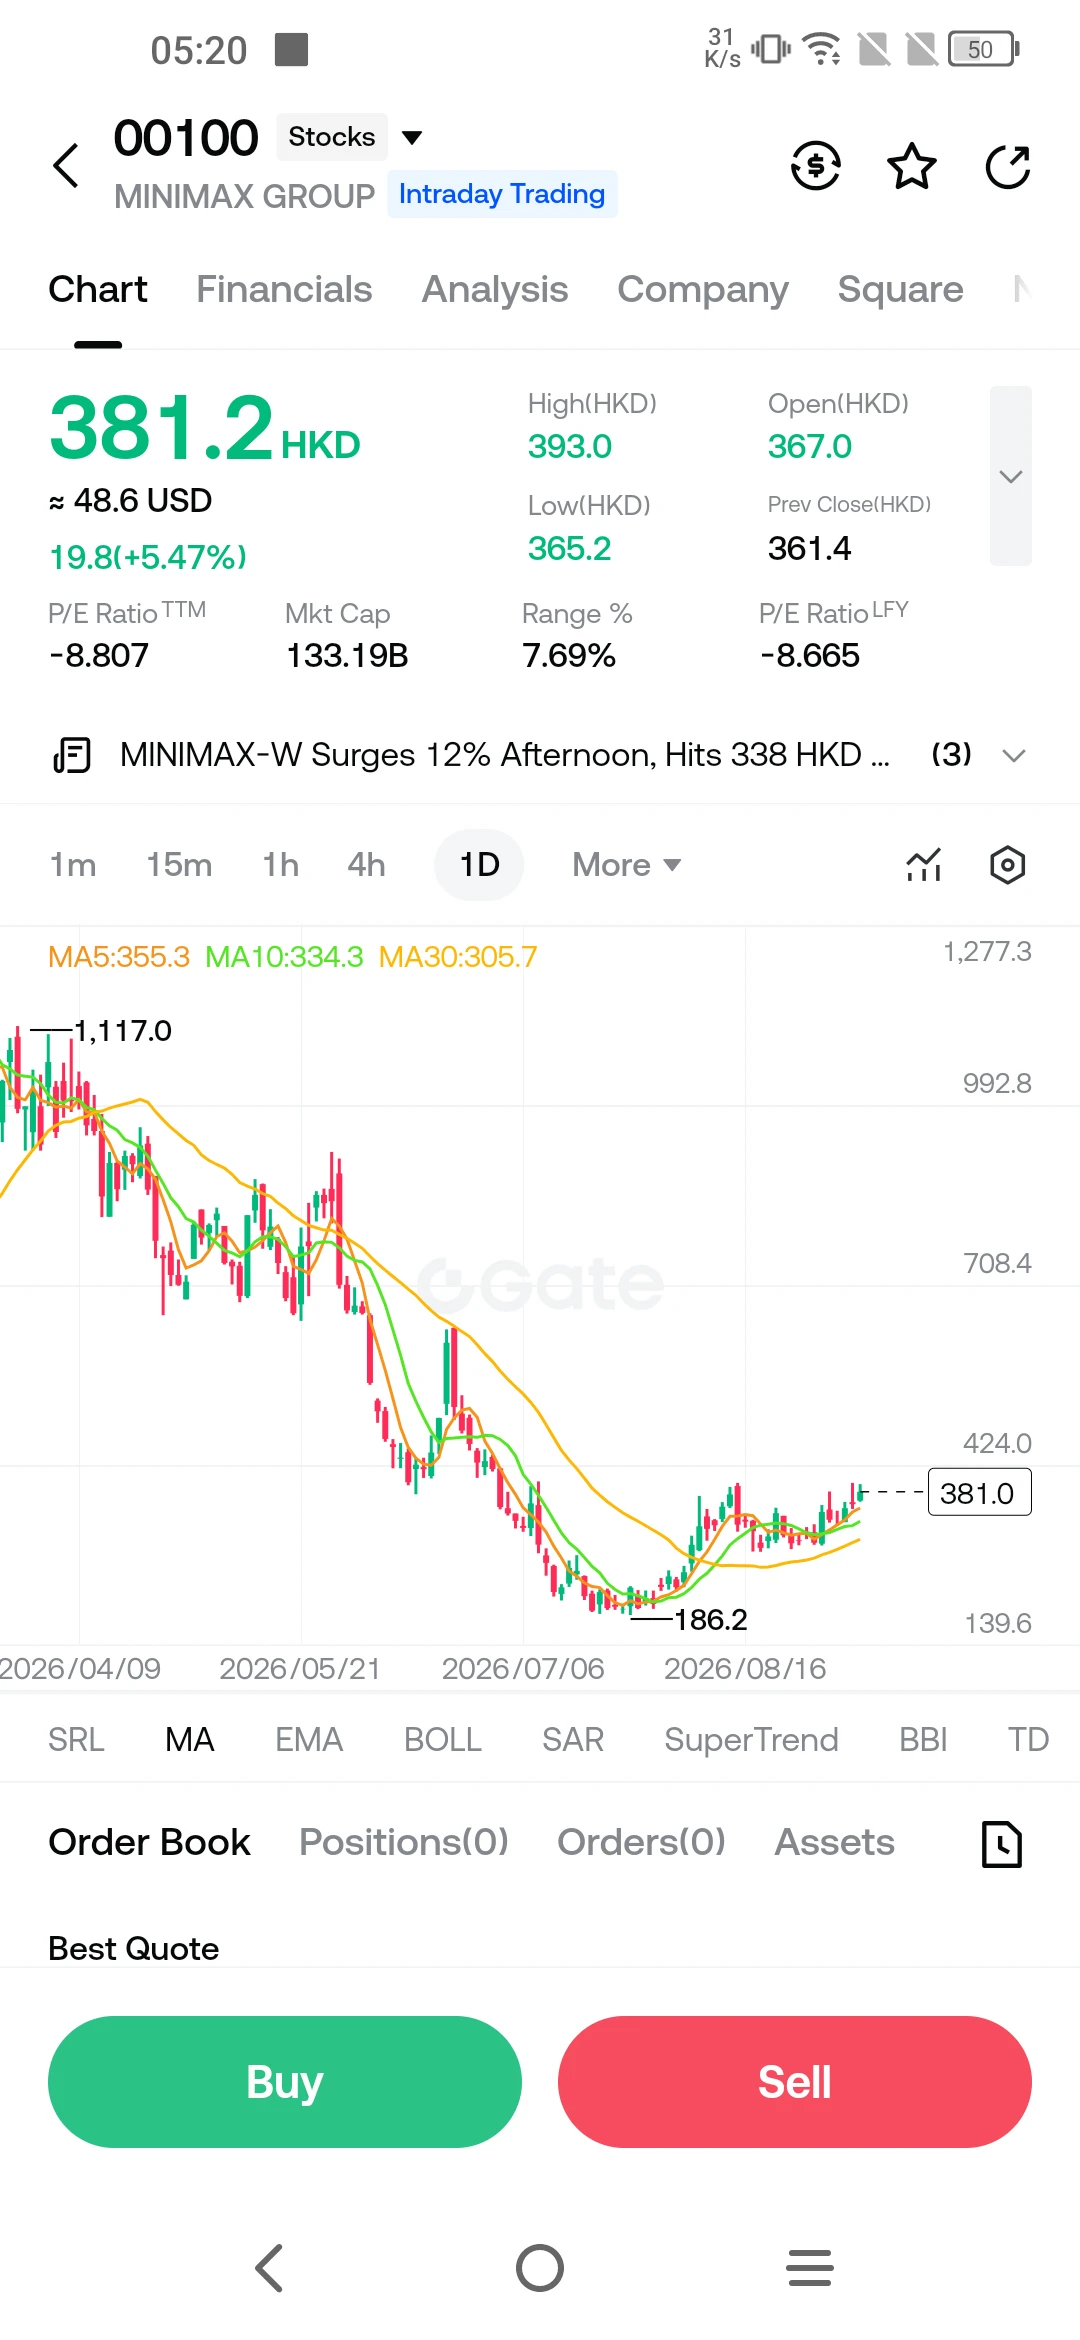
MiniMax Group (00100), which develops artificial general intelligence (AGI) and multimodal AI models, is attracting attention with its strong buying activity in the stock markets. The company's shares gained 5.47% during intraday trading, settling at 381.2 HKD (approximately $48.6 USD), exhibiting a positive outlook.
Stock Pricing Data and Financial Indicators
Key financial parameters during intraday trading are as follows:
Current Price: 381.2 HKD (Daily increase: +19.8 HKD / +5.47%)
Market Cap: 133.19 billion HKD
Intraday Trading Range: Lowest 365.2 HKD, Highest 393.0 HKD
Opening
User_any
$MINIMAX GROUP
MiniMax Group (00100), which develops artificial general intelligence (AGI) and multimodal AI models, is attracting attention with its strong buying activity in the stock markets. The company's shares gained 5.47% during intraday trading, settling at 381.2 HKD (approximately $48.6 USD), exhibiting a positive outlook.
Stock Pricing Data and Financial Indicators
Key financial parameters during intraday trading are as follows:
Current Price: 381.2 HKD (Daily increase: +19.8 HKD / +5.47%)
Market Cap: 133.19 billion HKD
Intraday Trading Range: Lowest 365.2 HKD, Highest 393.0 HKD
Opening and Previous Closing: Opening 367.0 HKD, Previous Closing 361.4 HKD
Price/Earnings Ratio (P/E TTM): -8.807 (Reflects the company's growth and R&D-focused investment process)
Corporate Structure and Operational Scale
Founded in early 2022, MiniMax Group develops unique artificial intelligence models capable of processing multiple data types (text, audio, image, video, and music):
Model Family: MiniMax M2, Hailuo 2.3, Speech 2.6, and Music 2.0 solutions offer ultra-long context processing, advanced encoding, and high agent performance.
Product Ecosystem: MiniMax Agent, Hailuo AI, MiniMax Audio, Talkie, and an open API platform for enterprise developers constitute the main product lines.
Global User Network: The company serves over 212 million individual users in more than 200 countries and regions; and over 100,000 enterprise customers and developers in more than 100 countries.
Technical Outlook and Moving Averages
The daily technical chart of the stock shows a continuation of the gradual recovery trend that started from the low point at 186.2 HKD:
Short-Term Support (MA5): The 5-day moving average is at 355.3 HKD, forming the first dynamic support line in the near term.
Intermediate Support (MA10): The 10-day moving average at 334.3 HKD supports the momentum of the upward trend.
Medium-Term Trend Support (MA30): The 305.7 HKD level, which corresponds to the 30-day moving average, is the key base area that keeps the price within the main upward channel.
Historical Chart Range: The company's shares have tested a low of 186.2 HKD and a high of 1,117.0 HKD over the broad period on the chart.
The fact that the share price is trading above the moving averages (MA5, MA10, and MA30) indicates that positive momentum is being maintained from a technical perspective. Global developments in the AI infrastructure sector, corporate integrations, and stock market trading volumes can be monitored in real-time via the Gate platform.
#MiniMax #AI #STOCKS #GateEventContractTradeSharingChallenge #gStocksPurchaseSubsidyUpTo1000U
DYOR 🔎 NFA ✔️
repost-content-media
  • 44
  • 1
#Gate60MillionUsers
💙 My Gate Journey — An Opportunity That Became a Journey
I joined Gate on January 5, 2025, and at that time, I had no idea how much this platform would become a part of my journey. I started with streaming, and it was a really good time for me. Through content mining, different projects, campaigns, and other opportunities on Gate, I was able to earn while continuously learning and improving my skills. Every new opportunity gave me a reason to explore something different and keep growing.
What I appreciate most is that Gate has continued to create opportunities for its use
CryptoDiscovery
#Gate60MillionUsers
💙 My Gate Journey — An Opportunity That Became a Journey
I joined Gate on January 5, 2025, and at that time, I had no idea how much this platform would become a part of my journey. I started with streaming, and it was a really good time for me. Through content mining, different projects, campaigns, and other opportunities on Gate, I was able to earn while continuously learning and improving my skills. Every new opportunity gave me a reason to explore something different and keep growing.
What I appreciate most is that Gate has continued to create opportunities for its users. Whether it’s content creation, streaming, community activities, campaigns, project opportunities, trading, or different ways to participate and earn, there has always been something new to explore. During some difficult times, these opportunities meant a lot to me and helped me stay motivated. For that, I’m genuinely thankful to Gate.
Later, I started my journey as a content creator on Gate Square. I began sharing my market views, crypto insights, and daily thoughts. Slowly, my posts started reaching more people, my followers began increasing, and content creation became another source of earning for me. What started as a simple step eventually turned into something much bigger—a community that I’m truly proud of.
Today, my profile has reached 5.3K followers, 86K+ likes, and 15K+ shares. Looking at these numbers takes me back to January 2025, when I was just getting started. Every follower, every like, every share, and every opportunity represents a small part of my journey.
I’m genuinely happy and grateful to be part of Gate. 💙 For me, Gate is not simply a platform for trading—it has given me opportunities to learn, create, earn, connect with people, and grow. And the best thing is that the journey is still continuing.
I hope more people discover Gate, explore the opportunities it offers, and build their own stories here. My journey is just one example of how a simple decision to join a platform can eventually open completely new doors.
Thank you, Gate, for the opportunities, the support, and the memories. From my first day on January 5, 2025, to 5,327 followers today—this has been an incredible journey. Here’s to the next chapter and to 60 million users and beyond! 🍀🎉💙
#Gate用户突破6000万 #GateSquare #MyGateJourney
  • 45
#USAugustNFPBeatsExpectations
US August Payrolls Beat Forecast And Lift Mood
US job data for August came in stronger than forecast, giving a fresh boost to confidence about the labor backdrop. Hiring held firm, jobless claims stayed low and wage gains showed steady progress. The upside surprise eased fears of a sharp slowdown and put focus back on resilient consumer demand heading into the final stretch of the year.
① Broad Hiring Across Core Sectors
Gains were broad, not tied to one niche. Services led the rise, with health care, leisure and business support adding new roles. Goods producer
  • 49
  • 8
#Share My Holding Returns#
  • 25
  • 1
Convert Lucky Draw Phase 23: $1 Unlocks ETH, Check In to Win https://www.gate.com/campaigns/6096?ref=BVIRBA8M&ref_type=132
post-image
  • 30
Robinhood Meme Carnival: 3 USDT on Your First Trade, Up to 8,000 USDT in Rewards https://www.gate.com/campaigns/6131?ref=BVIRBA8M&ref_type=132
post-image
  • 28
$XAUUSD
XAUUSD / Gold - 1-Hour Chart Detailed Support / Resistance Analysis
Data: Price 4,430.28 -42.91 (-0.95%) - Today's High 4,490.81 Low 4,365.56 - Open 4,470.26 Prev Close 4,473.19 MA5:4,428.42 MA10:4,428.04 MA30:4,460.92 MACD: -4.06 DIF: -7.19 DEA: -3.13
1. GENERAL STRUCTURE
The chart is in a structure of a sharp dump, recovery, and second dump. On the left, there is a 7.5% drop from the 4,631.71 peak to the 4,282.62 bottom. Then it made a V-reversal up to above 4,477 and now the second selling wave has come. It wicked to 4,365.56 and is trying to hold at 4,430. This is a very volatile
post-image
XAUUSD+0.74%
  • 32
  • 3
#CBRS
$CBRS ‌/ Cerebras Systems - 4-Hour Chart Detailed Support / Resistance Analysis
Data: Price 209.94 +10.26% - Intraday High 216.90 Low 190.45 - Range 13.89% very volatile. MA5:197.02 MA10:188.20 MA30:196.42 MACD:4.59 DIF:-2.07 DEA:-6.66
1. GENERAL STRUCTURE
The chart is in a bottom-reversal formation. There is a 40% drop from the 269.39 top on the left to the 160.81 bottom. After 08/03 it rallied to 261.54 and then got sold again and returned to a bottom near 160s. Now it is the second bottom reversal. The TD Sequential signals with red 9 (bottom) and green 9 (top) on the chart have wor
CBRS+0.32%
  • 28
  • 1
#SNDK
SNDK / Sandisk - 4-Hour Chart - Detailed Support / Resistance Analysis
$SNDK ‌ Price 1,739.88 up 11.88%. Intraday High 1,740.00 Low 1,582.00 MA5: 1622.83 MA10:1582.27 MA30:1567.92 MACD is positive.
1. GENERAL STRUCTURE
The chart is a large V-reversal. It dropped 57% from the 2,353.12 peak on 06/24 to the 998.19 bottom. Now it is making a correction of that drop. The TD Sequential indicator shows clear green 9s and red 9s. The last green 9 came around 08/14 and the rally started after that 9. The current green candle closed at 1,739.88 very close to the daily high, which means very st
post-image
SNDK-3.49%
  • 49
  • 6
#GateTops7DayNetInflowsGlobally
Weekly Net Inflow Crown Goes To Top Trading Venue
A fresh weekly read on capital flow shows a clear leader at the top. One major trading venue has posted the largest net inflow across the global market for the past weekly window, pulling ahead of all rivals. The data points to strong user trust and a wave of fresh deposits aimed at spot and derivatives books. In a time when traders move funds with care, this kind of lead is seen as a strong vote of confidence.
① Why Net Inflow Matters For Market Health
Net inflow tracks the gap between funds added and funds tak
MU-0.51%
NVDA-0.09%
SNDK-3.49%
TSLA+0.51%
AAPL+1.71%
  • 32
  • 3
#GateEventContractTradeSharingChallenge
A trade is easy to show after it works.
The harder part is explaining why you took it before the result was known.
That is what makes the Gate Event Contract Trade Sharing Challenge interesting to me.
The market does not give us certainty. It gives us probabilities, signals, momentum, resistance, support, liquidity and a lot of noise. The real skill is taking all of that information and turning it into a clear market view.
That is exactly how I look at Event Contracts.
Before entering a position, I want to know what I am actually predicting. Is the mark
ItsMeAnexa
#GateEventContractTradeSharingChallenge
A trade is easy to show after it works.
The harder part is explaining why you took it before the result was known.
That is what makes the Gate Event Contract Trade Sharing Challenge interesting to me.
The market does not give us certainty. It gives us probabilities, signals, momentum, resistance, support, liquidity and a lot of noise. The real skill is taking all of that information and turning it into a clear market view.
That is exactly how I look at Event Contracts.
Before entering a position, I want to know what I am actually predicting. Is the market likely to move higher or lower? What is the prediction period? What is supporting my view? And what would make me admit that my analysis was wrong?
Those questions are more important than simply pressing the buy or sell button.
For example, if I have a bullish BTC view, I would not want to write only “BTC will go up.” That is a prediction, but it is not much of an analysis.
A stronger trade thesis would look at price structure, momentum, volume, market sentiment, liquidity and the wider macro environment. If several factors point in the same direction, the setup becomes more interesting.
But even then, there is no guarantee.
That is one of the most important lessons in crypto.
A strong setup can fail.
A breakout can become a fakeout.
A support level can disappear within minutes.
And a market that looks bullish in the morning can completely change by the evening.
That is why I think sharing the reasoning behind a trade is more valuable than simply sharing the final result.
A winning screenshot tells me that the trade worked.
The analysis tells me why I took it.
The losing trade can be even more useful because it forces me to ask what I missed.
Was the timing wrong?
Did I underestimate resistance?
Was the momentum weaker than expected?
Did new macro information change the market?
Or was my original thesis simply incorrect?
That review process is where traders actually improve.
The Gate Event Contract Trade Sharing Challenge creates an interesting environment around this idea because traders are encouraged to share their market views, positions and results rather than keeping the entire process hidden.
For me, the best participation would not be a random screenshot with a few words attached.
It would be a complete trade story.
Here was the market.
Here was my view.
Here was my reasoning.
Here was the prediction period.
Here was the position.
And here is what happened.
That format makes the content useful even for someone who was not involved in the trade.
It also creates accountability.
When you publicly write down your thesis before the result, you cannot simply rewrite the story afterward.
You either read the market correctly or you learn where your analysis needs improvement.
That is a much healthier way to think about trading.
Crypto already has enough noise.
Every day there are new narratives, sudden pumps, unexpected dumps and thousands of predictions flying across social media.
What stands out is not necessarily the loudest prediction.
It is the person who can explain their view clearly.
That is why I see this challenge as more than a reward campaign.
It can be a way to turn trading activity into a learning process.
One trade gives you a result.
A series of trades gives you data about your own decision-making.
Over time, you can start identifying patterns in your behavior.
Maybe you enter too early.
Maybe you chase breakouts.
Maybe you hold losing positions too long.
Maybe your analysis is strong but your timing is weak.
Those are the things that matter if the goal is becoming a better trader.
And this is also why I would never treat an Event Contract as an excuse to trade without a plan.
The reward should never be the reason for taking a position.
The market view should come first.
Risk management should come first.
Understanding the contract should come first.
The campaign comes after that.
For me, the most interesting part is simple:
Do not just show the trade.
Show the thought process.
Because a screenshot can prove that you traded.
A clear thesis can show that you actually understood what you were trading.
And after the result, the most valuable question is not always “Did I win?”
Sometimes it is:
“What did this trade teach me?”
That is the kind of content I want to see from traders.
Real setups.
Real reasoning.
Real outcomes.
No exaggerated promises.
No pretending that every prediction will be correct.
Just traders putting their market views on record and learning from what happens next.
That is what makes trading content worth reading.
And that is exactly how I would approach the Gate Event Contract Trade Sharing Challenge.
Trade the view.
Share the reasoning.
Review the result.
Learn from the market.
Then do it better on the next trade.
#GateEventContractTradeSharingChallenge #GateSquare
#ContentMining
@Gate_Square
BTC+0.50%
  • 47
  • 3
$PENGU : Breakout Retest Under Pressure
PENGU broke above descending resistance and reached near $0.0090, but is now testing the $0.0082–$0.0084 breakout zone.
Key levels: • $0.0082–$0.0084 — support
• $0.0090–$0.0095 — resistance
• $0.0100–$0.0102 — confirmation
Daily short-sale volume has cooled below 1M, while reported short positioning remains above 11M.
The key: holding $0.0082 keeps the breakout structure intact. Losing it weakens the setup.
No prediction — just the levels and positioning worth watching.
#PENGU #PudgyPenguins #Crypto
#GateEventContractTradeSharingChallenge
Mr_Shah
$PENGU : Breakout Retest Under Pressure
PENGU broke above descending resistance and reached near $0.0090, but is now testing the $0.0082–$0.0084 breakout zone.
Key levels: • $0.0082–$0.0084 — support
• $0.0090–$0.0095 — resistance
• $0.0100–$0.0102 — confirmation
Daily short-sale volume has cooled below 1M, while reported short positioning remains above 11M.
The key: holding $0.0082 keeps the breakout structure intact. Losing it weakens the setup.
No prediction — just the levels and positioning worth watching.
#PENGU #PudgyPenguins #Crypto
PENGU+0.65%
  • 26
  • 1
#Gate事件合约晒单挑战
$ZEC
ZEC Just Flipped DOGE — And the Market Is Paying Attention
The crypto rankings have a new headline.
Zcash ($ZEC) has pushed past Dogecoin ($DOGE ) to claim the position by market capitalization, with ZEC now valued at approximately $19.64B according to the latest September 6, 2026 market data.
But this is not simply a ranking change.
It is a clear example of how aggressive price appreciation, capital rotation, supply structure, and strengthening market participation can completely reshape the large-cap crypto hierarchy within a short period of time.
ZEC has been one of the
SoominStar
#Gate事件合约晒单挑战
$ZEC
ZEC Just Flipped DOGE — And the Market Is Paying Attention
The crypto rankings have a new headline.
Zcash ($ZEC) has pushed past Dogecoin ($DOGE) to claim the position by market capitalization, with ZEC now valued at approximately $19.64B according to the latest September 6, 2026 market data.
But this is not simply a ranking change.
It is a clear example of how aggressive price appreciation, capital rotation, supply structure, and strengthening market participation can completely reshape the large-cap crypto hierarchy within a short period of time.
ZEC has been one of the stronger performers across recent sessions, with price moving through the $1,000–$1,170 area while trading activity expanded significantly. Its circulating supply is approximately 16.8M coins against a maximum supply of 21M, giving the asset a considerably tighter supply profile than DOGE.
That difference matters when capital starts moving.
Dogecoin remains around the $0.09 region with a market capitalization in the mid-$14B range, but its enormous circulating supply means that pushing its market value substantially higher requires a much larger amount of capital compared with an asset such as ZEC.
The ranking flip therefore reflects two forces working together: ZEC’s powerful recent appreciation and the structural difference in circulating supply.
The technical picture also supports the strength of the move.
On the daily timeframe, ZEC has maintained a clear pattern of higher highs and higher lows while repeatedly breaking through resistance zones that previously limited the advance. More importantly, volume expanded alongside the strongest upward sessions, suggesting that the rally has attracted meaningful market participation rather than being driven purely by thin liquidity.
Momentum has also shifted decisively.
Indicators that were previously neutral have moved into stronger territory as the trend developed, while the price structure continues to favor buyers. This combination of price expansion and increasing participation is what makes the current move more significant than a simple short-term spike.
The next question is whether ZEC can defend its newly gained position.
The previous breakout zones are now the areas I would watch most closely during any pullback. If buyers continue defending those levels and volume remains healthy, the bullish structure remains intact. Above the current range, recent highs and major psychological levels become the next potential resistance references.
There is also a broader relative-strength story developing.
While several major cryptocurrencies have produced more moderate returns, ZEC has delivered substantially stronger performance across both shorter and longer windows. That divergence has helped accelerate the market-cap crossover and push ZEC directly into the top-tier ranking conversation.
Still, market-cap rankings are not permanent.
A sharp reversal in ZEC, renewed momentum in DOGE, or stronger performance from the assets surrounding the position could quickly change the leaderboard again. The real test is therefore not whether ZEC reached , but whether it can maintain the capital flows and technical structure that took it there.
For now, the message from the market is clear:
ZEC has overtaken DOGE.
With approximately $19.64B in market capitalization, stronger price momentum, expanding volume, constrained supply, and a constructive technical structure, Zcash has become one of the most important large-cap movers to watch right now.
The ranking has changed.
Now the market has to decide whether ZEC can keep it.
#ZEC #Gate事件合约晒单挑战
repost-content-media
ZEC+4.86%
DOGE+1.97%
  • 26
  • 2
$MU
#GateEventContractTradeSharingChallenge ‌ ‌$1,000 HAS BEEN RECLAIMED. CAN MICRON PUSH TOWARD $1,050–$1,100?
Micron Technology is back above the psychologically important $1,000 level, and this is where the chart becomes very interesting.
$MU is currently around $1,014.91, with the latest session trading between approximately $962.20 and $1,018.01. Volume was around 35.25M, above the reported average daily volume of roughly 25.08M, showing that the recent move is attracting meaningful participation.
The stock also closed above $1,000 recently, gaining about 6.1% in the session and roughly
Falcon_Official
$MU
#GateEventContractTradeSharingChallenge ‌ ‌$1,000 HAS BEEN RECLAIMED. CAN MICRON PUSH TOWARD $1,050–$1,100?
Micron Technology is back above the psychologically important $1,000 level, and this is where the chart becomes very interesting.
$MU is currently around $1,014.91, with the latest session trading between approximately $962.20 and $1,018.01. Volume was around 35.25M, above the reported average daily volume of roughly 25.08M, showing that the recent move is attracting meaningful participation.
The stock also closed above $1,000 recently, gaining about 6.1% in the session and roughly 9% for the week. That puts the $1,000 psychological level directly in focus for the next move.
TECHNICAL STRUCTURE — BULLISH MOMENTUM IS RETURNING
The first level I am watching is $1,000.
For me, this is more than just a round number. After moving back above $1,000, the market needs to prove that this level can transform from resistance into support.
If MU continues holding above $1,000 and starts building higher lows, the short-term bullish structure becomes stronger.
The next immediate resistance is around $1,018–$1,020, which is close to the latest session high.
A clean breakout above $1,020 with strong volume could open the door toward $1,050.
Above $1,050, my next psychological zone would be $1,100.
So my short-term roadmap is:
$1,000 → key psychological support
$1,018–$1,020 → immediate breakout zone
$1,050 → first upside objective
$1,100 → major psychological target
$1,150 → extended bullish target if momentum accelerates
The important part is confirmation. I want to see price hold above each level rather than simply spike through it.
SUPPORT ZONES — WHERE BUYERS NEED TO DEFEND
The first support area is $1,000–$995.
If MU remains above this zone, buyers are still showing strength.
A deeper pullback toward $970–$960 would be the next area I would monitor because the recent session reached approximately $962.20.
Below that, the $935–$950 region becomes particularly important because the 50-day moving average has recently been around the mid-$900s.
My interpretation is simple:
Above $1,000 → bullish momentum remains active.
$970–$960 → important pullback zone.
$950–$935 → deeper structural support.
Below $935 → short-term bullish momentum would require reassessment.
FUNDAMENTALS — WHY THE $MU STORY REMAINS POWERFUL
The technical setup is only one part of the story.
Micron's fundamentals have changed dramatically as AI infrastructure demand accelerates.
In fiscal Q3 2026, Micron reported approximately $41.46 billion in revenue, compared with $23.86 billion in the previous quarter and $9.30 billion in the same quarter a year earlier.
That is an extraordinary acceleration.
The AI memory cycle is becoming one of the biggest catalysts for MU.
HBM demand, DRAM pricing, NAND demand and data-center expansion are all important parts of the thesis.
Recent reporting also highlights continued strength in AI memory demand and Micron's aggressive HBM capacity expansion.
This is why I am watching MU alongside other AI semiconductor names.
AI isn't only about GPUs.
AI also requires enormous amounts of high-performance memory.
TRADING SETUP — MY BULLISH PREFERENCE
I would prefer a confirmed breakout or a controlled pullback rather than chasing a vertical candle.
SETUP A — BREAKOUT
Entry confirmation: Above $1,020 with strong volume
First target: $1,050
Second target: $1,100
Extension: $1,150+
Invalidation: Failure to hold the breakout and return below $1,000
SETUP B — PULLBACK
Preferred zone: $995–$1,000
Deeper entry zone: $970–$960
Confirmation: Buyers defend support and form a higher low
Upside targets: $1,020 → $1,050 → $1,100
This is the setup I personally find more attractive because it provides a clearer risk point instead of chasing momentum at the top of a candle.
BULLISH SCENARIO
If MU holds above $1,000, breaks $1,020 and confirms that breakout with volume, I would expect buyers to focus on $1,050 next.
A clean move through $1,050 could bring $1,100 into focus.
If AI semiconductor momentum remains strong and MU continues making higher highs and higher lows, an extension toward $1,150 or higher becomes possible.
BEARISH SCENARIO
The bullish thesis becomes weaker if MU loses $1,000 and fails to reclaim it.
A move toward $970–$960 would then become possible.
If selling pressure pushes MU below the $950–$935 region, I would become significantly more cautious because that would suggest the recent breakout momentum is losing strength.
I would rather wait for a new base than try to predict the exact bottom.
MY VIEW ON $MU
For me, $1,000 is the battlefield.
The stock has already experienced an enormous move over the past year, so volatility should be expected. Recent reporting notes that MU has risen dramatically over the longer term while still experiencing significant pullbacks along the way.
That means I am bullish on the structure, but I am not interested in blindly chasing.
My ideal situation is:
$1,000 holds.
$1,020 breaks.
Volume expands.
Price retests the breakout.
Buyers defend the retest.
Then $1,050 becomes the next target.
After that, $1,100 is the major psychological level I would watch.
RISK MANAGEMENT
MU can move extremely fast, especially around earnings, memory-price updates, AI spending news and broader semiconductor-sector moves.
So I would keep position size controlled.
I would risk only 1–2% of trading capital on a single setup, define the invalidation level before entering, take partial profits as targets are reached, and avoid excessive leverage.
The next major fundamental catalyst is also worth remembering: Micron is scheduled to report fiscal Q4 results on September 30, 2026.
FINAL THOUGHT
$MU has reclaimed $1,000, and that changes the short-term technical picture.
Now I want to see whether $1,000 becomes genuine support.
My key levels are:
$1,000 — battlefield
$1,020 — breakout confirmation
$1,050 — first upside target
$1,100 — major target
$1,150+ — momentum extension
$970–$960 — pullback support
$950–$935 — deeper structural support
My bias remains bullish while MU maintains the higher-high/higher-low structure and holds the major support zones.
I am watching the breakout, but I am even more interested in the retest.
No FOMO.
No blind entries.
Let price confirm the setup.
Trade the levels, manage the risk, and protect the capital.
MU-0.51%
  • 24
  • 1
Limited USDT Rewards, 125 NVDA Shares in Two Prize Pools https://www.gate.com/campaigns/6135?ch=7015&ref=BVIRBA8M&ref_type=132
post-image
  • 28
  • 1