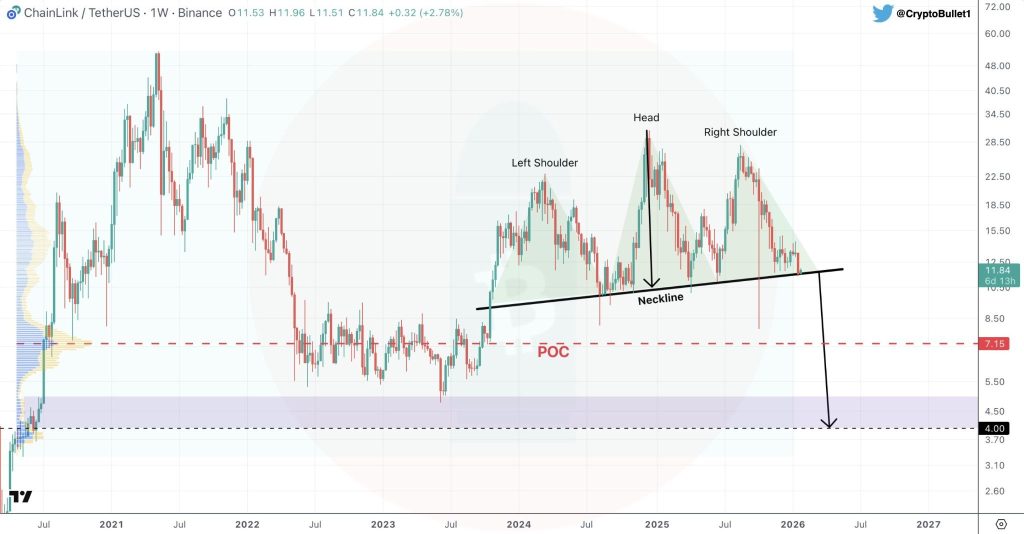
Looking at the weekly chart, the structure on LINK becomes pretty clear. What we are looking at is a classic head-and-shoulders pattern that has been forming since 2024.
The left shoulder took shape in the low to mid $20s, then LINK price pushed higher to form the head near the upper $20s, and after that, the right shoulder rolled over again around similar levels.
What really stands out here is the neckline. It is not flat, but slightly rising, and it comes in right around the $10 to $11 zone. That is why the LINK price is now sitting at such a sensitive level. This is not just another support. It is the level that decides whether this entire structure breaks down or not.
Why $10–$11 Is Critical For LINK, With Lower Levels Below
CryptoBullet’s main message is simple and hard to argue with. If the LINK price loses the $10–$11 support area on a weekly close, things can turn ugly quickly. On a chart like this, a weekly close matters far more than a random wick or a quick dip.
Source: X/@CryptoBullet1
Just below that, around $7.15, sits what he calls the conservative downside target. This level is not picked randomly. It lines up with the volume point of control and with the accumulation zone from 2022 and 2023. In other words, this is where LINK previously spent a lot of time trading, so if price starts sliding, that zone naturally becomes the next place the market looks toward.
If the head-and-shoulders plays out fully, the measured move points toward the $4–$5 area. That is the deeper target mentioned in the tweet, and it matches the lower demand zone visible on the chart.
Getting to that level would depend on a general softness in the crypto space, not necessarily on LINK being lagging on its own. Nonetheless, it does provide a roadmap as long as sellers are in charge.
What Needs To Happen To Avoid This Breakdown
For this bearish setup to lose its grip, the LINK price needs to hold the $10 to $11 area and start building higher lows from there. Even better would be a clean reclaim and move back above the right shoulder zone, which would start to invalidate the pattern entirely.
Until that happens, the chart is very straightforward. The LINK price is sitting right on the line that separates a messy consolidation from a full weekly breakdown, and the next few weekly closes will likely decide which side wins.
Why Chainlink’s CCIP Is Turning LINK Into a Financial Infrastructure Play_**
Disclaimer: The information on this page may come from third parties and does not represent the views or opinions of Gate. The content displayed on this page is for reference only and does not constitute any financial, investment, or legal advice. Gate does not guarantee the accuracy or completeness of the information and shall not be liable for any losses arising from the use of this information. Virtual asset investments carry high risks and are subject to significant price volatility. You may lose all of your invested principal. Please fully understand the relevant risks and make prudent decisions based on your own financial situation and risk tolerance. For details, please refer to
Disclaimer.
Related Articles
Citigroup slashes Bitcoin and Ethereum 12-month price targets, stating that stalled U.S. crypto legislation weakens upward catalysts.
Citigroup lowers its 12-month target prices for Bitcoin and Ethereum, indicating that its medium-term outlook for the crypto market has turned cautious, mainly because progress on U.S. crypto-asset legislation has been slow. Its Bitcoin target is reduced from $143,000 to $112,000, and its Ethereum target is lowered to $3,175. Although there is still room for upside in the future, the lack of new policy catalysts means prices could trade within a range in the short term. Citigroup is even more cautious in its assessment of Ethereum, saying it is more heavily influenced by on-chain activity.
区块客1h ago
The cryptocurrency fear and greed index has dropped to 12, indicating that the market is in a state of extreme fear.
Gate News report, on March 28, according to data from Alternative.me, the cryptocurrency fear and greed index has fallen to 12 today, indicating a state of "extreme fear" in the market. Yesterday, the index was at 13, also indicating "extreme fear."
GateNews1h ago
Solana Eyes $100 Breakout As TD Sequential Indicator Flashes Buy Signals Amid Selling Pressure Co...
The Solana (SOL) coin is currently in the spotlight as its price movement appears to be in the process of reversing, according to a revelation disclosed today by market analyst Ali Martinez. Solana, a cryptocurrency known to support
BlockChainReporter2h ago
Altcoins Mirror 2021 Surge — 4 Picks That Could Explode 100x Despite Iran Tensions & Macro Uncertainty
Altcoins are forming a structure similar to the early 2021 breakout phase.
Ethereum, BNB, and Solana show stronger technical positioning among large caps.
Meme coins indicate rising risk appetite but remain highly volatile.
The altcoin market is showing signs of repeating a historical
CryptoNewsLand3h ago
Bittensor (TAO) Hits a 3-Month Peak: What Caused the Rally and What Comes Next?
Many leading cryptocurrencies have posted slight declines or negligible increases over the past 24 hours, but this isn’t the case for Bittensor (TAO), whose price soared by 15%.
The question now is whether this momentum can hold or if a pullback is coming next.
Further Gains
CryptoPotato5h ago
