Trade
Basic
Futures
Futures
Hundreds of contracts settled in USDT or BTC
TradFi
Gold
Trade global traditional assets with USDT in one place
Options
Hot
Trade European-style vanilla options
Unified Account
Maximize your capital efficiency
Demo Trading
Futures Kickoff
Get prepared for your futures trading
Futures Events
Participate in events to win generous rewards
Demo Trading
Use virtual funds to experience risk-free trading
Earn
Launch
CandyDrop
Collect candies to earn airdrops
Launchpool
Quick staking, earn potential new tokens
HODLer Airdrop
Hold GT and get massive airdrops for free
Launchpad
Be early to the next big token project
Alpha Points
Trade on-chain assets and enjoy airdrop rewards!
Futures Points
Earn futures points and claim airdrop rewards
Investment
Simple Earn
Earn interests with idle tokens
Auto-Invest
Auto-invest on a regular basis
Dual Investment
Buy low and sell high to take profits from price fluctuations
Soft Staking
Earn rewards with flexible staking
Crypto Loan
0 Fees
Pledge one crypto to borrow another
Lending Center
One-stop lending hub
VIP Wealth Hub
Customized wealth management empowers your assets growth
Private Wealth Management
Customized asset management to grow your digital assets
Quant Fund
Top asset management team helps you profit without hassle
Staking
Stake cryptos to earn in PoS products
Smart Leverage
New
No forced liquidation before maturity, worry-free leveraged gains
GUSD Minting
Use USDT/USDC to mint GUSD for treasury-level yields
More
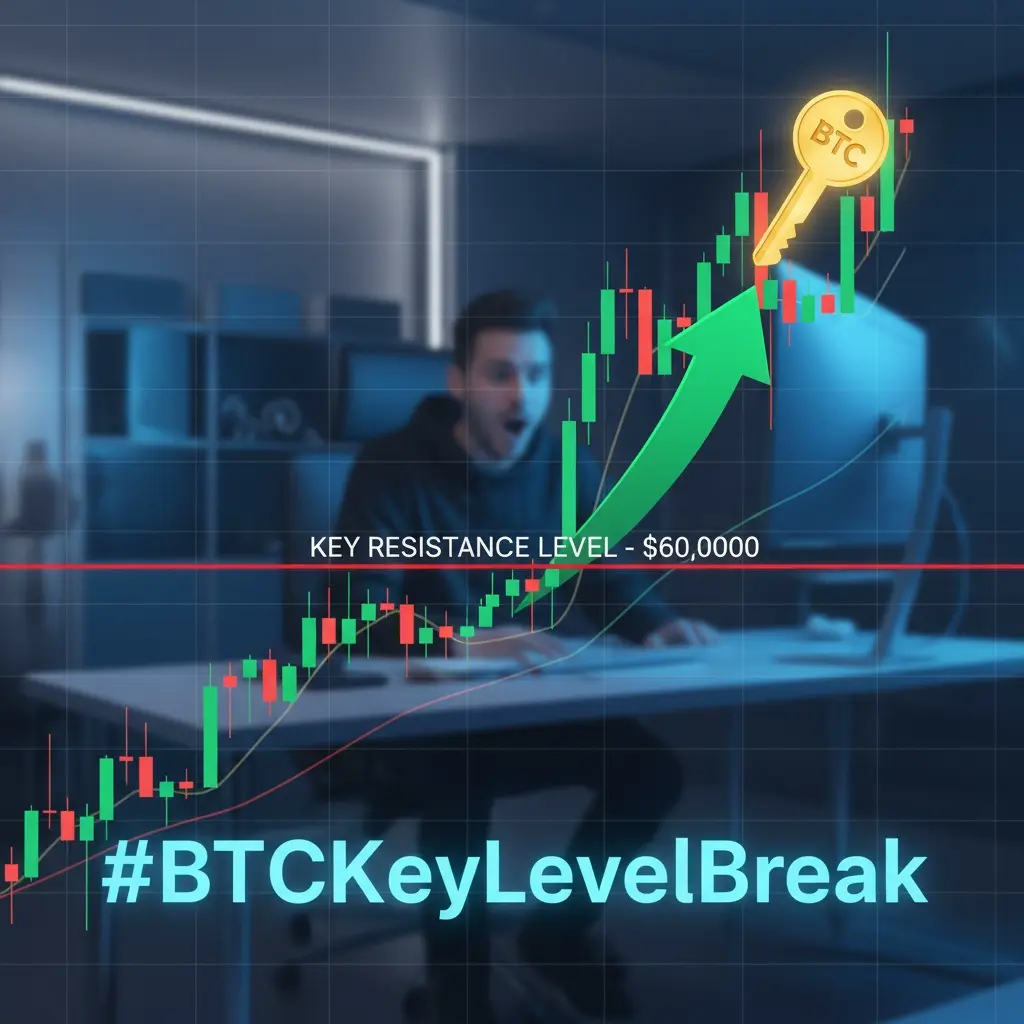
# BTCKeyLevelBreak
5.79K
BTC tested the $76K area where heavy trading activity sits. Is this a technical pullback or a warning sign? What levels are you watching?
AylaShinex
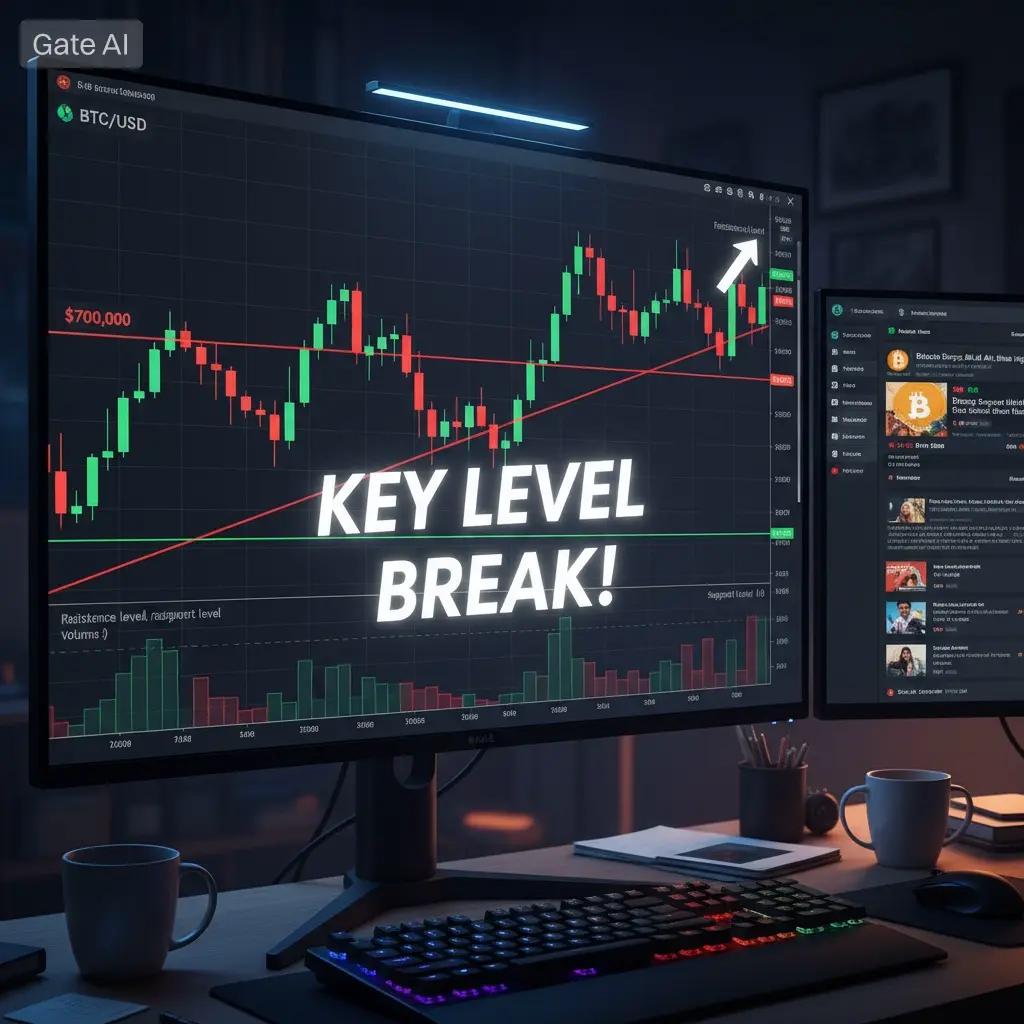
#BTCKeyLevelBreak #BTCKeyLevelBreak 🚨📉
Bitcoin just lost a level that mattered.
When a key support breaks, it’s not just a price move — it’s a shift in market structure and psychology. The $80K zone was holding momentum. Losing it opens the door to deeper liquidity hunts.
What this means:
🔹 Stop-loss clusters get triggered
🔹 Short-term sentiment flips bearish
🔹 Volatility expands rapidly
🔹 Weak hands exit, strong hands observe
Now the focus shifts to the next demand zone. If BTC stabilizes and reclaims the broken level quickly, this becomes a fake breakdown. If not, consolidation or furt
BTC2,02%
- Reward
- 3
- 3
- Repost
- Share
xxx40xxx:
2026 GOGOGO 👊View More
Fear & Greed Index Hits 14 - Extreme Fear Territory
😨 Market Sentiment at Lowest Level of 2026
The Crypto Fear & Greed Index plunged to 14 on January 30 and remains in "extreme fear" territory at 16. This is the lowest reading of 2026.
What This Index Measures:
It tracks sentiment across social media, trading volume, market volatility, and surveys. When it hits "extreme fear" (below 20), it often signals a bottom is near.
Why This Is Bullish (Contrarian):
Markets don't bottom when everyone is optimistic—they bottom when everyone has given up. When fear is this extreme:
- Retail investors are
BTC2,02%

- Reward
- 3
- 1
- Repost
- Share
Thynk :
:
2026 GOGOGO 👊#BTCKeyLevelBreak
Multi-Timeframe Technical Table
🧭 Market Context
Bitcoin (BTC) is currently trading near critical resistance zones following a strong recovery phase. Market sentiment remains cautious, with the Fear & Greed Index at 14 (Extreme Fear), signaling elevated volatility and emotionally driven price behavior.
📈 Price Overview
Metric
Value
Current Price
78,804.60 USDT
Market Sentiment
Extreme Fear (14)
Market State
High Volatility / Decision Zone
🧱 Key Levels by Timeframe
Timeframe
Support (USDT)
Resistance (USDT)
Price Position*
15 Min
77,629.83
79,164.27
76.6%
1 Hour
76,531.70
BTC2,02%
- Reward
- 3
- 6
- Repost
- Share
AylaShinex:
Happy New Year! 🤑View More
#BTCKeyLevelBreak
The start of February 2026 has emerged as a defining moment for Bitcoin’s price structure, sending powerful signals across crypto markets and investor sentiment. After a period of range trading and tentative recovery attempts, Bitcoin has recently broken below critical support levels, prompting renewed debate about trend direction, technical integrity, and what the next breakout bullish or bearish could mean for market participants. The hashtag #BTCKeyLevelBreak captures this tension: a market at a crossroads defined by key structural price levels and shifting momentum.
Curr
- Reward
- 4
- 11
- Repost
- Share
Falcon_Official:
HODL Tight 💪View More
#BTCKeyLevelBreak
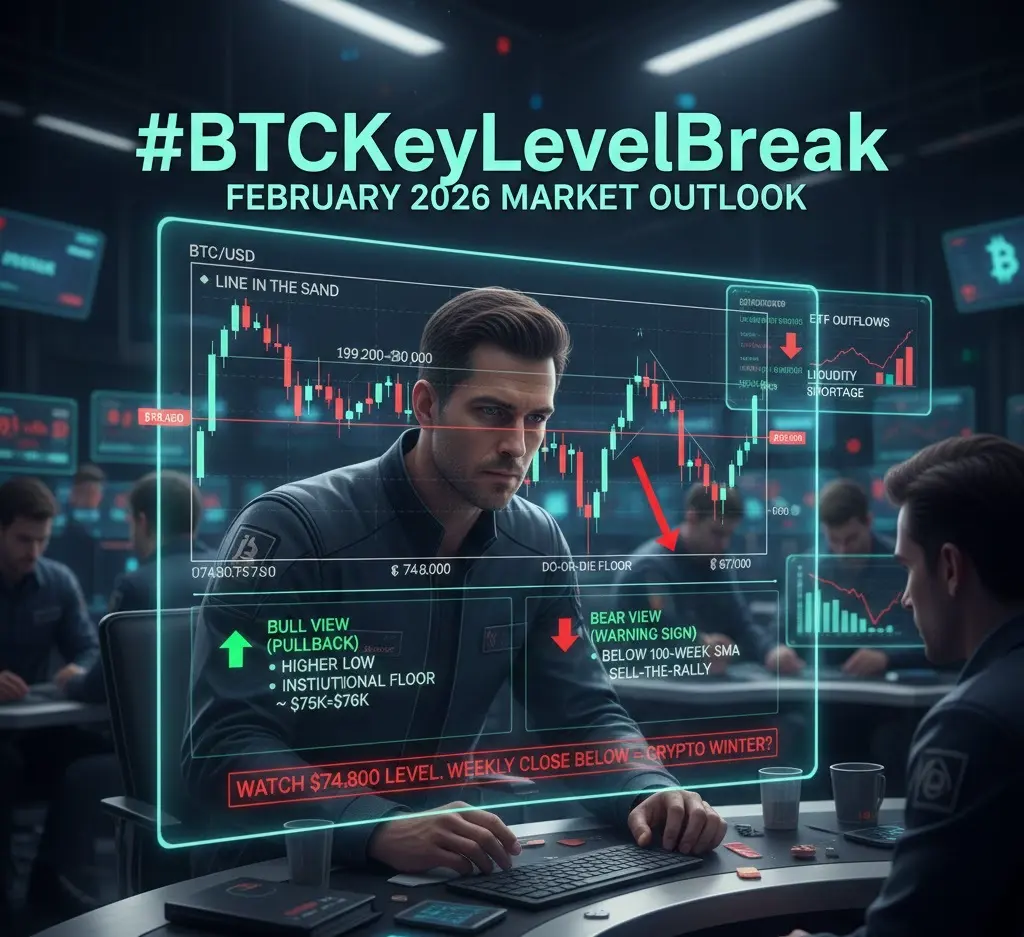
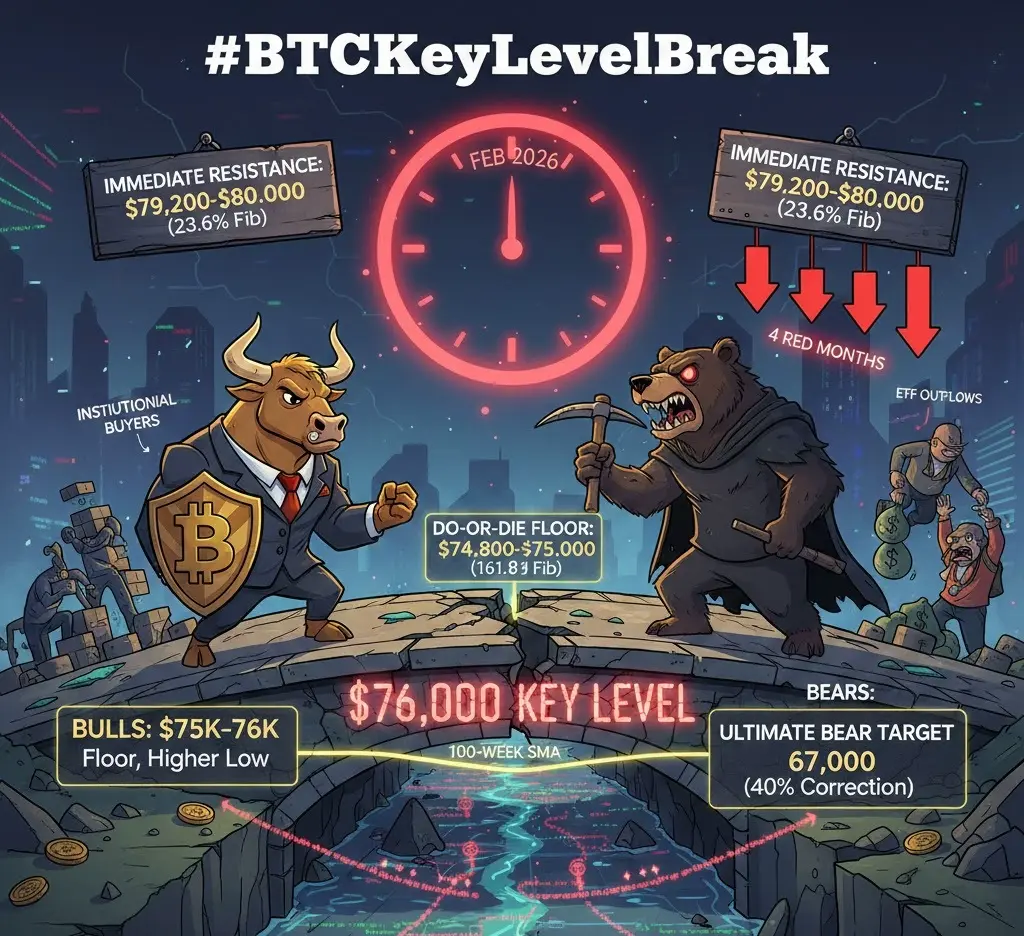
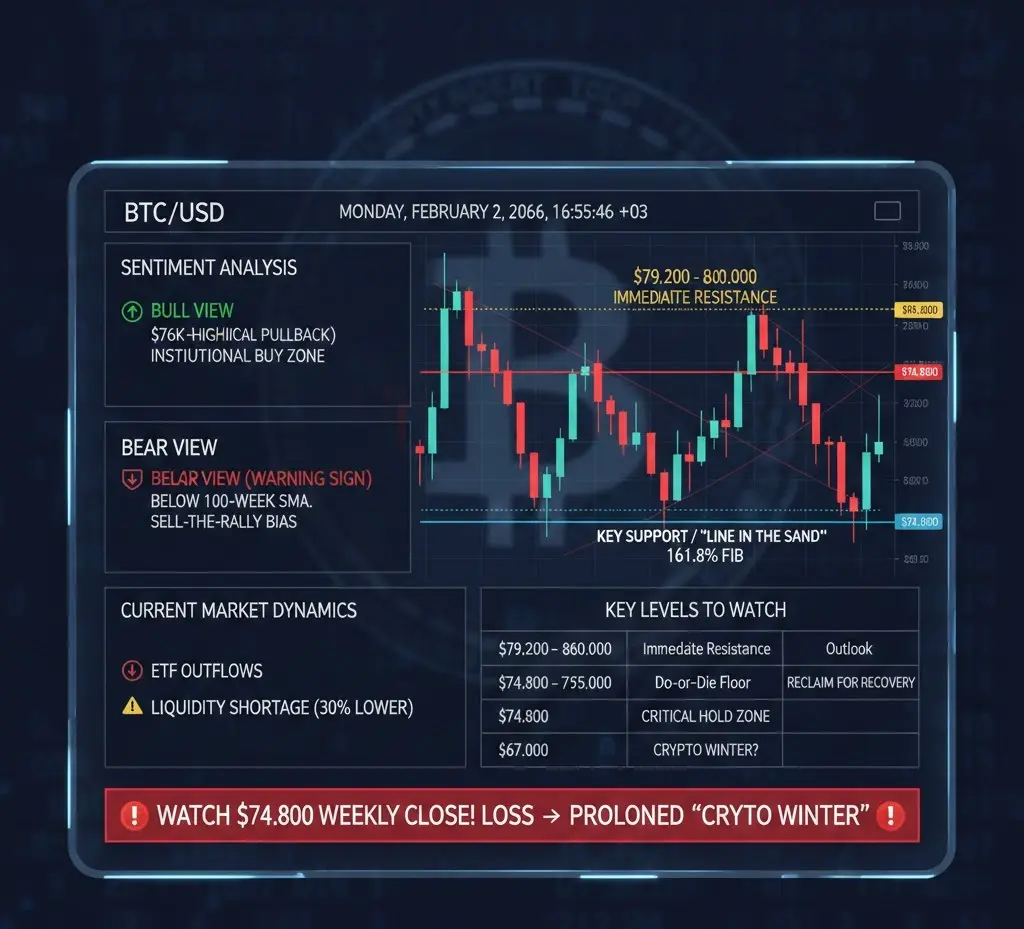
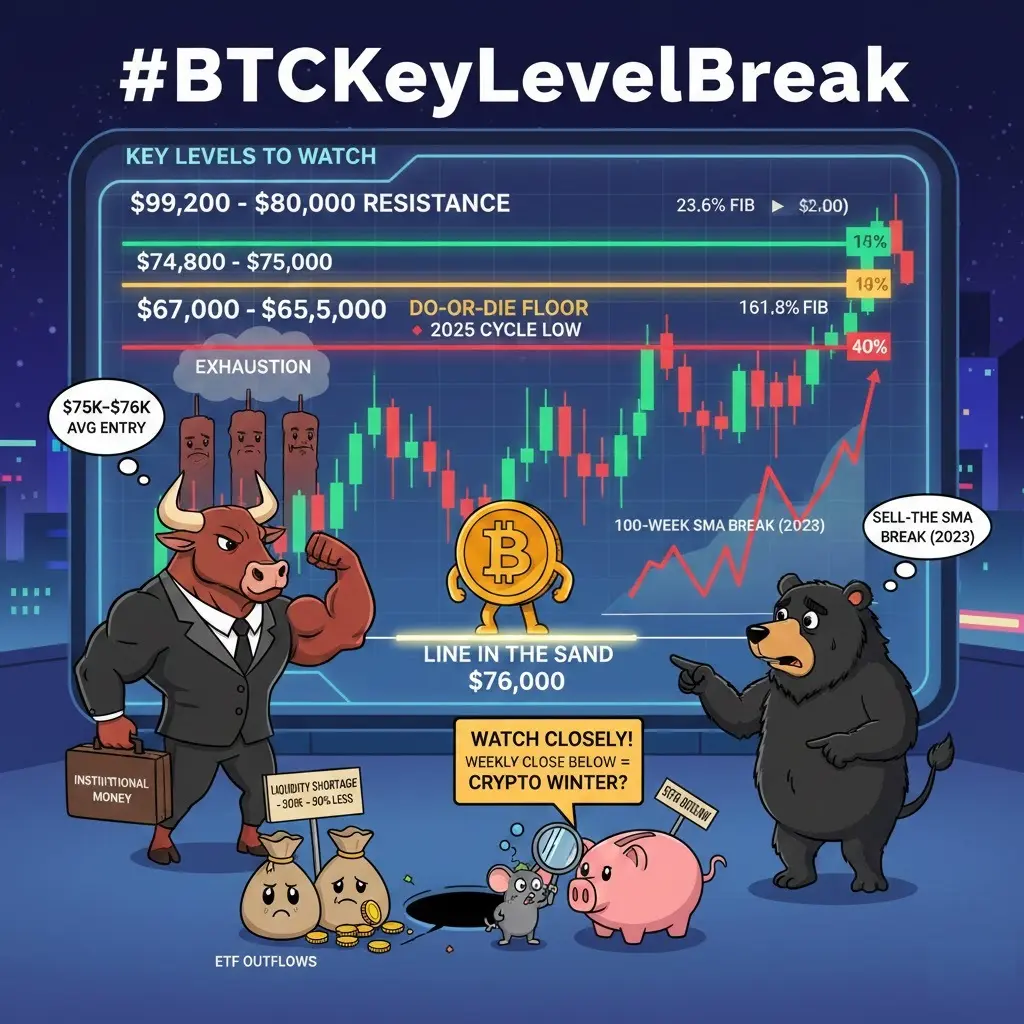
As of early February 2026, Bitcoin's interaction with the $76,000 area is more than just a random number—it’s a "line in the sand" for the current market cycle.
Whether this is a healthy pullback or a structural warning sign depends on how the daily and weekly candles close relative to this zone.
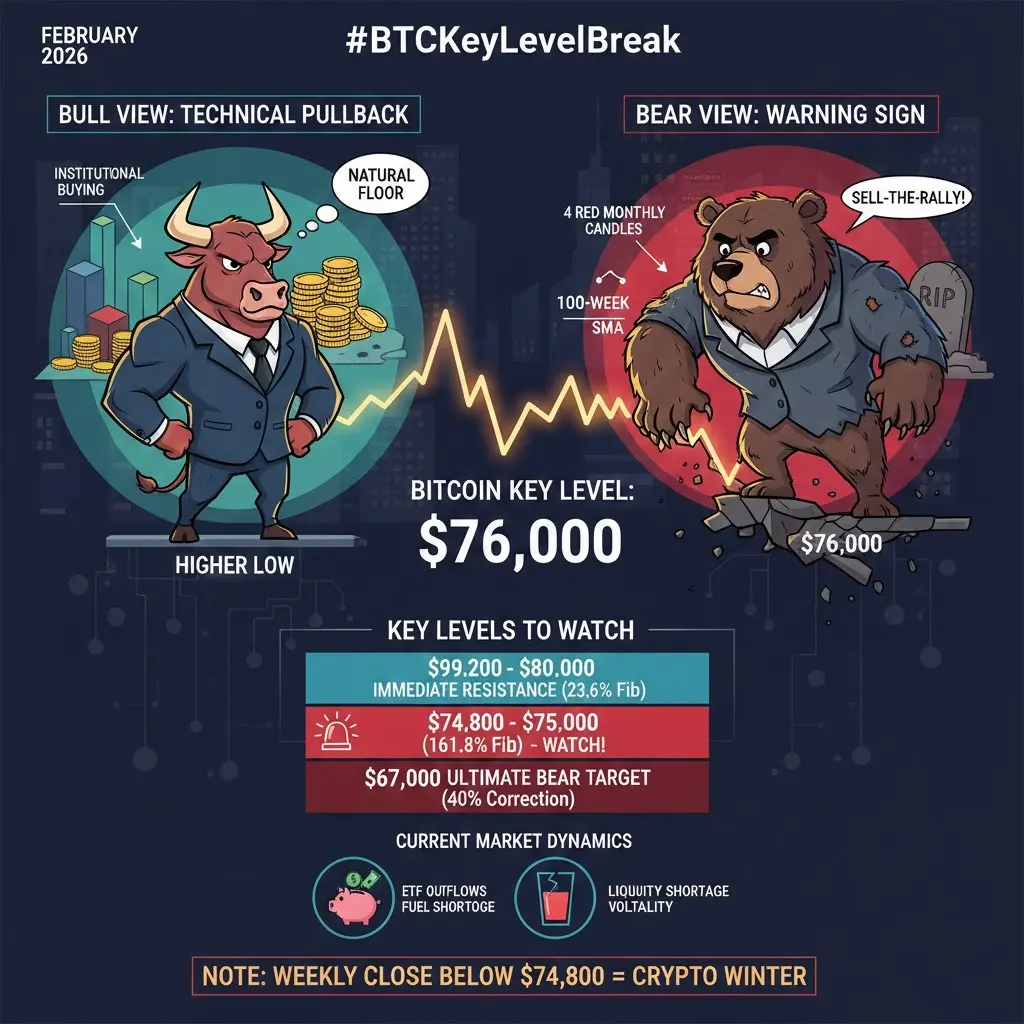
Technical Pullback or Warning Sign?
Currently, the sentiment is leaning toward a structural correction. Bitcoin has faced a rare streak of four consecutive red monthly candles as of January 2026, suggesting significant exhaustion.
The "Bull" View (Technical Pullback): Bulls argu
As of early February 2026, Bitcoin's interaction with the $76,000 area is more than just a random number—it’s a "line in the sand" for the current market cycle.
Whether this is a healthy pullback or a structural warning sign depends on how the daily and weekly candles close relative to this zone.
Technical Pullback or Warning Sign?
Currently, the sentiment is leaning toward a structural correction. Bitcoin has faced a rare streak of four consecutive red monthly candles as of January 2026, suggesting significant exhaustion.
The "Bull" View (Technical Pullback): Bulls argu
BTC2,02%
- Reward
- 13
- 14
- Repost
- Share
Discovery:
Happy New Year! 🤑View More
#BTCKeyLevelBreak
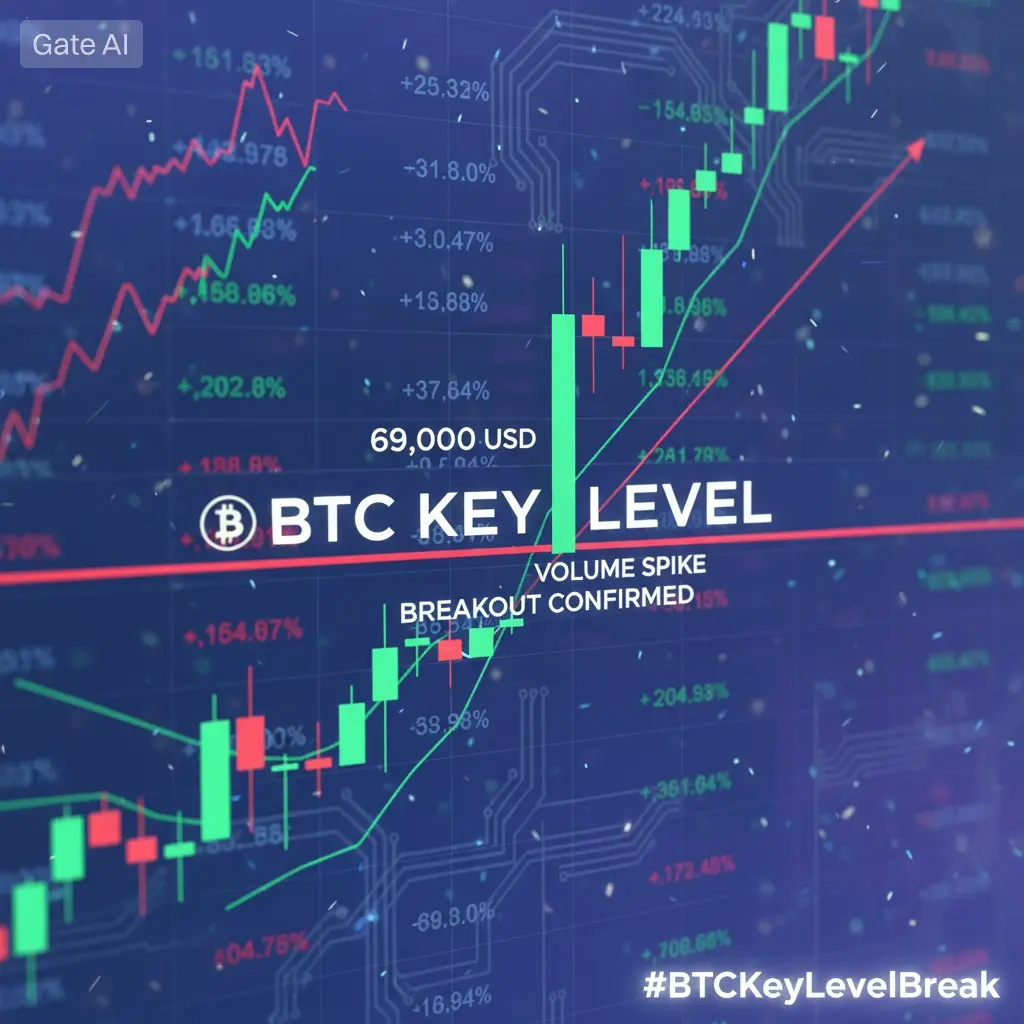
BTC Key Level Break: Assessing the $76K Test and Market Implications
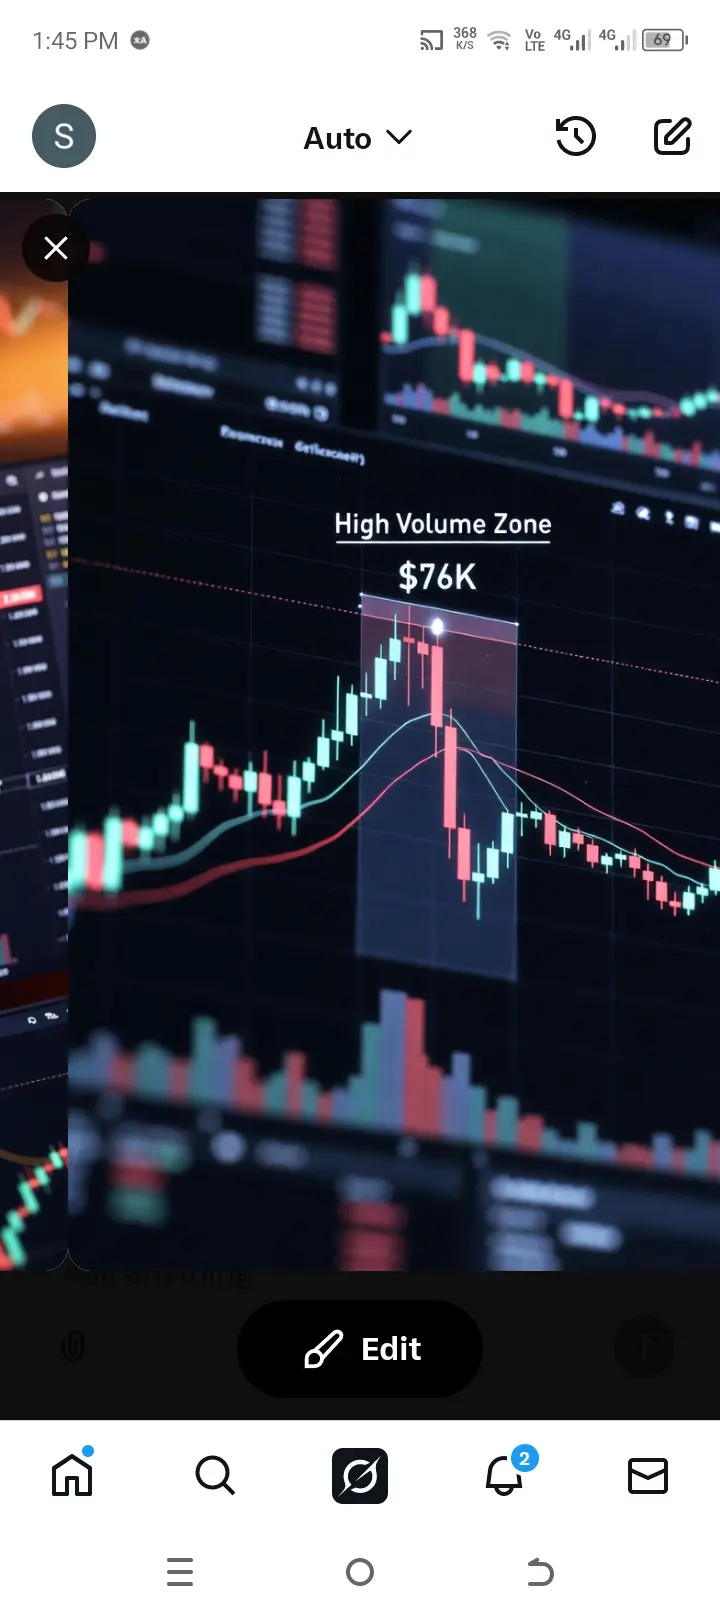
Bitcoin recently tested the $76,000 area, a zone that has historically seen heavy trading activity and liquidity concentration. This level has acted as a pivot multiple times in the past, making it a critical area for both bulls and bears. The question now is whether this move represents a healthy technical pullback or a warning signal of deeper weakness. Understanding the market context, volume dynamics, and support/resistance interplay is essential for positioning effectively in the near term.
Technical A
BTC Key Level Break: Assessing the $76K Test and Market Implications
Bitcoin recently tested the $76,000 area, a zone that has historically seen heavy trading activity and liquidity concentration. This level has acted as a pivot multiple times in the past, making it a critical area for both bulls and bears. The question now is whether this move represents a healthy technical pullback or a warning signal of deeper weakness. Understanding the market context, volume dynamics, and support/resistance interplay is essential for positioning effectively in the near term.
Technical A
BTC2,02%
- Reward
- 5
- 10
- Repost
- Share
Luna_Star:
Happy New Year! 🤑View More
#BTCKeyLevelBreak
Bitcoin at a Crossroads – Storm or Springboard?
The start of February 2026 has been highly volatile and tense for Bitcoin. The market is going through a critical "breakout" moment where technical analysis clashes with macroeconomic expectations. The #BTCKeyLevelBreak hashtag is currently at the top of every investor's watchlist.
Here are the hottest developments shaking the market as of February 2026 and the critical levels Bitcoin has breached:
1. A Sharp Descent Below $80,000
At the end of January, Bitcoin broke the $80,000 barrier to the downside, triggering a massive

- Reward
- 7
- 7
- Repost
- Share
xxx40xxx:
Thank you for the information🙏🙇🙇🙇View More
#BTCKeyLevelBreak 🚀
Why Bitcoin’s Latest Move Could Define the Next Market Phase
Bitcoin has once again captured the market’s attention with a decisive key level break, signaling that a major shift may be underway. In crypto markets, key levels are not just numbers on a chart they represent collective psychology, liquidity zones, and areas where bulls and bears fight for control. When Bitcoin breaks such a level with conviction, history shows it often sets the tone for the weeks or even months ahead.
What Is a Key Level and Why It Matters
A key level is typically a strong support or resistanc
BTC2,02%

- Reward
- 5
- 8
- Repost
- Share
MissCrypto:
Watching Closely 🔍️View More
#BTCKeyLevelBreak
📉 #BTCKeyLevelBreak — 2 Feb 2026 Market Update
Hello everyone! 👋
Bitcoin is making headlines today as it breaks key technical levels, signaling renewed volatility and a critical shift in market structure.
🔻 Price Breakdown:
Bitcoin has slipped below the $75,000–$80,000 range, breaking important support zones that had previously held since late 2025. This move reflects accelerating selling pressure and increased risk aversion in crypto markets.
📉 Why It Matters:
• Breaking below major supports like $80K–$78K indicates bearish momentum taking over in the short term.
• Lo
- Reward
- 2
- 3
- Repost
- Share
AylaShinex:
Buy To Earn 💎View More
#BTCKeyLevelBreak Bitcoin just tapped the $76K level — a zone loaded with heavy trading activity.
Is this a routine technical pullback within a healthy market structure 📊
or a warning sign that momentum is starting to fade? ⚠️
🔍 Levels that matter right now:
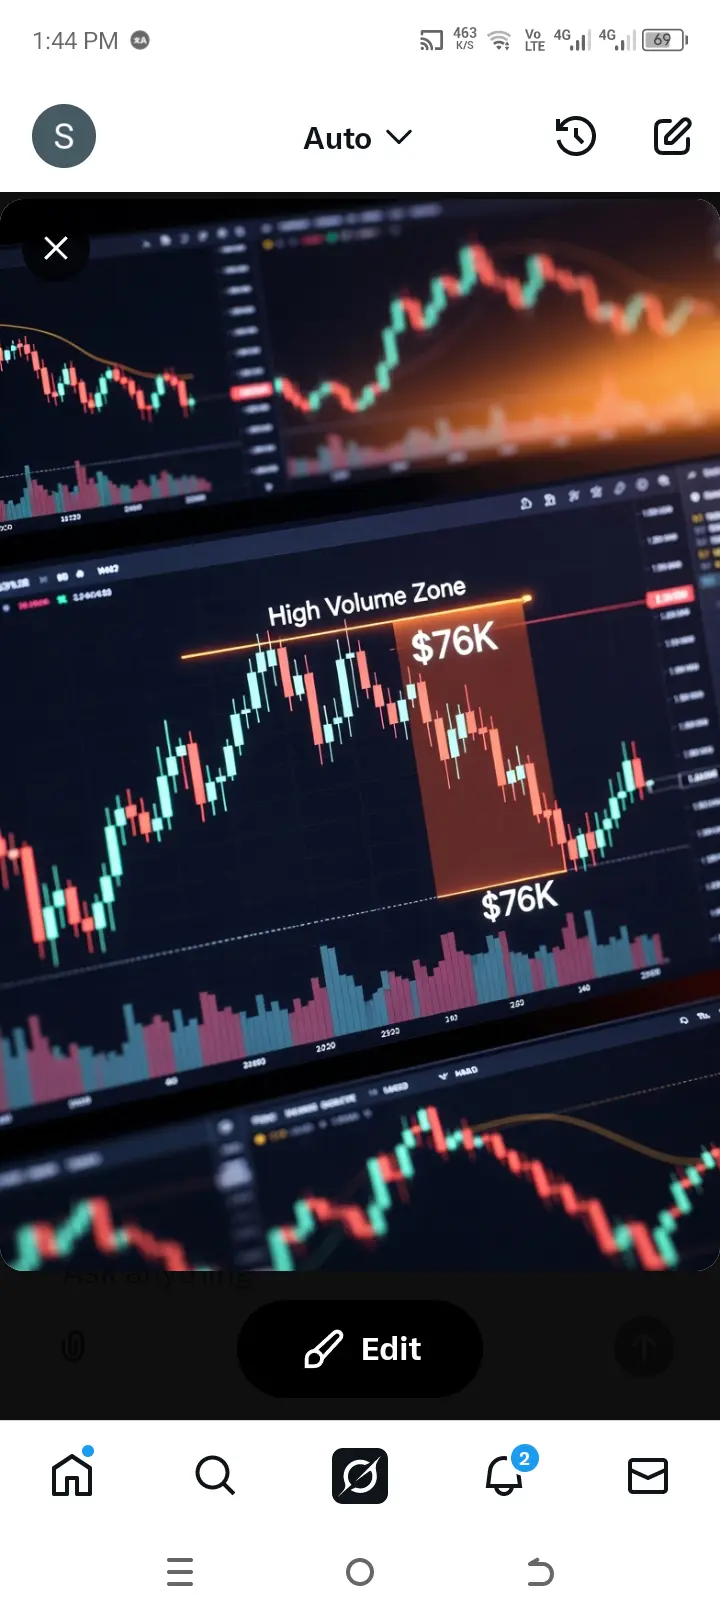
$76K–$74K: Critical demand & high-volume support
$72K: Breakdown level — loss here could invite deeper retracement
$80K+: Reclaim needed to restore bullish momentum
🛡️ Market approach:
In volatile conditions, drawdown control comes first.
Patience + confirmation > chasing price.
Volatility doesn’t destroy capital — poor risk management
Is this a routine technical pullback within a healthy market structure 📊
or a warning sign that momentum is starting to fade? ⚠️
🔍 Levels that matter right now:
$76K–$74K: Critical demand & high-volume support
$72K: Breakdown level — loss here could invite deeper retracement
$80K+: Reclaim needed to restore bullish momentum
🛡️ Market approach:
In volatile conditions, drawdown control comes first.
Patience + confirmation > chasing price.
Volatility doesn’t destroy capital — poor risk management
BTC2,02%
- Reward
- 7
- 5
- Repost
- Share
BeautifulDay:
2026 GOGOGO 👊View More
Load More
Join 40M users in our growing community
⚡️ Join 40M users in the crypto craze discussion
💬 Engage with your favorite top creators
👍 See what interests you
Trending Topics
381.32K Popularity
10.46K Popularity
10.01K Popularity
5.79K Popularity
4.07K Popularity
6.58K Popularity
3.97K Popularity
4.52K Popularity
2.25K Popularity
43 Popularity
55.11K Popularity
69.87K Popularity
20.75K Popularity
27.02K Popularity
220.26K Popularity
News
View MoreThree men in France suspected of kidnapping a 74-year-old man to extort his son’s cryptocurrency assets, tortured him for nearly 16 hours, and released the hostage after realizing they had "caught the wrong person."
12 m
Trump releases good news on tariffs, US tariffs on India reduced to 18%
23 m
U.S. stock indices extend gains, with the Dow Jones rising by 1%
33 m
Circle has increased the issuance of 750 million USDC on the Solana network.
1 h
Circle Transfers 750 Million USDC
1 h
Pin