Scan to Download Gate App
qrCode
More Download Options
Don't remind me again today
MayFortuneBeWithYouAt
vip
Age 0.2 Year
Peak Tier 6
Create your own 【Pixiu Battle Method】 as a stable player, must keep an eye on the market during 【live trading】, slow is fast, can do day trading, 【mystical control the market trend】 means living longer to earn more.
Pin
Pixiu battle method, metaphysics control the market trend, starting from 100, I want to break the empty walls with my fists, a ten thousand times must be realized.
View Original
  • Reward
  • 6
  • Repost
  • Share
VeryEmotionallyExhausted.vip:
Does the streamer have any teaching? 😅
View More
I've been officially recognized and praised by Sesame, and I will work even harder.
View Original
post-image
  • Reward
  • Comment
  • Repost
  • Share
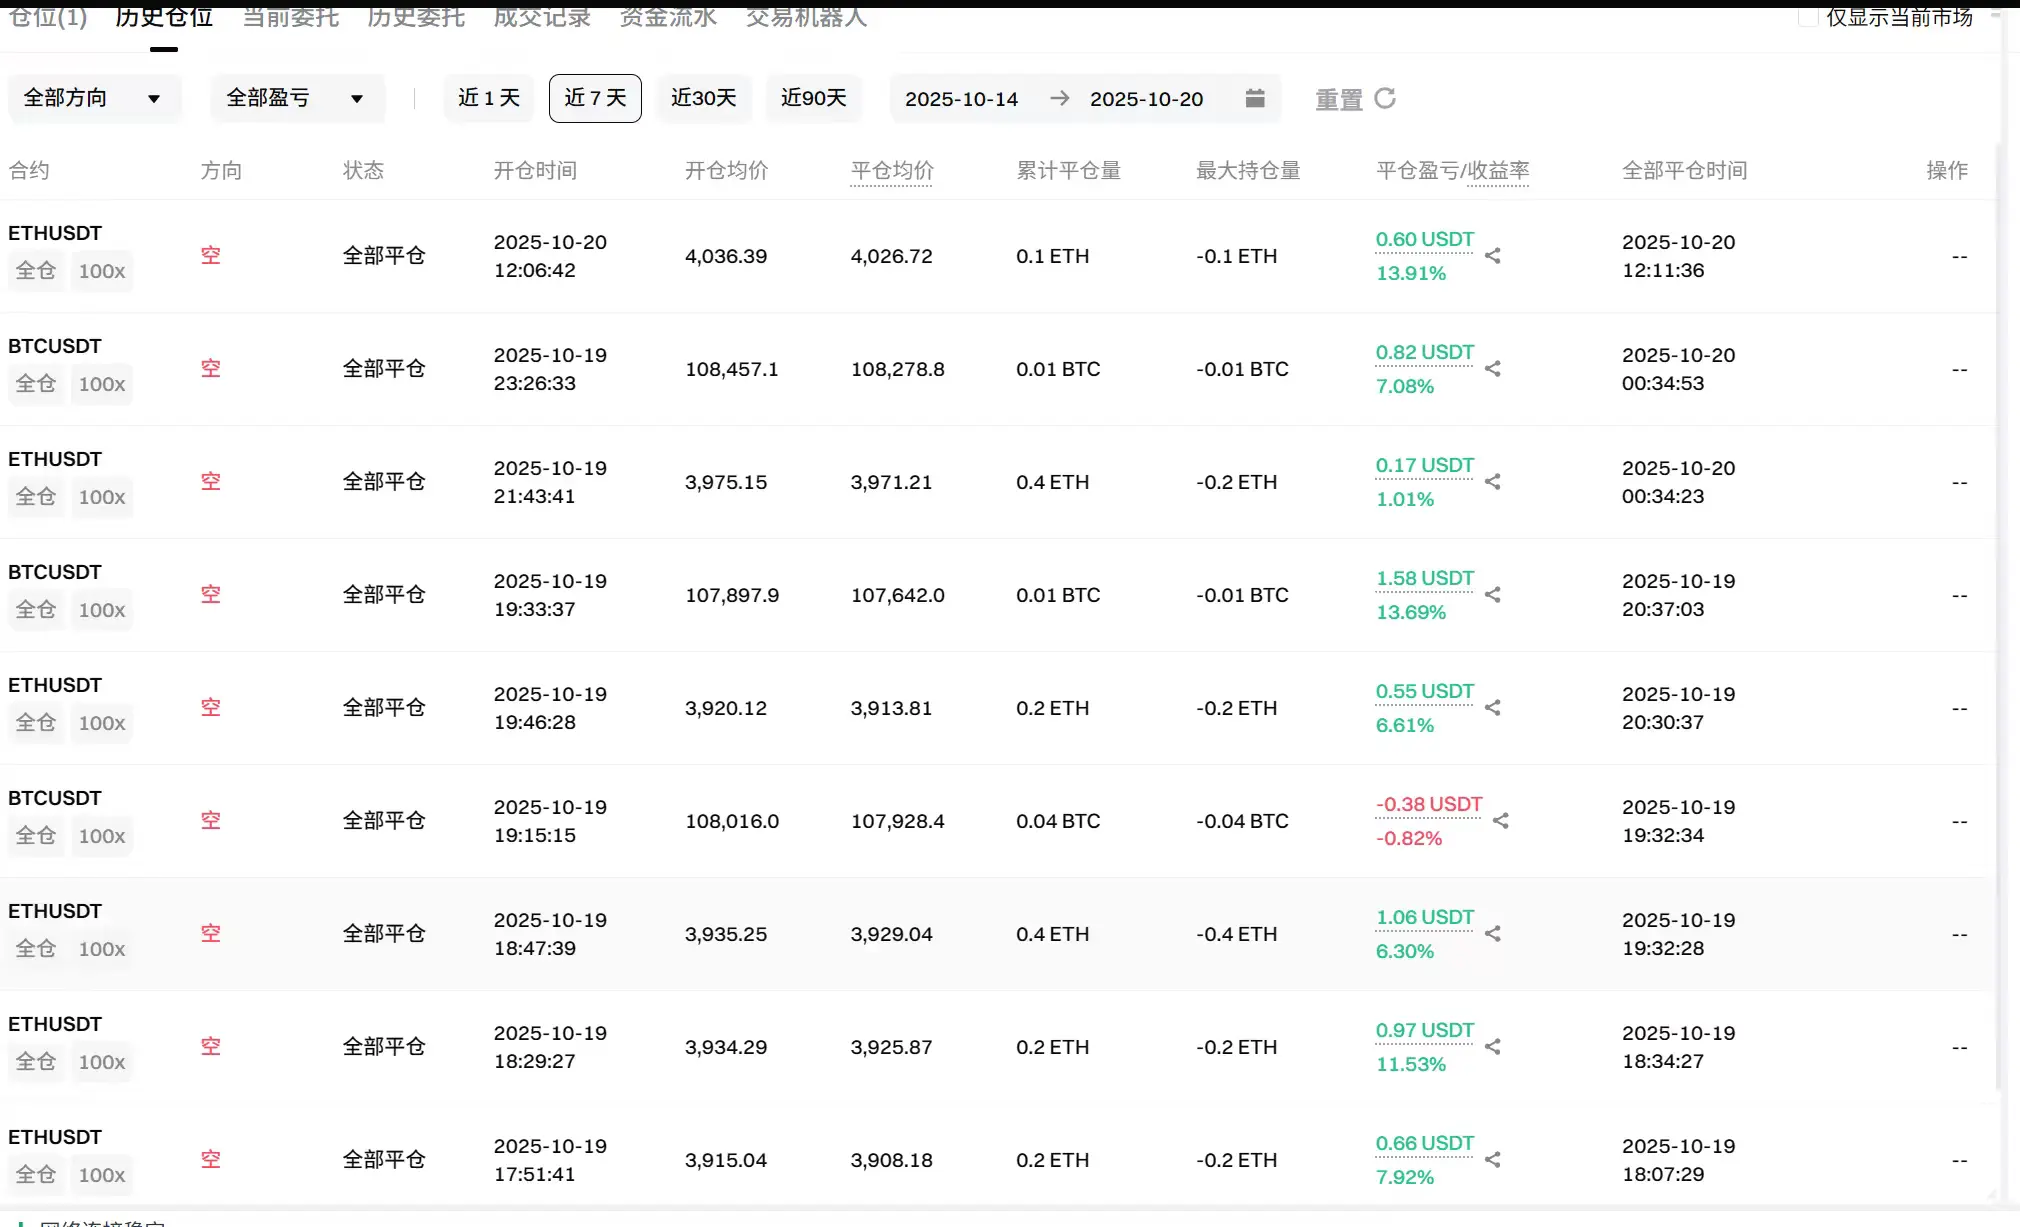
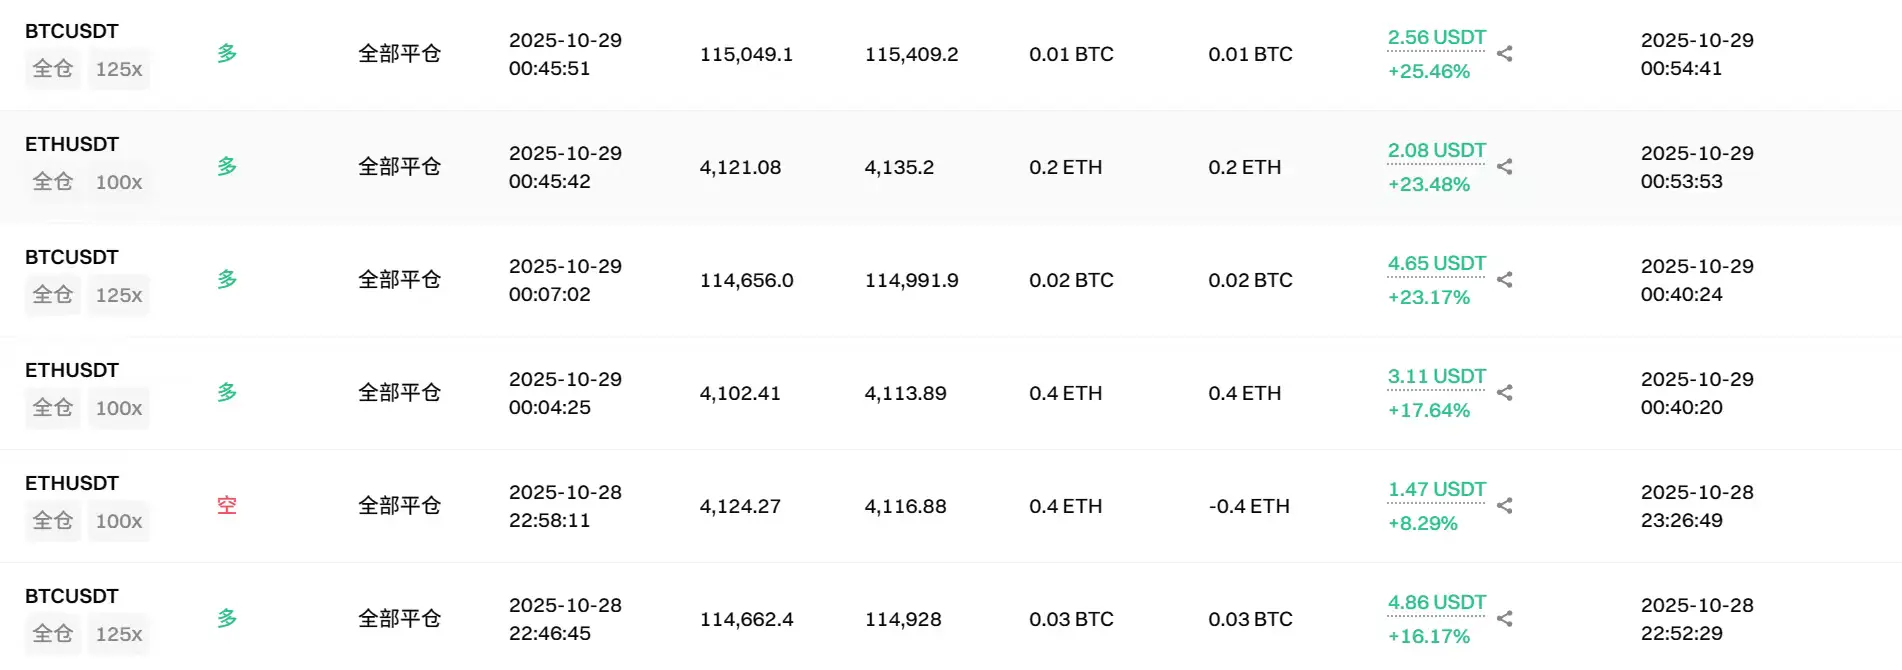
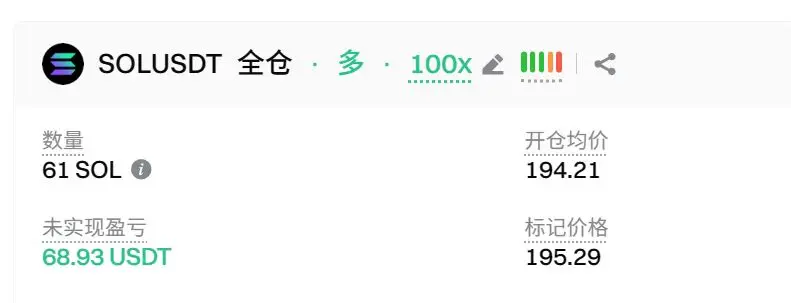
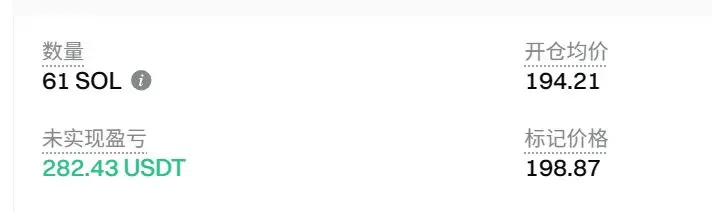
[Live Trading] [Pixiu Strategy] [Metaphysics Control] Started with 20, now it's almost 10,000 dollars. The goal is 10,000x. Breaking out of poverty with both fists. Brothers and sisters, welcome to witness this together. It was especially tough at the beginning, but I've made it step by step. Time flies, and looking back, the memories remain in the dim light. Keep going, persevere, as long as you keep moving forward, you'll reach your destination. A journey of a thousand miles begins with a single step.
View Original
post-image
post-image
post-image
post-image
post-image
post-image
  • Reward
  • Comment
  • Repost
  • Share
Interpret the ETH trend using a 1-hour Candlestick period.
[Price Trend Analysis]
1.Candlestick Patterns:
The daily chart shows a series of consecutive large bearish candles, with the price dropping from 3063 to 2833, forming a clear downtrend.
The hourly chart has formed a short-term double top structure near 2846, and then quickly broke below the 2800 integer level.
2. Technical Indicators:
MACD: The daily DIF and DEA continue to decline, with the MACD histogram expanding to -236, indicating strong bearish momentum. The hourly MACD accelerates downward after a death cross below the zero line
ETH1.47%
View Original
  • Reward
  • Comment
  • Repost
  • Share
Interpret the ETH trend using a 1-hour Candlestick cycle.
[Price Trend Analysis]
1.Candlestick patterns:
After testing the support near 3050 twice on the 1-hour level, there was a rebound, forming a short-term double bottom structure. However, there is significant selling pressure at the 3100 round number.
The daily chart has formed a "Descending Three Methods" pattern, after a large bearish candlestick on November 17, it rebounded for three consecutive days without breaking the previous high, and on the 19th it closed bearish again confirming the downward trend.
2. Technical Indicators:
MACD:
ETH1.47%
View Original
  • Reward
  • 2
  • Repost
  • Share
GateUser-8ba823b1vip:
Just go for it💪
View More
Interpret the ETH trend using a 1-hour Candlestick period.
[Price Trend Analysis]
1.Candlestick Patterns:
Recently, the 1-hour level has seen a series of upward candlesticks, breaking through the previous high of 3154.6 and then retreating to test the support at the integer level of 3100, forming a short-term ascending channel with higher highs and higher lows.
On the daily level, a long lower shadow bullish candlestick was formed on November 18 (2946.56→3149.09), indicating strong support from bulls below 3000, but the EMA120 (3166.21) still poses resistance.
2. Technical Indicators:
MACD: Th
ETH1.47%
View Original
  • Reward
  • 2
  • Repost
  • Share
PeaceAndHappiness1111vip:
Just go for it💪
View More
[Live trading] [Pixiu battle method] [Metaphysical control the market trend] Start with 100, aiming for ten thousand times, breaking through the bare walls with double fists, making a fortune, making a fortune, brothers and sisters, it's time to wrap up.
View Original
  • Reward
  • Comment
  • Repost
  • Share
Interpret the ETH trend using a 1-hour Candlestick period.
[Price Trend Analysis]
1.Candlestick Pattern:
A long lower shadow appeared on the 1-hour level (21:00 low rebound at 3093.49), indicating that there is buying support at the 3100 round number.
The daily candlestick has shown three consecutive days of long upper and lower shadows (November 15-17), indicating fierce competition between bulls and bears.
2. Technical Indicators:
MACD: The 1-hour level DIF crosses above DEA (22:00 2.63>5.04), but the histogram remains negative (-4.83), and the daily MACD continues to be underwater (-50.04)
ETH1.47%
View Original
  • Reward
  • Comment
  • Repost
  • Share
Interpret ETH trend with a 1-hour candlestick period
[Price Trend Analysis]
1. K-line patterns:
After a long lower shadow tested the bottom at 3137 on the 1-hour level, a rebound occurred, indicating strong support exists below 3150.
The daily chart has formed three consecutive candlesticks with long upper and lower shadows, creating a spinning top pattern, indicating intense competition between bulls and bears.
The monthly chart shows a bearish engulfing pattern, with EMA120 (3273) becoming a key resistance.
2. Technical Indicators:
MACD: After a bottom divergence appears at the 1-hour level,
ETH1.47%
View Original
  • Reward
  • Comment
  • Repost
  • Share
Interpret the ETH trend using a 1-hour Candlestick period.
[Price Trend Analysis]
1.Candlestick Patterns:
1-hour level short-term rebound: Quickly rose from the low of 3090 on November 15 to 3230, forming a V-shaped reversal, currently oscillating around the price of 3210. Key resistance level at 3230 (recent high), support level at 3180 (coinciding with EMA30 and a round number).
Daily level bottom reversal: On November 15, a long bullish candle (3110-3230) broke through the previous day's bearish candle body, with increased trading volume, forming a bullish engulfing pattern. Key resista
ETH1.47%
View Original
  • Reward
  • Comment
  • Repost
  • Share
[Live Trading][Pixiu Strategy][Metaphysics Control the Market Trend] Making a fortune, making a fortune, Pixiu magic, boundless power, starting from 100, aiming for ten thousand times, breaking through the poverty of a bare house with both fists. Brothers and sisters, live trading online for a long time every day, come and witness.
View Original
post-image
  • Reward
  • 3
  • Repost
  • Share
IAmWithTheGodOfvip:
How much capital does the streamer have? The position is so large.
View More
Interpret the ETH trend using a 1-hour Candlestick period.
[Price Trend Analysis]
1.Candlestick pattern:
The 1-hour level showed consecutive bearish candles, with the price accelerating downward after breaking through the key round number 3150, testing a low of 3070 before rebounding, but failing to stabilize above 3150, forming a weak oscillation structure.
The daily level has seen two consecutive days of large bearish candlesticks (November 13-14), completely engulfing the gains of the previous five trading days, forming a bearish engulfing pattern.
2. Technical Indicators:
MACD: The 1-hour
ETH1.47%
View Original
  • Reward
  • Comment
  • Repost
  • Share
Interpret the ETH trend with a 1-hour Candlestick period.
[Price Trend Analysis]
1. Candlestick patterns:
A long upper shadow bearish candlestick appeared on the 1-hour chart (from 21:00, 3501 dropped to 3426), indicating strong selling pressure in the 3550 area.
For three consecutive days, the daily level has closed with long shadows, forming a fluctuation range of 3400-3565, with the low point of 3377 constituting key support.
The monthly EMA7 (3503) and the daily EMA120 (3486) form a double resistance.
2. Technical Indicators:
MACD: 1-hour DIF crosses below DEA (22:00 -6.9), daily chart mai
ETH1.47%
View Original
  • Reward
  • Comment
  • Repost
  • Share
Interpret ETH trend with a 1-hour Candlestick period
[Price Trend Analysis]
1.Candlestick pattern:
A long upper shadow appeared on the daily chart (the high point on November 9 was 3624.4, which fell to 3581.31), indicating strong selling pressure above 3600.
The hourly chart has failed to test the 3593-3593 area twice in a row (November 11, 20:00/19:00), forming a double top pattern.
The current price has broken below the previous low of 3528.8 (the low point on November 11 at 14:00), and the short-term trend shows a downward channel.
2. Technical Indicators:
MACD: The daily DIF and DEA persi
ETH1.47%
View Original
  • Reward
  • Comment
  • Repost
  • Share
[Live Trading][Pixiu Battle Method][Metaphysics Control the Market Trend] Started with 100, now 2300, aiming for ten thousand times, breaking through the empty walls with both fists, brothers and sisters, the broadcast has started, come and witness.
View Original
  • Reward
  • Comment
  • Repost
  • Share
[Live Trading][Pixiu Strategy][Control the Market Trend]
#ETH
Successfully bottomed out again, the chips are really fragrant. Brothers and sisters, have you bottomed out?
Starting with 100, now at 2300, I want to break through the bare walls with my bare fists, achieving ten thousand times is a must.
ETH1.47%
View Original
  • Reward
  • Comment
  • Repost
  • Share
[Live Trading] [Pixiu Trading Method] [Metaphysics Control the Market Trend]
#ETH
Made a fortune, made a fortune, brothers and sisters, it's time to pack up.
Starting from 100, now at 2300, I want to break through the bare walls with both fists, a ten thousand times increase must be achieved.
ETH1.47%
View Original
  • Reward
  • Comment
  • Repost
  • Share
[Live Trading][Pixiu Trading Strategy][Mystical Market Control] Successfully bought the dip on ETH again and gained 70 points in just half an hour, starting with 100, now 2300. I will break through the walls of poverty with both fists, and a ten thousand times return must be achieved #ETH .
ETH1.47%
View Original
  • Reward
  • Comment
  • Repost
  • Share
[Live Trading][Pixiu Strategy][Metaphysical Market Control] ETH successfully gained 100 points in just 1 hour, starting with 100, now at 2200. I will break through the poverty with my bare fists, a ten thousand times increase must be achieved #ETH .
ETH1.47%
View Original
post-image
  • Reward
  • Comment
  • Repost
  • Share
Interpret the ETH trend with a 1-hour Candlestick period.
[Price Trend Analysis]
1.Candlestick Patterns:
On the 1-hour timeframe, after a surge in volume from 3617 to 3657, a pullback has occurred, forming a phase-top structure. The 3580 integer level has been tested three times without breaking, forming the lower boundary of a consolidation range.
Since November 8, the daily level has seen three consecutive long shadow lines probing the bottom (3353, 3192, 3054), forming a bottom hammer candlestick pattern. The latest candlestick breaks above the 5-day moving average but is suppressed by the
ETH1.47%
View Original
  • Reward
  • Comment
  • Repost
  • Share
[Live Trading][Pixiu Battle Method][Mystical Market Control] Starting from 100, now 2000, aiming for 10,000 times, breaking through the walls of poverty with both fists, welcome brothers and sisters to witness together.
View Original
  • Reward
  • Comment
  • Repost
  • Share
  • Trending TopicsView More
  • Pin
Trade Crypto Anywhere Anytime
qrCode
Scan to download Gate App
Community
English
  • 简体中文
  • English
  • Tiếng Việt
  • 繁體中文
  • Español
  • Русский
  • Français (Afrique)
  • Português (Portugal)
  • Bahasa Indonesia
  • 日本語
  • بالعربية
  • Українська
  • Português (Brasil)