Scan to Download Gate App
qrCode
More Download Options
Don't remind me again today
AxelAdlerJr
vip
Age 2.4 Year
Peak Tier 0
No content yet
The first early signal marking the end of the bullish cycle was published on October 26 in Bitcoin Strategy & Full Market Analysis - W4 October 2025.
The second confirming signal arrived on November 14 and was covered in detail in Two Out of Three Metrics Have Triggered.
Today is November 21 - more than enough time to absorb the implications.
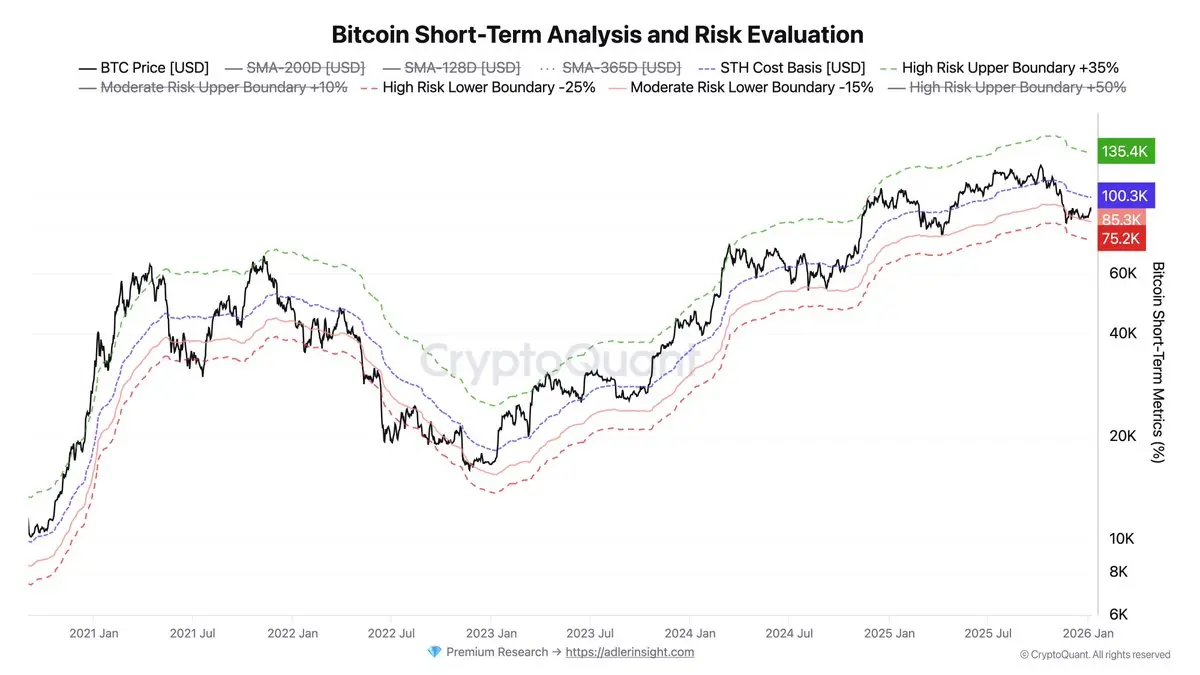
Should the macro backdrop remain impaired and regime-shift signals persist, Bitcoin may transition from mild consolidation into a more pronounced and extended corrective phase.
BTC1.01%
post-image
  • Reward
  • Comment
  • Repost
  • Share
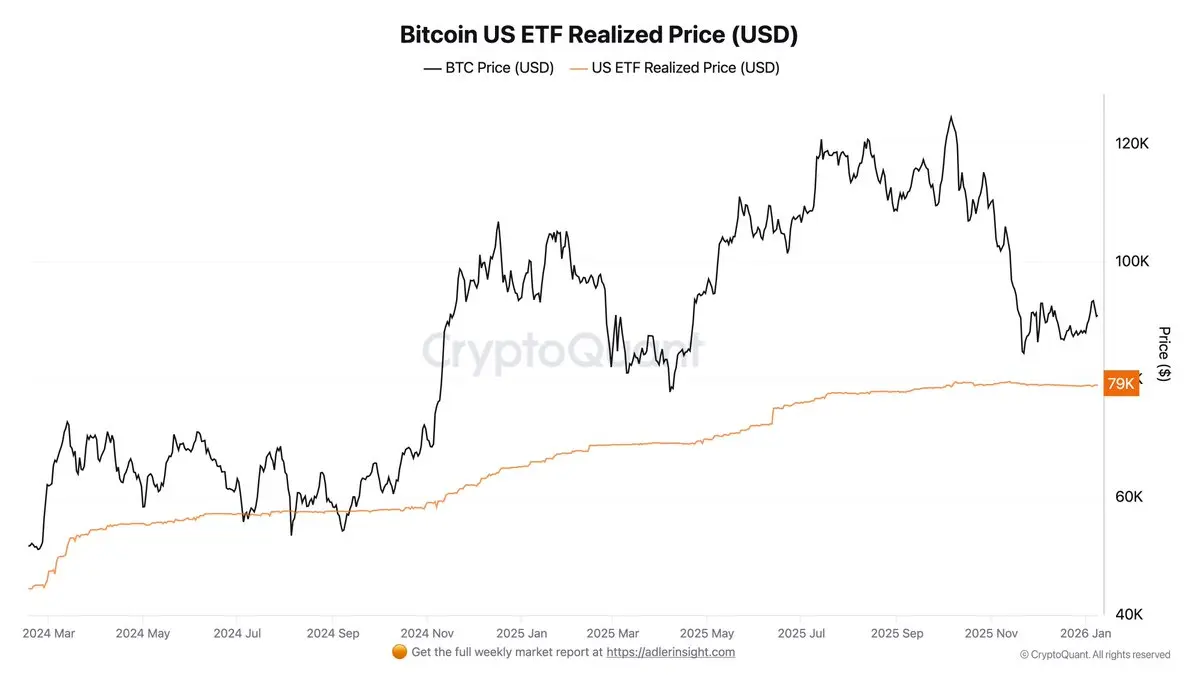
On top of that, pressure from US Spot ETF clients is also increasing. The chart shows the metric sliding into negative territory, with flows consistently remaining below zero. This dynamic reinforces selling pressure and increases the risk of a deeper correction.
post-image
  • Reward
  • Comment
  • Repost
  • Share
With the next full labor market report coming only after the December 9 FOMC meeting, the Fed will most likely keep rates unchanged through year-end.
post-image
  • Reward
  • Comment
  • Repost
  • Share
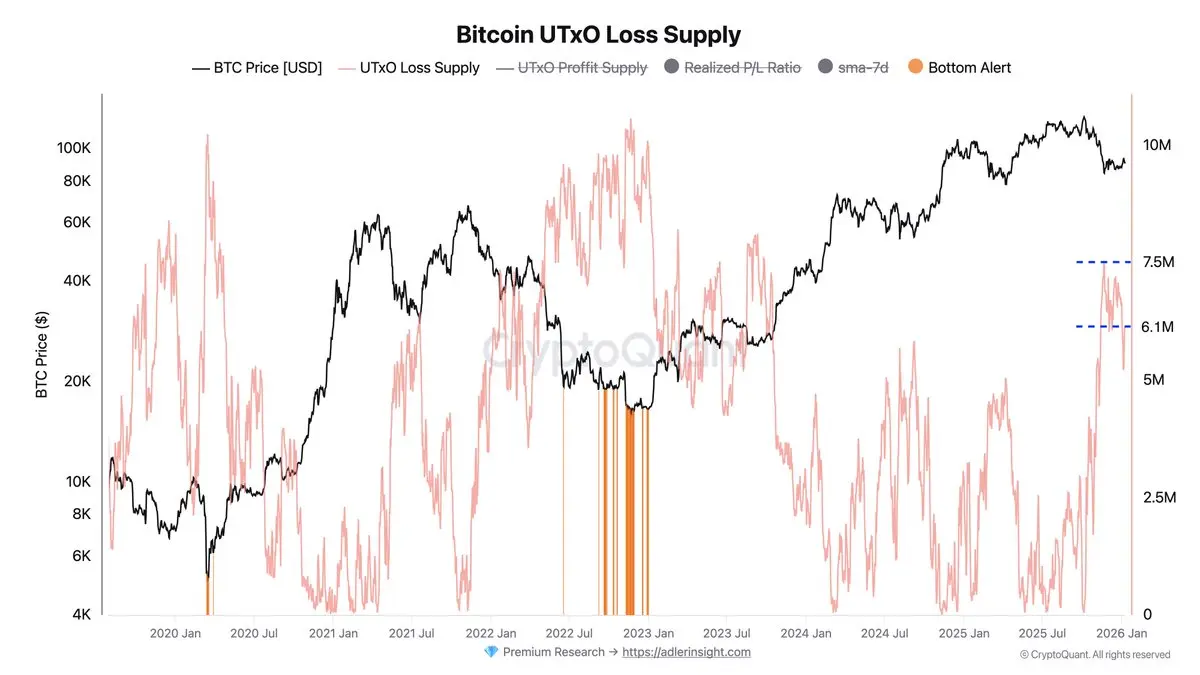
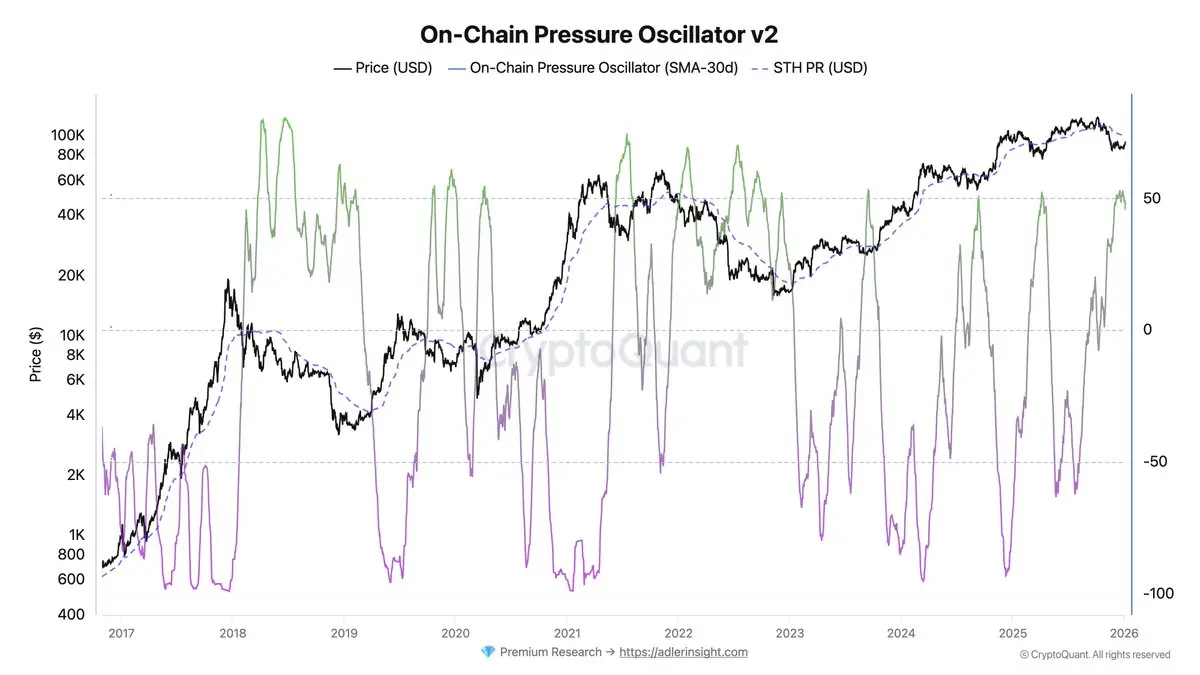
Until yesterday, short-term holders looked relatively stable. But we’ve now seen the first meaningful signs of stress, the Realized P/L component dropped to –1, indicating broad loss realization. This dynamic typically increases pressure on the spot market.
The chart clearly shows how similar spikes in STH panic occurred in July 2021 and during the 2022–2023 bear market, each time accompanying accelerated selling and deeper corrections.
You can read more about this model here:
post-image
  • Reward
  • Comment
  • Repost
  • Share
At yesterday’s 2025 Financial Stability Conference, Cleveland Fed President Beth Hammack said that cutting rates to support the labor market could prolong elevated inflation and increase financial-stability risks.
And the market’s reaction has already made that clear…
post-image
  • Reward
  • Comment
  • Repost
  • Share
Volatility during yesterday’s trading session:
VIX at 26.42 → a level consistent with structural stress
MOVE at 77.87 → a high-stress environment for the credit and bond market
VIX + MOVE = systemic Risk-Off
If these formulas aren’t clear, here’s an explanation:
post-image
  • Reward
  • Comment
  • Repost
  • Share
Dropped SQL of the Week #3 - today we break down why most analysts misread STH metrics and what real short-term holder momentum actually looks like.
post-image
  • Reward
  • Comment
  • Repost
  • Share
The Bureau of Labor Statistics has officially confirmed that it will not publish the October Employment Situation report. The reason is that the household survey (CPS) was not collected due to the government shutdown, meaning unemployment data for October does not exist and cannot be reconstructed retroactively.
The absence of October unemployment data leaves the market effectively blind to a key macro component: the labor market is the core of the Fed’s reaction function.
post-image
  • Reward
  • Comment
  • Repost
  • Share
Liquidations of long positions are at extreme levels for the past year. The metric has eased slightly at the moment, but it doesn’t change the overall picture.
  • Reward
  • Comment
  • Repost
  • Share
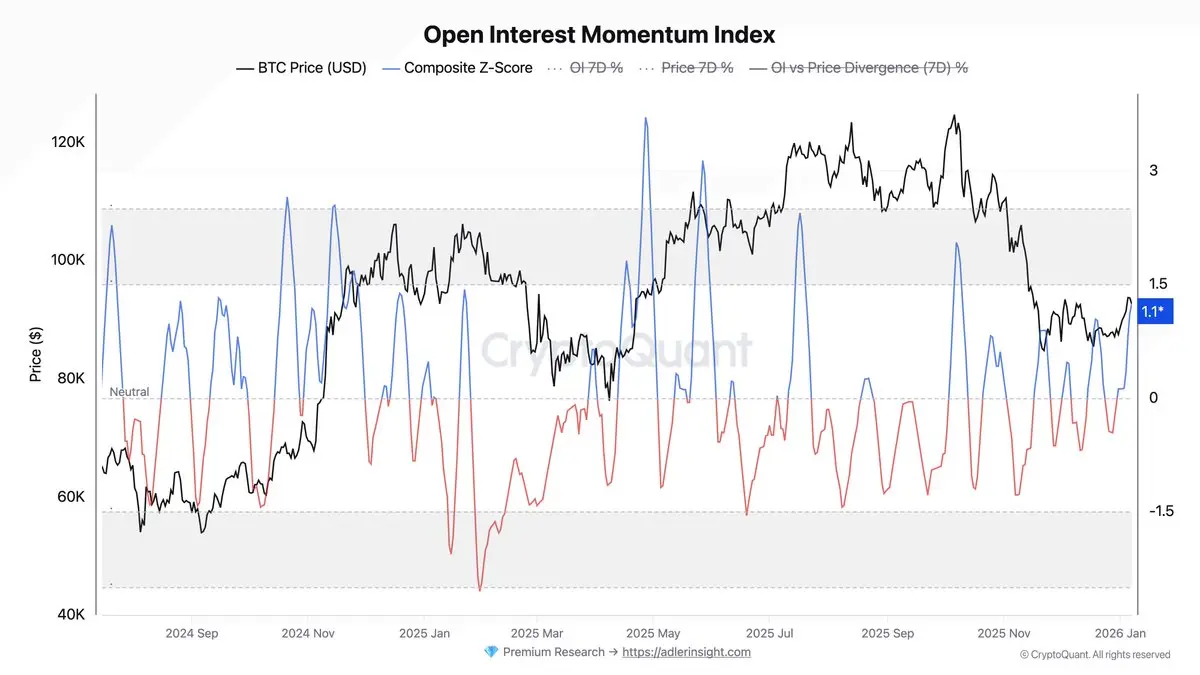
One of the market’s problems is that it’s being actively shorted in the futures market. There was an attempt to recover in recent days, but yesterday the bears slammed the pedal to the floor again.
post-image
  • Reward
  • Comment
  • Repost
  • Share
Market sentiment is extremely negative, the index reads –89, essentially marking a maximum stress point.
post-image
  • Reward
  • Comment
  • Repost
  • Share
Futures flows are currently bearish (Flow Index at 27.5%), but given today’s positive macro backdrop, the bulls need to try to consolidate around the $90K level.
post-image
  • Reward
  • Comment
  • Repost
  • Share
👉 The current morning backdrop is moderately risk-on, but without confirmation from volatility.
The market is moving in a risk stabilization with tech leadership structure: investors are pricing in the strong impulse from Nvidia’s earnings, while overall volatility remains elevated, making the upcoming employment data the key driver for the next move.
post-image
  • Reward
  • Comment
  • Repost
  • Share
European stock markets are poised for a positive open, supported by Nvidia’s strong earnings report, which has restored confidence in AI-related trades.
post-image
  • Reward
  • Comment
  • Repost
  • Share
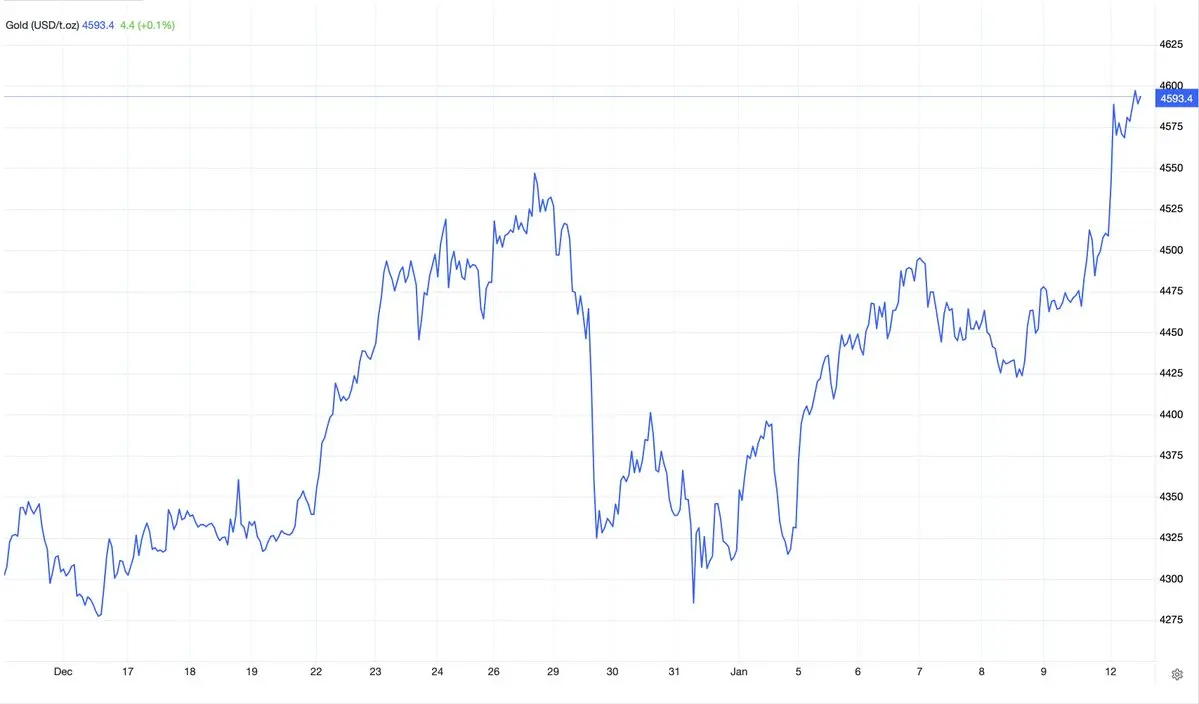
Gold prices fell below $4,068 per ounce after a two-day advance, as investors continue to scale back expectations for further monetary easing ahead of key employment data.
post-image
  • Reward
  • Comment
  • Repost
  • Share
Nvidia crushed expectations.
Q3 FY26 results show AI demand is still exploding:
Revenue: $57B (vs $55.4B est)
EPS: $1.30 (beat)
Data centers: $51B, +60–66% YoY
Guidance: next quarter $65B revenue (way above consensus)
CEO Jensen Huang: talk of an AI bubble is premature - demand for AI chips and compute keeps accelerating.
P.S.
Nvidia’s blowout report restored market confidence in the strength of the AI cycle.
post-image
  • Reward
  • Comment
  • Repost
  • Share
Yesterday, the Minutes of the Federal Open Market Committee were released. At the meeting, many participants favored lowering the target range for the federal funds rate, although some indicated they could have supported leaving rates unchanged, while several opposed a cut. When discussing the near-term path of monetary policy, participants noted that their views on the most appropriate decision for the December meeting diverged sharply: some considered an additional rate cut in December quite possible, others saw further easing occurring later rather than in December, while many expected the
post-image
  • Reward
  • Comment
  • Repost
  • Share
Local market stress remains elevated following the sharp corrective phase on November 17–18. The Local Stress Index is at 67.82, which corresponds to the Elevated zone - above the WATCH threshold (64), but still without critical alerts.
The peak of tension occurred on the evening of November 17 during the break below $92K, when realized volatility spiked (z-score up to 4.55) and aggressive selling intensified. Over the past 24 hours, the index has partially consolidated within the 62–68 range, but the short-term slope (+2.62) indicates a renewed increase in stress over the past several hours.
post-image
  • Reward
  • Comment
  • Repost
  • Share
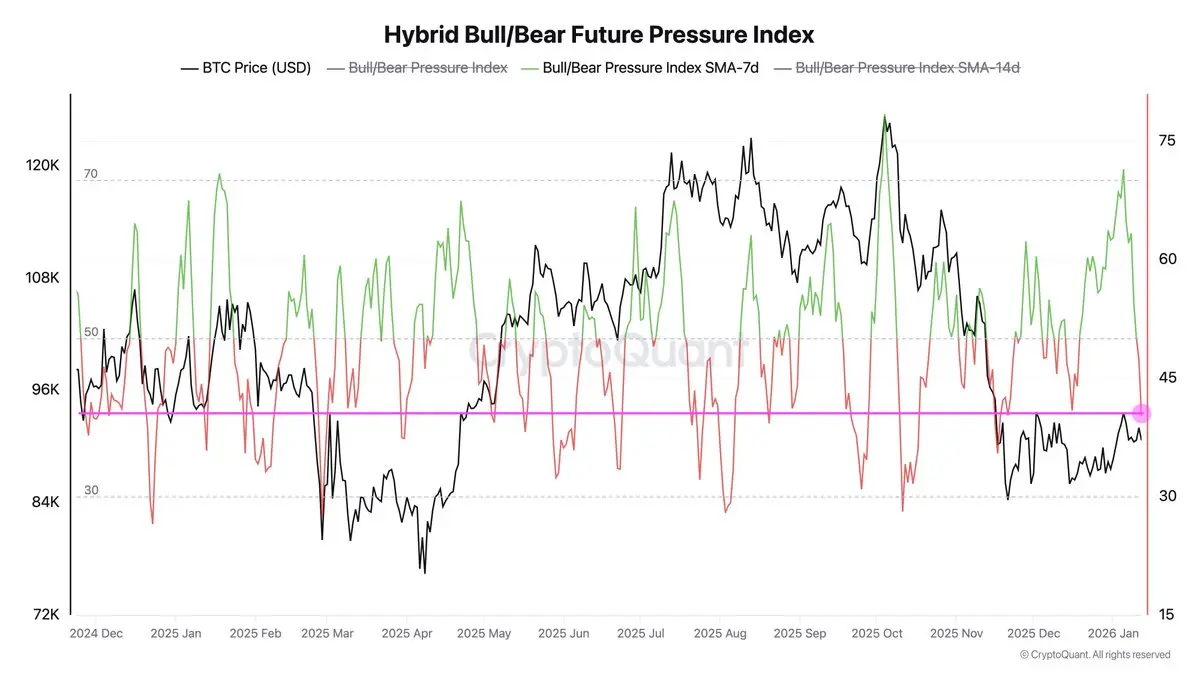
As of today, the market structure remains firmly bearish, although the fast indicator shows some improvement. The fast version of the Bull-Bear Structure Index has risen from a critical -41.89 (November 17) to -27.82, indicating a weakening of bearish pressure amid price stabilization around $91K. However, the readings are still deeply in negative territory (below -25%), signaling the continued dominance of bearish factors: negative taker flow, persistent derivatives pressure, and ongoing ETF outflows.
The slow (smoothed) indicator shows the opposite dynamic - deteriorating from -14.04 to -21.
post-image
  • Reward
  • Comment
  • Repost
  • Share
The Japanese yield curve is breaking: JGB 10Y = 1.77% (a 17-year high). This is the end of the era of cheap Japanese liquidity. And the issue isn’t the economy - it’s the fiscal side: a supplemental budget of over 25 trillion.
Consequences: capital repatriation, unwinding of JPY carry, rising term premium and MOVE.
If you still don’t understand the mechanics, I’ve put together a full series of guides on how to calculate risk-on/risk-off, covering everything from structure to trigger conditions.
post-image
  • Reward
  • Comment
  • Repost
  • Share
  • Trending TopicsView More
  • Pin
Trade Crypto Anywhere Anytime
qrCode
Scan to download Gate App
Community
English
  • 简体中文
  • English
  • Tiếng Việt
  • 繁體中文
  • Español
  • Русский
  • Français (Afrique)
  • Português (Portugal)
  • Bahasa Indonesia
  • 日本語
  • بالعربية
  • Українська
  • Português (Brasil)