


#SpaceXIPOAttractsOver250BillionInOrders
Chào bán cổ phần lần đầu ra công chúng của SpaceX: 250 tỷ đô la trong các đơn đặt hàng - Một sự kiện thị trường mang tính lịch sử
SpaceX đã đạt được một cột mốc quan trọng trong lịch sử tài chính khi đợt phát hành cổ phiếu lần đầu ra công chúng thu hút hơn 250 tỷ đô la trong các đơn đặt hàng của nhà đầu tư. Nhu cầu chưa từng có này đại diện cho một trong những sự kiện IPO lớn nhất từng ghi nhận trên Phố Wall. Phân tích toàn diện sau đây khám phá các khía cạnh chính của sự phát triển đột phá này.
Hiểu về Hiện tượng IPO
Chào bán cổ phần lần đầu ra công chúng đại diện cho lần đầu tiên một công ty tư nhân chào bán cổ phần của mình cho công chúng để mua. Khi SpaceX quyết định trở thành công ty niêm yết, nó mở ra cơ hội cho các nhà đầu tư cá nhân và tổ chức sở hữu một phần của doanh nghiệp hàng không vũ trụ cách mạng của Elon Musk. Quá trình này biến một công ty tư nhân thành một thực thể giao dịch công khai, chịu sự giám sát của cơ quan quản lý và các động thái của thị trường.
Giải thích về Nhu cầu 250 Tỷ Đô La
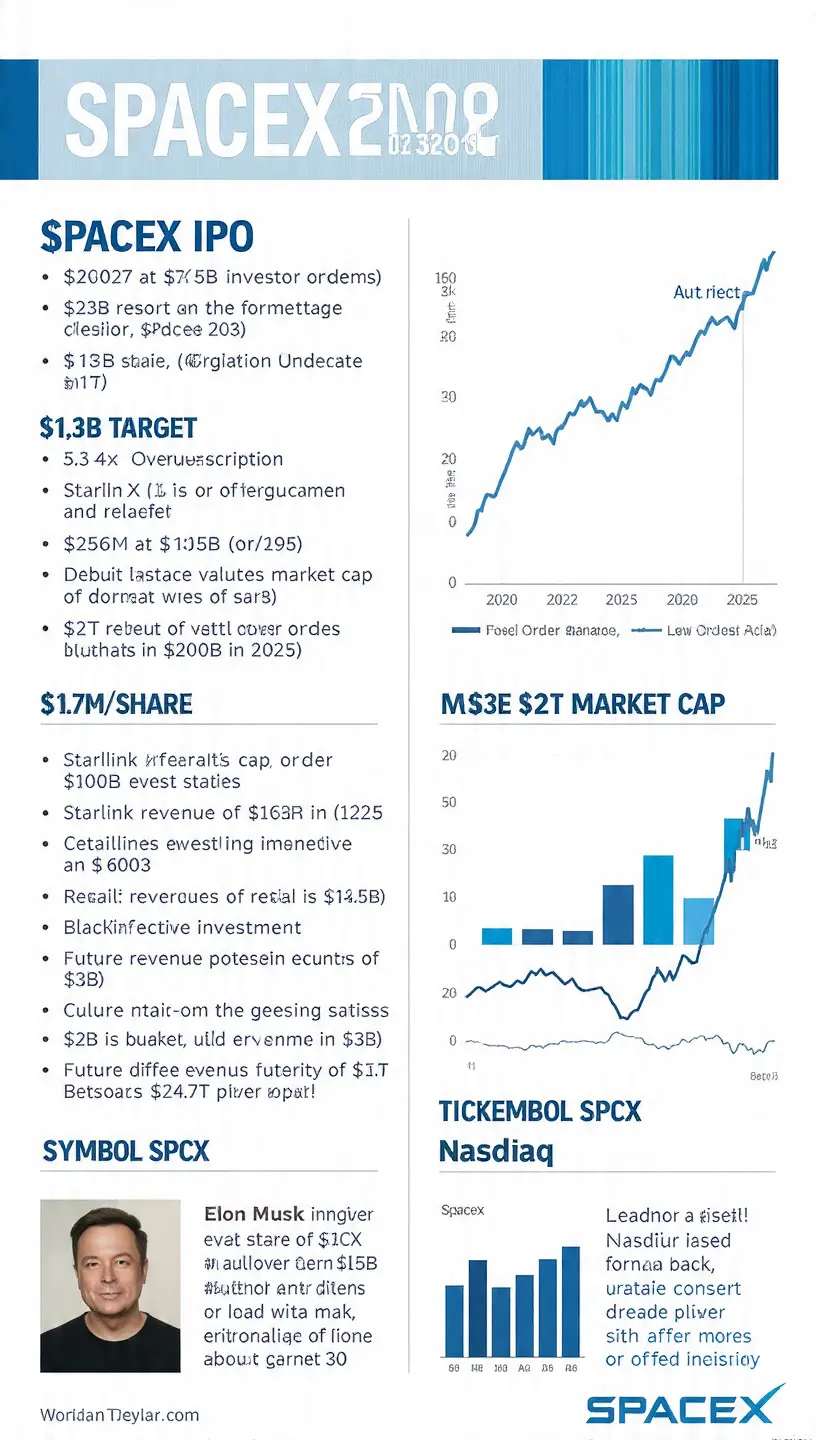
Số liệu 250 tỷ đô la thể hiện tổng nhu cầu của nhà đầu tư đối với cổ phiếu SpaceX, vượt xa đáng kể mức 75 tỷ đô la mà công ty dự kiến huy động. Điều này tạo ra tỷ lệ vượt đăng ký khoảng ba đến bốn lần quy mô chào bán dự kiến. Sự vượt đăng ký khổng lồ này cho thấy niềm tin phi thường vào triển vọng tương lai của SpaceX và phản ánh vị thế của công ty như một nhà lãnh đạo trong công nghệ không gian và truyền thông vệ tinh.
Các Chỉ số Định giá Kỷ lục
SpaceX hướng tới định giá khoảng 1,77 nghìn tỷ đô la qua đợt IPO này, định giá cổ phiếu ở mức 135 đô la mỗi cổ phần. Với khoảng 555,6 triệu cổ phiếu được chào bán, điều này sẽ đưa SpaceX vào danh sách các công ty giao dịch công khai có giá trị nhất toàn cầu. Vốn hóa thị trường của công ty đã tạm thời vượt qua 2 nghìn tỷ đô la trong ngày giao dịch đầu tiên, với cổ phiếu tăng 19% để đóng cửa ở mức 161 đô la.
Starlink: Đầu tàu doanh thu
Starlink đóng vai trò là nguồn doanh thu chính và động lực tăng trưởng của SpaceX. Năm 2025, SpaceX báo cáo doanh thu hợp nhất 18 tỷ đô la, trong đó Starlink đóng góp đáng kể vào con số này. Phân khúc internet vệ tinh đã nổi lên như một nhà lãnh đạo trong số các nhà cung cấp internet dựa trên không gian kể từ khi ra mắt lô vệ tinh đầu tiên vào năm 2019. Lợi nhuận ổn định của Starlink trái ngược với các phân khúc khác của SpaceX, khiến nó trở thành nền tảng của niềm tin của nhà đầu tư.
Tầm Nhìn và Lãnh đạo của Elon Musk
Việc Elon Musk thành lập SpaceX vào năm 2002 đã đặt nền móng cho đợt IPO mang tính lịch sử này. Tầm nhìn của ông về việc biến nhân loại thành một nền văn minh đa hành tinh thúc đẩy các dự án đầy tham vọng của công ty. Đợt IPO thành công có thể giúp Musk trở thành tỷ phú đầu tiên trên thế giới, khẳng định vị thế của ông như một trong những doanh nhân có ảnh hưởng nhất trong lịch sử. Lời phát biểu của Musk về mong muốn mọi người thức dậy với suy nghĩ rằng tương lai sẽ tuyệt vời thể hiện rõ sứ mệnh của SpaceX.
Cơ cấu Nhà Đầu Tư và Sự Quan Tâm Địa Lý
Nhu cầu 250 tỷ đô la đến từ các nhóm nhà đầu tư đa dạng. Các nhà đầu tư cá nhân đã đặt hàng vượt quá 100 tỷ đô la, thể hiện sự quan tâm rộng rãi của công chúng. Các nhà đầu tư tổ chức lớn như BlackRock cam kết ít nhất 5 tỷ đô la. Thêm vào đó, các quỹ tài sản quốc gia Trung Đông đã đóng góp hàng tỷ đô la, phản ánh niềm tin toàn cầu vào triển vọng của SpaceX.
Thách Thức Vượt Đăng Ký
Khi nhu cầu vượt quá cung cấp đáng kể trong một đợt IPO, việc phân bổ cổ phần trở nên khó khăn. SpaceX cho biết các nhà đầu tư cá nhân sẽ nhận ít nhất 20% số cổ phần có sẵn, nghĩa là phần lớn nhu cầu của các nhà đầu tư cá nhân sẽ không được đáp ứng. Tình trạng khan hiếm này thường thúc đẩy giá cổ phiếu sau IPO tăng lên khi nhu cầu chưa được thỏa mãn tìm kiếm cổ phần trên thị trường thứ cấp.
Dự Báo Doanh Thu Tương Lai
Các hồ sơ pháp lý của SpaceX dự báo các cơ hội doanh thu tiềm năng trong tương lai lên tới 28,5 nghìn tỷ đô la. Trong đó có 26,5 nghìn tỷ từ các sáng kiến trí tuệ nhân tạo, 1,6 nghìn tỷ từ dịch vụ băng thông rộng Starlink, 740 tỷ từ kết nối di động Starlink, và 370 tỷ từ các giải pháp dựa trên không gian. Mặc dù các dự báo này thể hiện tiềm năng dài hạn chứ không phải kết quả đảm bảo, chúng cho thấy các thị trường rộng lớn mà SpaceX hướng tới.
Tích hợp AI và Mua lại xAI
Việc SpaceX gần đây mua lại xAI, startup trí tuệ nhân tạo của Elon Musk, cùng với nền tảng mạng xã hội X, tạo ra các liên kết cộng hưởng giữa ba doanh nghiệp lớn của Musk. Phân khúc AI của công ty ghi nhận khoản lỗ hoạt động 6,35 tỷ đô la trong năm 2025, phản ánh các khoản đầu tư lớn vào lĩnh vực chiến lược này. SpaceX hình dung xây dựng các trung tâm dữ liệu quỹ đạo và trở thành một đối thủ đáng kể trong cuộc đua trí tuệ nhân tạo.
Tác Động Thị Trường và Ảnh Hưởng Ngành Công Nghiệp
Đợt IPO của SpaceX đã kích hoạt các chuyển động lớn trên thị trường, với các quỹ phòng hộ được cho là đã bán các vị thế trong các tập đoàn công nghệ lớn để giải phóng vốn cho đợt phát hành lịch sử này. Sự xoay vòng này cho thấy các IPO mang tính biến đổi như thế nào có thể định hình lại danh mục đầu tư và động thái của thị trường. Sự ra mắt thành công xác nhận khẩu vị của nhà đầu tư đối với các công ty sáng tạo giải quyết các công nghệ tiên phong.
Các Yếu Tố Rủi Ro và Cân Nhắc
Dù nhu cầu vượt quá mong đợi, SpaceX vẫn đối mặt với các thách thức bao gồm khoản lỗ ròng 4,9 tỷ đô la trong năm 2025 và các khoản đầu tư lớn vào phân khúc AI. Công ty cần thể hiện sự tăng trưởng doanh thu bền vững và con đường hướng tới lợi nhuận để duy trì định giá của mình. Các rủi ro về quy định, áp lực cạnh tranh từ các công ty không gian khác, và rủi ro về thực thi công nghệ vẫn là những mối quan tâm thường trực của các nhà đầu tư.
Hiệu Suất Ra Mắt Giao Dịch
Cổ phiếu SpaceX ra mắt trên Nasdaq dưới mã ticker SPCX vào ngày 12 tháng 6 năm 2026. Cổ phiếu mở cửa mạnh mẽ và duy trì đà tăng trong suốt phiên giao dịch đầu tiên. Hiệu suất này xác nhận nhu cầu lớn trước IPO và đưa SpaceX trở thành một thành viên quan trọng của thị trường ngay từ ngày đầu tiên.
Chính Sách Đầu Tư Dài Hạn
Các nhà đầu tư bị thu hút bởi SpaceX nhấn mạnh nhiều yếu tố tăng trưởng dài hạn bao gồm mở rộng số lượng thuê bao Starlink, hợp đồng chính phủ và quân sự qua Starshield, phát triển du lịch không gian, các nỗ lực định cư sao Hỏa, và tích hợp trí tuệ nhân tạo. Phương pháp tích hợp dọc từ sản xuất tên lửa đến triển khai vệ tinh đến dịch vụ tiêu dùng tạo ra lợi thế cạnh tranh.
Kết Luận
Đợt IPO của SpaceX không chỉ là một giao dịch tài chính; nó còn đánh dấu một bước ngoặt cho ngành công nghiệp không gian thương mại và đầu tư thị trường công khai. Nhu cầu 250 tỷ đô la báo hiệu sự tự tin chưa từng có vào thương mại hóa công nghệ không gian và khả năng thực thi của Elon Musk. Khi SpaceX bắt đầu hành trình trở thành công ty cổ phần, các nhà đầu tư toàn cầu sẽ theo dõi chặt chẽ xem liệu sự ra mắt lịch sử này có chuyển thành giá trị dài hạn bền vững hay không.
@Gate_Square
Chào bán cổ phần lần đầu ra công chúng của SpaceX: 250 tỷ đô la trong các đơn đặt hàng - Một sự kiện thị trường mang tính lịch sử
SpaceX đã đạt được một cột mốc quan trọng trong lịch sử tài chính khi đợt phát hành cổ phiếu lần đầu ra công chúng thu hút hơn 250 tỷ đô la trong các đơn đặt hàng của nhà đầu tư. Nhu cầu chưa từng có này đại diện cho một trong những sự kiện IPO lớn nhất từng ghi nhận trên Phố Wall. Phân tích toàn diện sau đây khám phá các khía cạnh chính của sự phát triển đột phá này.
Hiểu về Hiện tượng IPO
Chào bán cổ phần lần đầu ra công chúng đại diện cho lần đầu tiên một công ty tư nhân chào bán cổ phần của mình cho công chúng để mua. Khi SpaceX quyết định trở thành công ty niêm yết, nó mở ra cơ hội cho các nhà đầu tư cá nhân và tổ chức sở hữu một phần của doanh nghiệp hàng không vũ trụ cách mạng của Elon Musk. Quá trình này biến một công ty tư nhân thành một thực thể giao dịch công khai, chịu sự giám sát của cơ quan quản lý và các động thái của thị trường.
Giải thích về Nhu cầu 250 Tỷ Đô La
Số liệu 250 tỷ đô la thể hiện tổng nhu cầu của nhà đầu tư đối với cổ phiếu SpaceX, vượt xa đáng kể mức 75 tỷ đô la mà công ty dự kiến huy động. Điều này tạo ra tỷ lệ vượt đăng ký khoảng ba đến bốn lần quy mô chào bán dự kiến. Sự vượt đăng ký khổng lồ này cho thấy niềm tin phi thường vào triển vọng tương lai của SpaceX và phản ánh vị thế của công ty như một nhà lãnh đạo trong công nghệ không gian và truyền thông vệ tinh.
Các Chỉ số Định giá Kỷ lục
SpaceX hướng tới định giá khoảng 1,77 nghìn tỷ đô la qua đợt IPO này, định giá cổ phiếu ở mức 135 đô la mỗi cổ phần. Với khoảng 555,6 triệu cổ phiếu được chào bán, điều này sẽ đưa SpaceX vào danh sách các công ty giao dịch công khai có giá trị nhất toàn cầu. Vốn hóa thị trường của công ty đã tạm thời vượt qua 2 nghìn tỷ đô la trong ngày giao dịch đầu tiên, với cổ phiếu tăng 19% để đóng cửa ở mức 161 đô la.
Starlink: Đầu tàu doanh thu
Starlink đóng vai trò là nguồn doanh thu chính và động lực tăng trưởng của SpaceX. Năm 2025, SpaceX báo cáo doanh thu hợp nhất 18 tỷ đô la, trong đó Starlink đóng góp đáng kể vào con số này. Phân khúc internet vệ tinh đã nổi lên như một nhà lãnh đạo trong số các nhà cung cấp internet dựa trên không gian kể từ khi ra mắt lô vệ tinh đầu tiên vào năm 2019. Lợi nhuận ổn định của Starlink trái ngược với các phân khúc khác của SpaceX, khiến nó trở thành nền tảng của niềm tin của nhà đầu tư.
Tầm Nhìn và Lãnh đạo của Elon Musk
Việc Elon Musk thành lập SpaceX vào năm 2002 đã đặt nền móng cho đợt IPO mang tính lịch sử này. Tầm nhìn của ông về việc biến nhân loại thành một nền văn minh đa hành tinh thúc đẩy các dự án đầy tham vọng của công ty. Đợt IPO thành công có thể giúp Musk trở thành tỷ phú đầu tiên trên thế giới, khẳng định vị thế của ông như một trong những doanh nhân có ảnh hưởng nhất trong lịch sử. Lời phát biểu của Musk về mong muốn mọi người thức dậy với suy nghĩ rằng tương lai sẽ tuyệt vời thể hiện rõ sứ mệnh của SpaceX.
Cơ cấu Nhà Đầu Tư và Sự Quan Tâm Địa Lý
Nhu cầu 250 tỷ đô la đến từ các nhóm nhà đầu tư đa dạng. Các nhà đầu tư cá nhân đã đặt hàng vượt quá 100 tỷ đô la, thể hiện sự quan tâm rộng rãi của công chúng. Các nhà đầu tư tổ chức lớn như BlackRock cam kết ít nhất 5 tỷ đô la. Thêm vào đó, các quỹ tài sản quốc gia Trung Đông đã đóng góp hàng tỷ đô la, phản ánh niềm tin toàn cầu vào triển vọng của SpaceX.
Thách Thức Vượt Đăng Ký
Khi nhu cầu vượt quá cung cấp đáng kể trong một đợt IPO, việc phân bổ cổ phần trở nên khó khăn. SpaceX cho biết các nhà đầu tư cá nhân sẽ nhận ít nhất 20% số cổ phần có sẵn, nghĩa là phần lớn nhu cầu của các nhà đầu tư cá nhân sẽ không được đáp ứng. Tình trạng khan hiếm này thường thúc đẩy giá cổ phiếu sau IPO tăng lên khi nhu cầu chưa được thỏa mãn tìm kiếm cổ phần trên thị trường thứ cấp.
Dự Báo Doanh Thu Tương Lai
Các hồ sơ pháp lý của SpaceX dự báo các cơ hội doanh thu tiềm năng trong tương lai lên tới 28,5 nghìn tỷ đô la. Trong đó có 26,5 nghìn tỷ từ các sáng kiến trí tuệ nhân tạo, 1,6 nghìn tỷ từ dịch vụ băng thông rộng Starlink, 740 tỷ từ kết nối di động Starlink, và 370 tỷ từ các giải pháp dựa trên không gian. Mặc dù các dự báo này thể hiện tiềm năng dài hạn chứ không phải kết quả đảm bảo, chúng cho thấy các thị trường rộng lớn mà SpaceX hướng tới.
Tích hợp AI và Mua lại xAI
Việc SpaceX gần đây mua lại xAI, startup trí tuệ nhân tạo của Elon Musk, cùng với nền tảng mạng xã hội X, tạo ra các liên kết cộng hưởng giữa ba doanh nghiệp lớn của Musk. Phân khúc AI của công ty ghi nhận khoản lỗ hoạt động 6,35 tỷ đô la trong năm 2025, phản ánh các khoản đầu tư lớn vào lĩnh vực chiến lược này. SpaceX hình dung xây dựng các trung tâm dữ liệu quỹ đạo và trở thành một đối thủ đáng kể trong cuộc đua trí tuệ nhân tạo.
Tác Động Thị Trường và Ảnh Hưởng Ngành Công Nghiệp
Đợt IPO của SpaceX đã kích hoạt các chuyển động lớn trên thị trường, với các quỹ phòng hộ được cho là đã bán các vị thế trong các tập đoàn công nghệ lớn để giải phóng vốn cho đợt phát hành lịch sử này. Sự xoay vòng này cho thấy các IPO mang tính biến đổi như thế nào có thể định hình lại danh mục đầu tư và động thái của thị trường. Sự ra mắt thành công xác nhận khẩu vị của nhà đầu tư đối với các công ty sáng tạo giải quyết các công nghệ tiên phong.
Các Yếu Tố Rủi Ro và Cân Nhắc
Dù nhu cầu vượt quá mong đợi, SpaceX vẫn đối mặt với các thách thức bao gồm khoản lỗ ròng 4,9 tỷ đô la trong năm 2025 và các khoản đầu tư lớn vào phân khúc AI. Công ty cần thể hiện sự tăng trưởng doanh thu bền vững và con đường hướng tới lợi nhuận để duy trì định giá của mình. Các rủi ro về quy định, áp lực cạnh tranh từ các công ty không gian khác, và rủi ro về thực thi công nghệ vẫn là những mối quan tâm thường trực của các nhà đầu tư.
Hiệu Suất Ra Mắt Giao Dịch
Cổ phiếu SpaceX ra mắt trên Nasdaq dưới mã ticker SPCX vào ngày 12 tháng 6 năm 2026. Cổ phiếu mở cửa mạnh mẽ và duy trì đà tăng trong suốt phiên giao dịch đầu tiên. Hiệu suất này xác nhận nhu cầu lớn trước IPO và đưa SpaceX trở thành một thành viên quan trọng của thị trường ngay từ ngày đầu tiên.
Chính Sách Đầu Tư Dài Hạn
Các nhà đầu tư bị thu hút bởi SpaceX nhấn mạnh nhiều yếu tố tăng trưởng dài hạn bao gồm mở rộng số lượng thuê bao Starlink, hợp đồng chính phủ và quân sự qua Starshield, phát triển du lịch không gian, các nỗ lực định cư sao Hỏa, và tích hợp trí tuệ nhân tạo. Phương pháp tích hợp dọc từ sản xuất tên lửa đến triển khai vệ tinh đến dịch vụ tiêu dùng tạo ra lợi thế cạnh tranh.
Kết Luận
Đợt IPO của SpaceX không chỉ là một giao dịch tài chính; nó còn đánh dấu một bước ngoặt cho ngành công nghiệp không gian thương mại và đầu tư thị trường công khai. Nhu cầu 250 tỷ đô la báo hiệu sự tự tin chưa từng có vào thương mại hóa công nghệ không gian và khả năng thực thi của Elon Musk. Khi SpaceX bắt đầu hành trình trở thành công ty cổ phần, các nhà đầu tư toàn cầu sẽ theo dõi chặt chẽ xem liệu sự ra mắt lịch sử này có chuyển thành giá trị dài hạn bền vững hay không.
@Gate_Square