#MorganStanleyAdds1000BTC モルガン・スタンレー、BTCを1,000追加。機関投資家のビットコイン需要は引き続き拡大
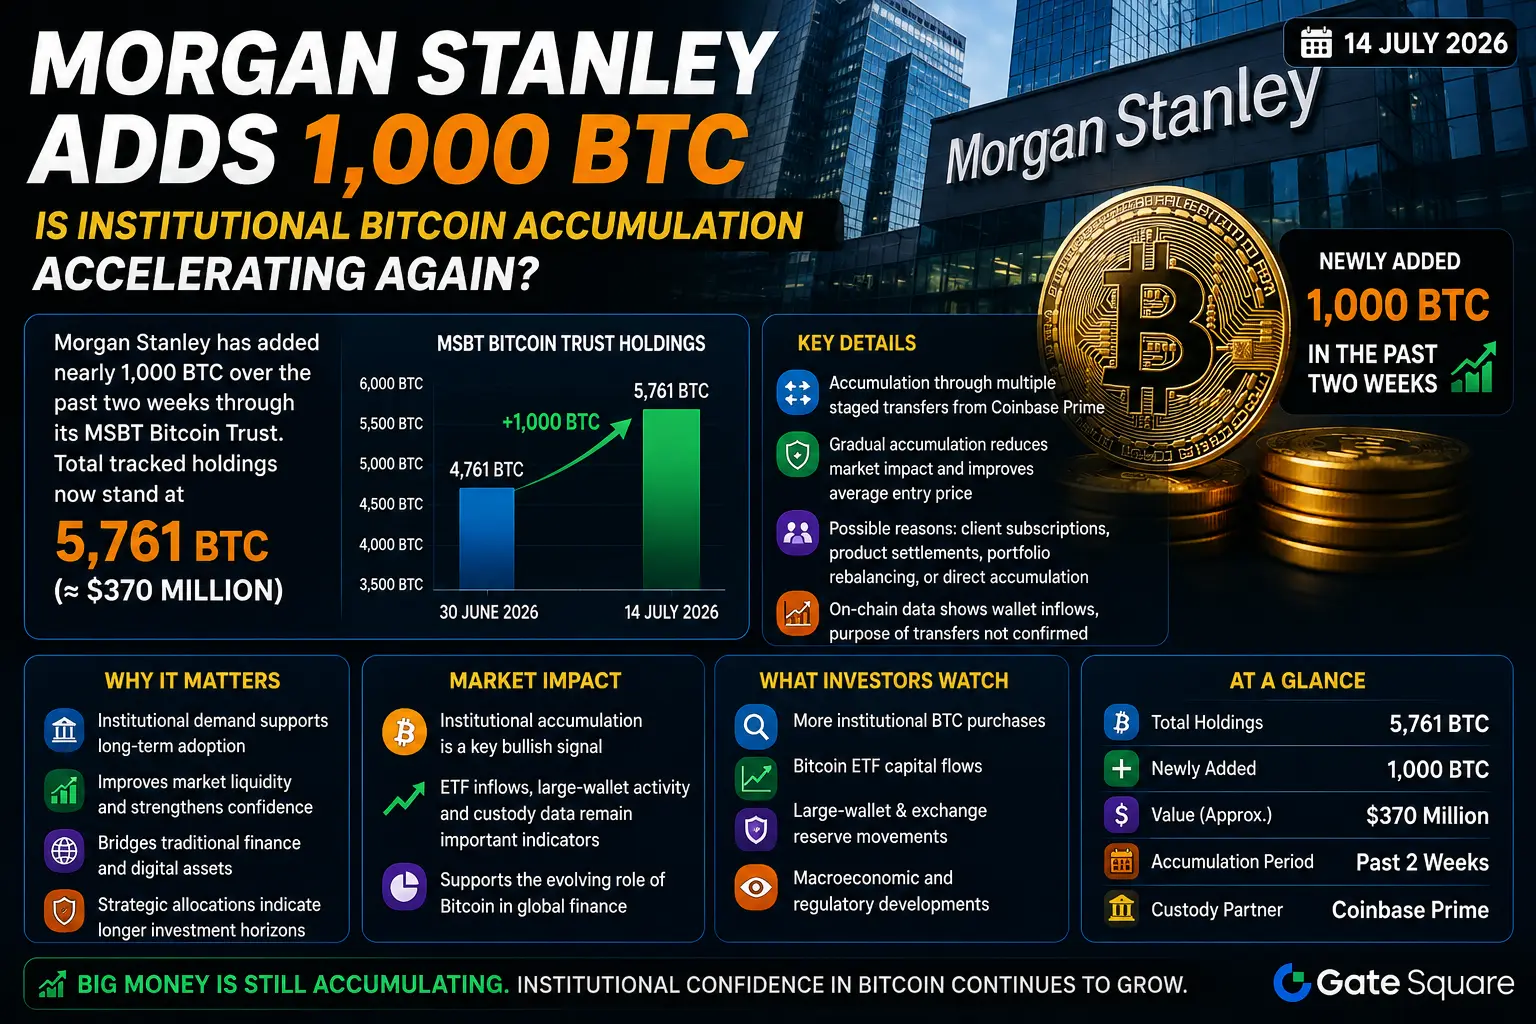
暗号資産市場では機関投資家の参加が着実に増えていることが続いており、モルガン・スタンレーによる最新の動きは、世界中の投資家の注目を改めて集めています。直近のオンチェーンデータによると、モルガン・スタンレーは過去2週間で約1,000 BTCを追加し、追跡対象の保有量を5,761 BTCにまで増やしました。報道によれば、この積み増しは単一の購入ではなく複数回の移転を通じて行われており、市場が弱い局面において、規律ある長期の取得戦略を示唆しています。
この動きは、ここ数年にわたってデジタル資産市場を形作ってきた重要なトレンドを裏付けます。主要な金融機関が、ビットコインを戦略的な資産としてますます見なし、投資商品に組み込み、機関投資家向けのアクセスを拡大しているのです。
機関投資家の信頼は引き続き強まる
機関投資家は、個人トレーダーとは異なるアプローチを取ることがよくあります。日々の市場変動に反応するのではなく、一般的には長期のポートフォリオ配分と戦略的な投資機会に焦点を当てます。
モルガン・スタンレーの今回のビットコイン積み増しは、この考え方を反映しているように見えます。1回の大口購入ではなく、2週間の期間でいくつかのまとまった移転を通じて保有が増加したのです。このような段階的な積み増し戦略は、市場への影響を最小限に抑えつつ、意味のあるポジションを築きたいと考える機関投資家により一般的に用いられます。
ビットコインにとって重要な理由
大規模な機関投資家の購入は、市場のボラティリティが続いているにもかかわらず、ビットコインに対する信頼が維持されていることを示すため、重要です。
機関投資家の参加はしばしば以下に寄与します。
市場の流動性の向上。
デジタル資産の信頼性の上昇。
長期的な普及の促進。
投資商品の拡充。
伝統的金融との一体化の強化。
より多くのグローバルな金融機関が市場に参入するにつれ、ビットコインは投機的な資産から、分散投資ポートフォリオの一部として認識される方向へ進化し続けています。
市場の弱さの中での購入
モルガン・スタンレーの今回の活動で特に注目されるのは、そのタイミングです。
ブロックチェーンの追跡データによれば、追加されたビットコインは最近の市場の下げ局面で積み増されました。価格が下落する中でエクスポージャーを減らすのではなく、評価額が低い局面において保有を増やしたように見えます。
経験豊富な投資家の多くは、このアプローチを「安値で買う(ディップを買う)」と表現します。これは一時的な市場の弱さを、懸念の理由ではなく長期的な機会として捉える考え方です。
大口1回の購入ではなく、複数の移転
報じられた積み増しは、主にCoinbase Primeのカストディ用アドレスから発信された、いくつかの別々のビットコイン移転で構成されていました。
この方法には、いくつかの利点があります。
市場の混乱を抑えられる。
執行効率が向上する。
平均購入価格が改善する。
積み増しの可視性が低い。
ポートフォリオ管理をより柔軟にできる。
こうした戦略は、大規模な資本配分を運用する機関投資家によって頻繁に用いられます。
モルガン・スタンレーの成長するデジタル資産戦略
モルガン・スタンレーはここ数年、デジタル資産への関与を段階的に広げてきました。
ビットコインの保有にとどまらず、同社は暗号資産に特化した金融パートナーと連携することで、対象となるウェルスマネジメント顧客向けのサービスも拡充しています。最近の取り組みは、機関投資家としての投資基準を維持しながら、デジタル資産へのエクスポージャーを求める顧客に対して、規制された経路を提供することを目的としています。
これは、従来型の金融が引き続きブロックチェーンベースの投資機会へ向かっていることを示しています。
オンチェーンの透明性の役割
ブロックチェーン技術は、前例のない透明性を提供します。
多くの従来の金融市場とは異なり、ブロックチェーン上の取引は、ウォレット分析によって公開の形で監視できる場合がよくあります。
Arkhamのような企業は、機関投資家のウォレットを追跡し、大きな資産移動に関する洞察を提供することで、これまで見えにくかったトレンドを市場参加者が観察できるようにしています。
ウォレットの追跡では、企業が保有する資産と顧客の保有分を常に区別できるわけではありませんが、機関投資家の活動に関する有益な情報を提供します。
機関投資の導入は拡大している
モルガン・スタンレーだけが、デジタル資産での存在感を高めている主要な金融機関ではありません。
金融業界全体で、投資会社はビットコインやその他の暗号資産への規制されたアクセスを提供する商品を引き続き開発しています。
増加する機関投資家需要は、次の要因に支えられています。
規制枠組みの改善。
より良いカストディ(保管)ソリューション。
市場の流動性の向上。
セキュリティ基盤の強化。
顧客の関心の高まり。
こうした動きは、デジタル資産エコシステムへの信頼を引き続き強めています。
投資家にとって何を意味するか
機関投資家の購入は、将来の価格上昇を保証するものと見なすべきではありません。
ただし、それが示すのは多くの場合、綿密な調査、規律あるリスク管理、長期の投資計画です。
個人投資家は、機関投資家の行動から貴重な学びを得られます。
投資する前に調査を重視する。
分散されたポートフォリオを維持する。
感情に左右される意思決定を避ける。
短期の価格変動の先を見据える。
デジタル資産に伴うリスクを理解する。
成功する投資は、投機ではなく準備に基づいて構築されます。
長期のビットコイン見通し
ビットコインは、供給量が限られていること、分散型のネットワークであること、そして金融機関による受け入れが高まっていることから、引き続き注目を集めています。
機関投資家の参加が増えるにつれ、多くのアナリストはビットコインが、世界の投資ポートフォリオにおけるますます重要な構成要素になる可能性があると考えています。
同時に、投資家は暗号資産市場が依然として非常にボラティリティが高いこと、そして将来のパフォーマンスはマクロ経済状況、規制、普及、投資家心理に左右されることを忘れてはなりません。
課題はまだ残っている
ポジティブな機関投資の動きがあるにもかかわらず、ビットコインは依然としていくつかの課題に直面しています。
規制方針は国ごとに引き続き変化している。
市場のボラティリティは依然として大きい。
マクロ経済の不確実性が投資家の行動に影響を与え得る。
他のブロックチェーンネットワークとの競争は引き続き激化している。
これらの要因は、徹底した調査に支えられたバランスの取れた投資判断の重要性を浮き彫りにします。
最後に
モルガン・スタンレーが報じられた約1,000 BTCの追加により、追跡対象の保有量を5,761 BTCに増やしたことは、機関投資家による暗号資産採用の進化が続く中での、もう一つの重要な節目です。1回の大口購入ではなく、同社の段階的な積み増し戦略は、デジタル資産投資における規律ある長期志向の姿勢を示しています。
従来型の金融機関がビットコインへの関与を拡大するにつれ、従来の金融とブロックチェーン技術の関係はさらに強まっています。この流れは、市場の成熟度を高め、投資家の信頼を増し、世界の金融市場全体でより幅広い普及を後押しする可能性があります。
リスクのない投資はありませんが、実績のある金融機関が関与を続けていることは、ビットコインが依然として真剣な長期注目を集める資産であることを示しています。綿密な調査、規律あるリスク管理、長期的視点を組み合わせる投資家は、機関投資家の参加が拡大し続ける中で、変化するデジタル資産の状況をより適切に乗りこなせる可能性が高いでしょう。