
Date: Fri, Jan 02, 2026 | 10:54 AM GMT
The broader cryptocurrency market has started the new year with modest strength, as both Bitcoin (BTC) and Ethereum (ETH) trade slightly higher with gains of over 2%. This renewed stability across majors has helped improve overall sentiment, allowing several altcoins to regain momentum — including Aster (ASTER).
ASTER is currently trading around 4% higher on the day, but the more important development lies beneath the surface. On lower timeframes, price action is beginning to highlight a constructive bullish structure, suggesting that the token may be preparing for a meaningful breakout if the setup confirms.
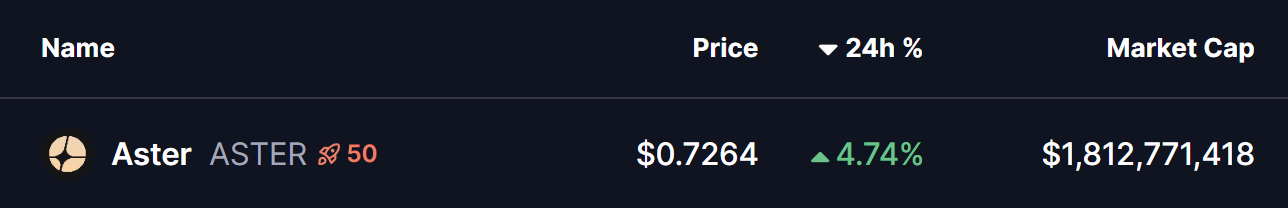
Source: Coinmarketcap
Ascending Triangle Structure Takes Shape
On the 4-hour chart, ASTER is forming a clear ascending triangle, defined by a series of higher lows pressing steadily against a horizontal resistance zone. This type of structure is widely regarded as a bullish continuation pattern, particularly when it develops during consolidation and shows consistent buyer accumulation at rising support levels.
ASTER recently faced rejection near the $0.7367 neckline resistance, which pushed price back toward its ascending support trendline around the $0.68 region. Importantly, each dip has been met with strong buying interest, preventing any deeper pullback and keeping the bullish structure intact. This behavior indicates that sellers are gradually losing control as buyers step in earlier on every retracement.
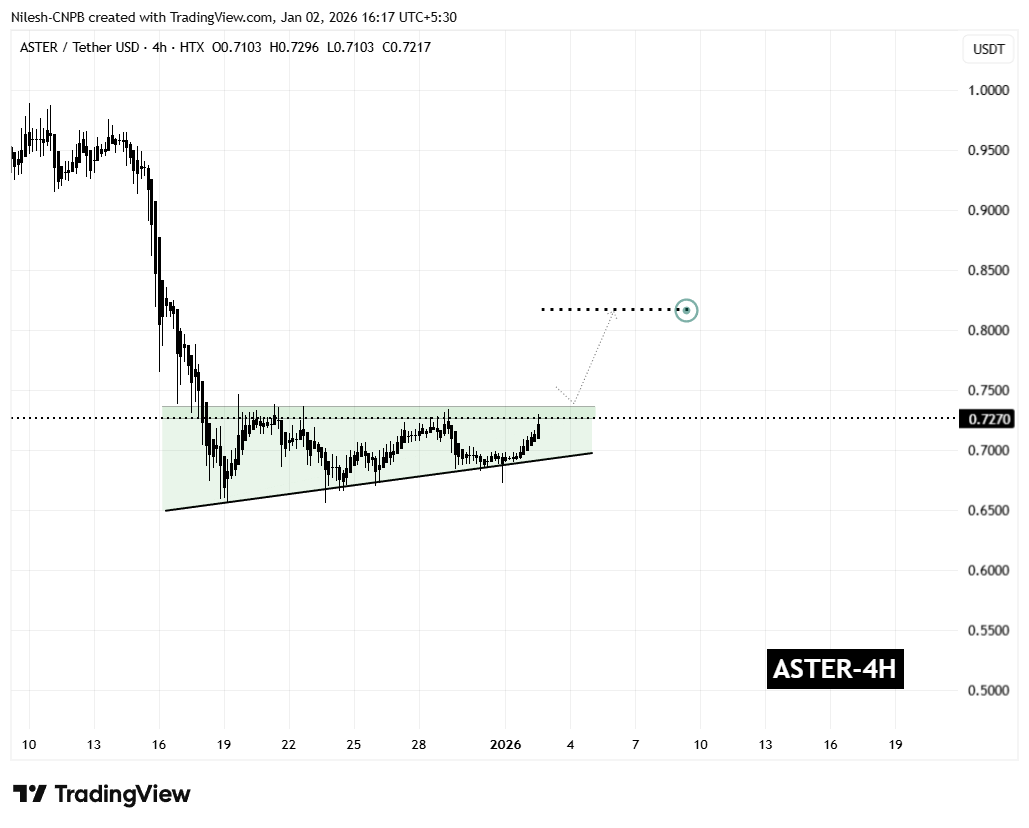
Aster (ASTER) 4H Chart/Coinsprobe (Source: Tradingview)
The latest rebound has once again carried ASTER toward the upper boundary of the triangle, reinforcing the idea that demand remains firm. Rather than signaling weakness, this sideways-to-higher price action reflects healthy consolidation as volatility tightens ahead of a potential breakout.
What’s Next for ASTER?
From here, ASTER appears to be preparing for another test of the $0.7367 resistance zone. A decisive breakout above this level, followed by a sustained close and a successful retest as support, would confirm the ascending triangle pattern and likely trigger a bullish expansion phase.
Based on the measured move of the formation, the technical upside projection points toward the $0.8178 region. This target represents a potential upside of roughly 12% from current levels and also aligns with previous price structure, adding further confidence to the bullish outlook.
That said, caution remains warranted. If ASTER fails to break above resistance, price could once again drift back toward the rising support trendline. As long as this trendline continues to hold, the broader bullish setup remains valid. A decisive breakdown below support, however, would invalidate the pattern and postpone any breakout scenario.
For now, the combination of improving market sentiment, consistent dip-buying, and a tightening ascending triangle structure suggests that Aster is approaching a critical decision point — one that could define its next significant move as 2026 begins.
Disclaimer: The views and analysis presented in this article are for informational purposes only and reflect the author’s perspective, not financial advice. Technical patterns and indicators discussed are subject to market volatility and may or may not yield the anticipated results. Investors are advised to exercise caution, conduct independent research, and make decisions aligned with their individual risk tolerance.
About Author: Nilesh Hembade is the Founder and Lead Author of Coinsprobe, with over 5 years of experience in the cryptocurrency and blockchain industry. Since launching Coinsprobe in 2023, he has been providing daily, research-driven insights through in-depth market analysis, on-chain data, and technical research.
Disclaimer: The information on this page may come from third parties and does not represent the views or opinions of Gate. The content displayed on this page is for reference only and does not constitute any financial, investment, or legal advice. Gate does not guarantee the accuracy or completeness of the information and shall not be liable for any losses arising from the use of this information. Virtual asset investments carry high risks and are subject to significant price volatility. You may lose all of your invested principal. Please fully understand the relevant risks and make prudent decisions based on your own financial situation and risk tolerance. For details, please refer to
Disclaimer.
Related Articles
XRP Price Nears $1.50 Breakout as Triangle Tightens
Abstract: XRP is trading within a tightening symmetrical triangle, indicating a potential bullish breakout as momentum builds. A green Supertrend and rising MACD support the case, with price near $1.41 and resistance at $1.50 and support at $1.20. A break above $1.50 could target around $1.61; a break below $1.20 could drive toward $1.00, all amid cautious market conditions.
Summary: XRP is consolidating in a tightening symmetrical triangle near $1.41, with bullish momentum as Supertrend turns green and MACD rises. A breakout above $1.50 could target $1.61, while a drop below $1.20 risks $1.00.
CryptoNewsLand36m ago
Shiba Inu Price Compression Signals Imminent Breakout Phase
Key Insights:
Shiba Inu trades near $0.0000060 as tightening volatility and reduced momentum signal an approaching breakout phase after months of sustained decline.
Open interest declines to $68 million, while persistent spot outflows highlight cautious sentiment and limited conviction
CryptoNewsLand39m ago
Solana Price Holds Range as $90 Resistance Caps Breakout
Key Insightsthe price
Solana trades between $85 and $86 after a pullback, while an ascending channel pattern supports bullish structure with strong demand near support levels.
Momentum indicators, including MACD and Aroon, suggest strengthening buying pressure, reinforcing expectations of a
CryptoNewsLand48m ago
ARK 2026 Bitcoin Outlook: ETFs + DAT account for 12% of supply, and an estimated crypto market cap of 28 trillion by 2030
ARK Big Ideas 2026 points out that institutions adopting acceleration and the ETF+DAT merger have already secured BTC 12% of the circulating supply, and governments and state governments are gradually buying in to form long-term support. In 2025, it retraced to the lowest level in history, and volatility declined. By 2030, the market value is expected to be about $28 trillion, BTC about $4.2 trillion, with annual growth of 60–61%. In emerging markets, stablecoins replace some BTC reserve-demand, and long-term investors should focus on structural buy orders and risk management.
ChainNewsAbmedia1h ago
Ethereum Outperforms S&P 500 by 1,696 Basis Points Since U.S.-Iran Conflict, Says Tom Lee
Gate News message, April 27 — Tom Lee, chairman of Bitmine, stated that Ethereum has outperformed the S&P 500 index (U.S. benchmark equity index) by 1,696 basis points since the U.S.-Iran conflict, making it the best-performing single asset globally aside from crude oil. According to Lee, ETH has de
GateNews2h ago
New Altcoins Outperform Older Tokens in 2025, Data Shows Divergence in Exchange Performance
Gate News message, April 27 — In 2025, newly launched altcoins significantly outperformed older tokens, marking a shift in how liquidity is allocated across the crypto market. While older altcoins posted net losses between 18% and 23%, newly listed altcoins in 2025 retained 5% in net gains,
GateNews3h ago