
Key Highlights
-
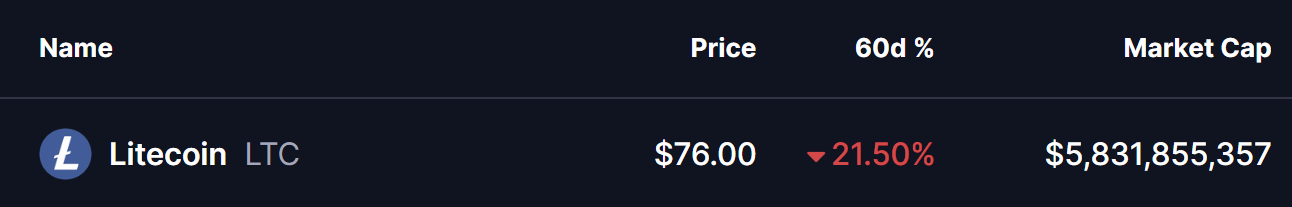
Litecoin (LTC) price has declined nearly 21% in the past 60 days, but its long-term structure remains intact.
-
Weekly and monthly charts show Litecoin closely mirroring Monero’s (XMR) historical bullish fractal.
-
Both LTC and XMR peaked in 2017 and 2021 and formed macro higher lows after the 2022 bear market bottom.
-
LTC is currently testing a long-term rising support trendline near the $75 region.
-
If the fractal continues to play out, Litecoin could be setting up for a larger upside move.
Litecoin (LTC) may have struggled in the short term, but zooming out tells a far more interesting story.
Over the past 60 days, LTC has slipped roughly 21%, reflecting broader market hesitation and declining momentum. However, beneath this pullback, Litecoin’s higher-timeframe structure is beginning to resemble Monero’s (XMR) long-term bullish setup—a fractal that has caught the attention of several analysts.
Source: Coinmarketcap
The comparison suggests that Litecoin could be quietly positioning itself for a larger move, similar to what Monero has already started to deliver.
Litecoin and Monero: A Fractal Years in the Making
According to a weekly chart shared by crypto analyst CryptoBullet, Litecoin’s structure closely mirrors Monero’s historical price behavior across multiple market cycles.
Both assets:
-
Peaked during the same periods in 2017 and again in 2021
-
Printed slightly higher highs during the 2021 cycle
-
Formed macro higher lows following the 2022 bear market bottom
This is a critical observation. Since the 2022 lows, Litecoin has displayed relative strength, maintaining a structure that aligns almost step-by-step with XMR’s longer-term bullish path. Monero has already begun breaking higher from this formation, which raises the question: Is Litecoin simply lagging behind?
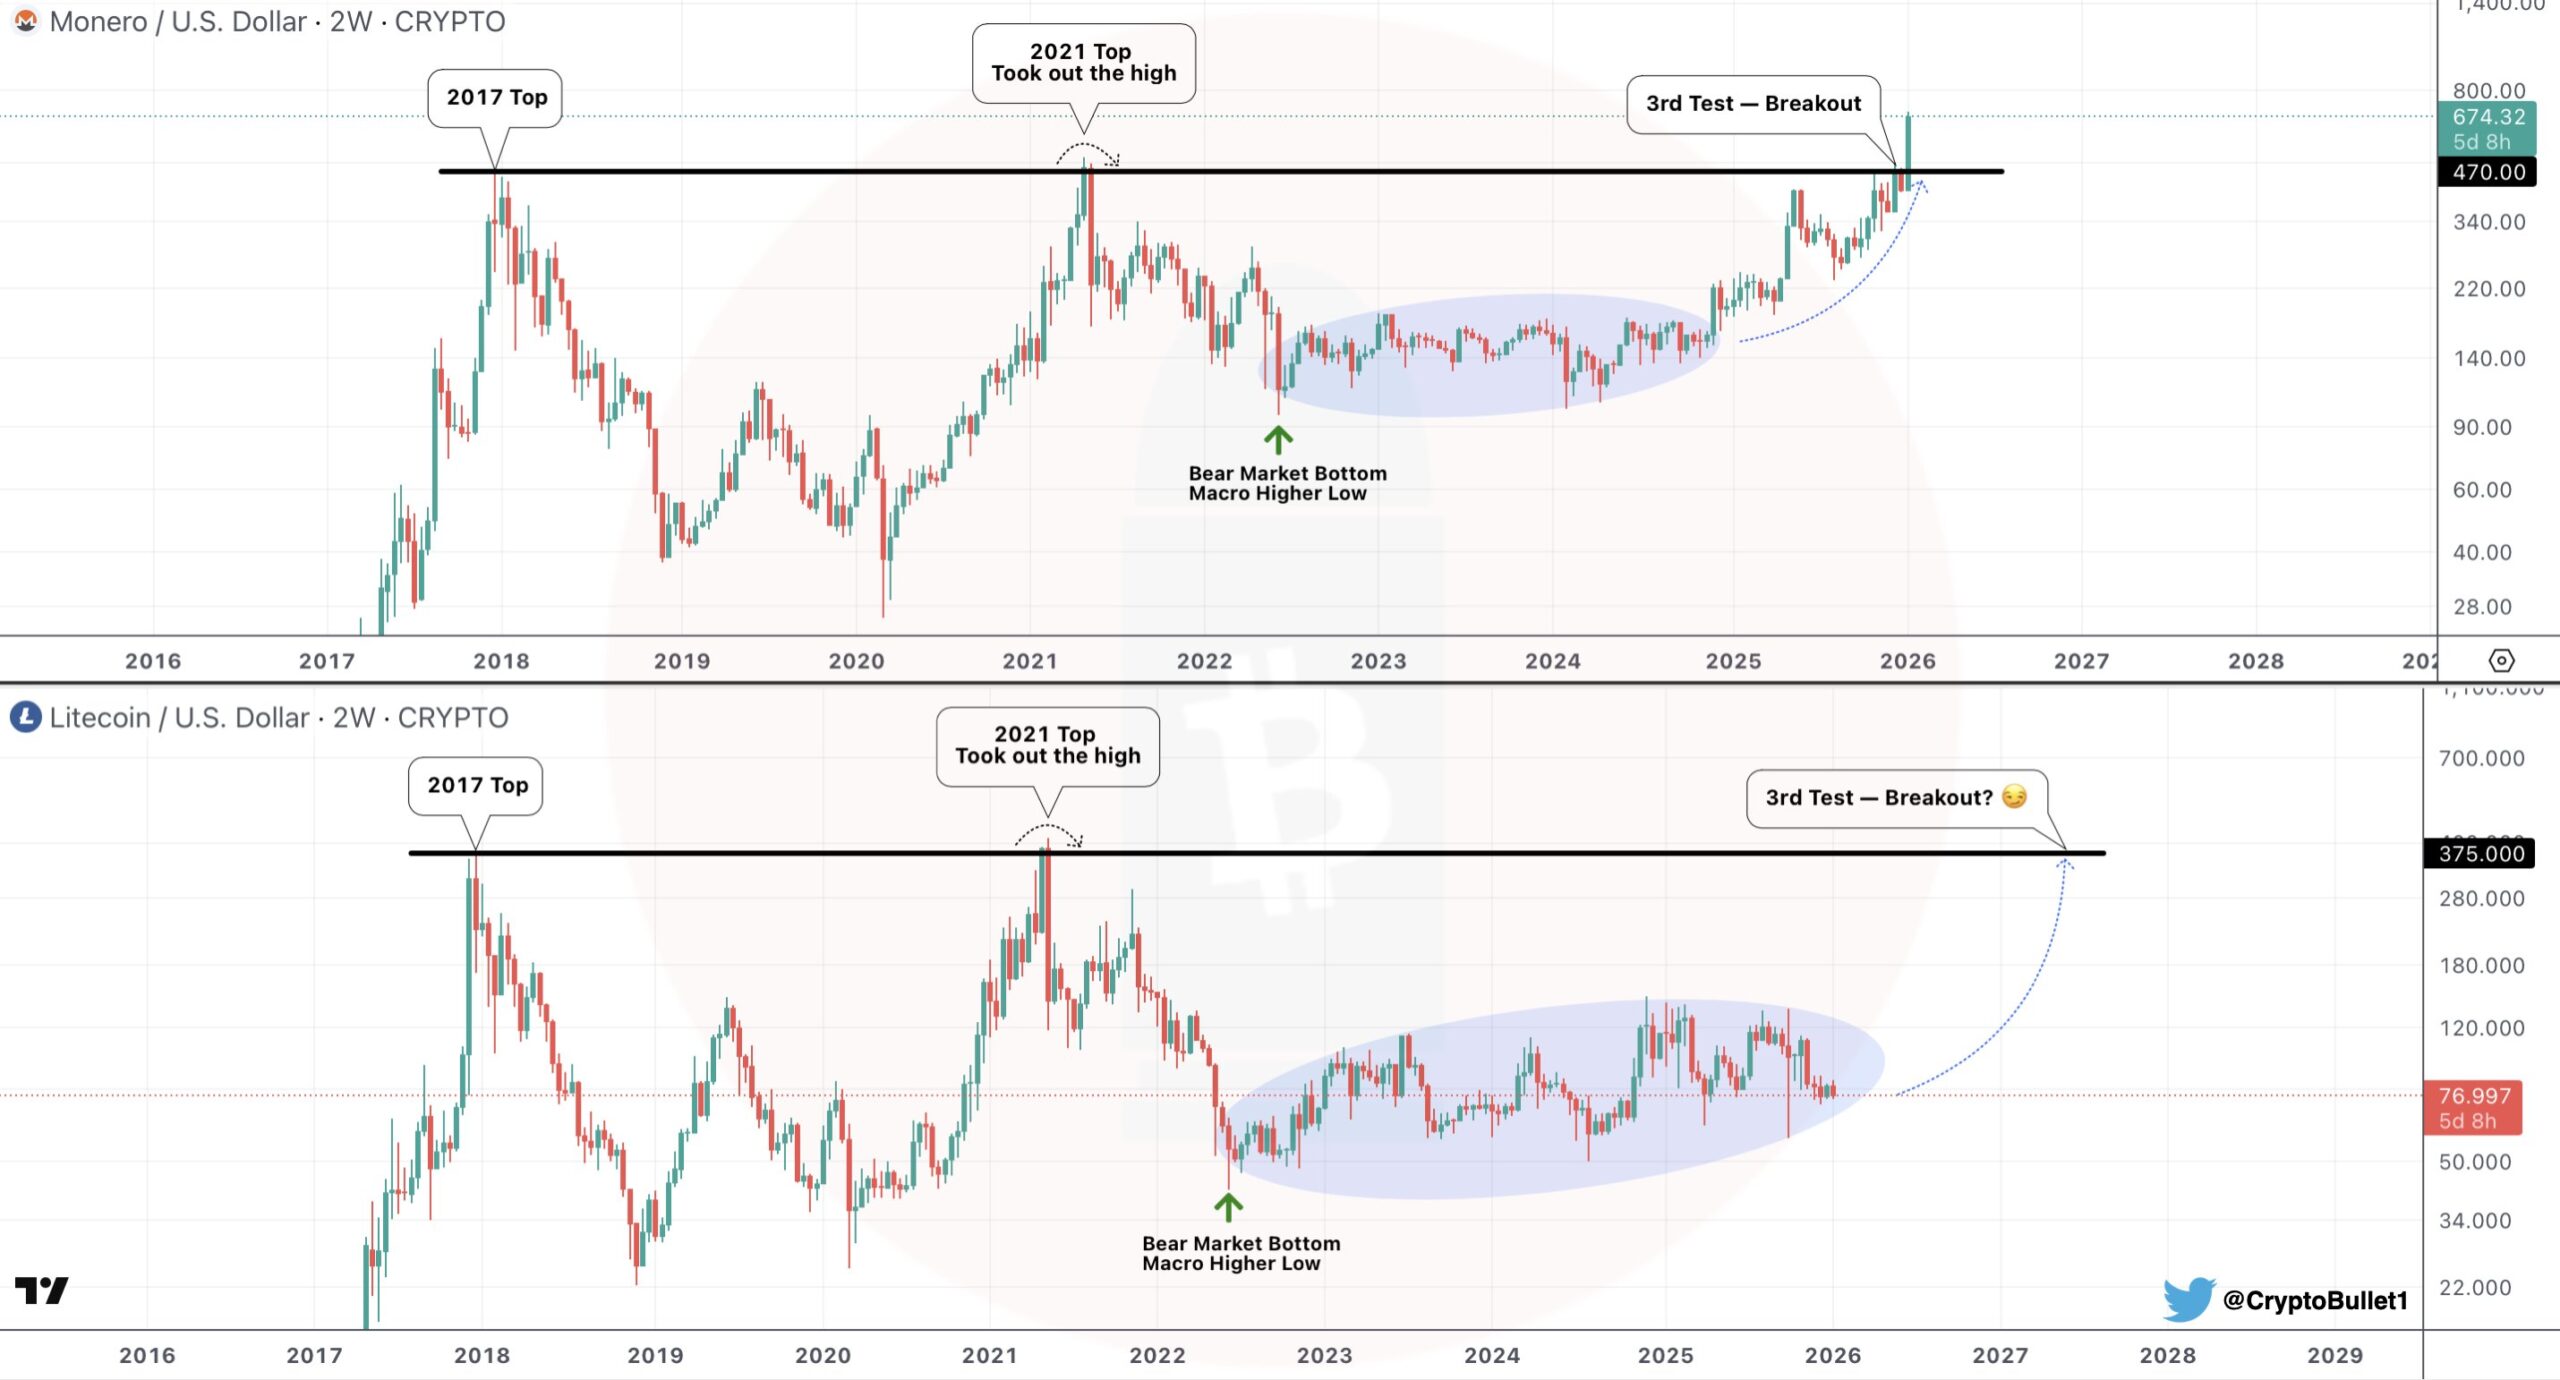
XMR and LTC Weekly Fractal Chart/Credits: @CryptoBullet1 (X)
Fractal patterns like these don’t guarantee identical outcomes, but they often highlight market psychology, especially when two assets have matured through multiple cycles.
Monthly Chart Signals: Long-Term Support in Focus
On the monthly timeframe, analyst @_CryptoSurf highlights another important similarity.
Litecoin is currently testing its long-term rising support trendline near the $75 region, the same structural zone that historically marked accumulation phases during prior cycles. This mirrors Monero’s own behavior before its recent upside expansion.
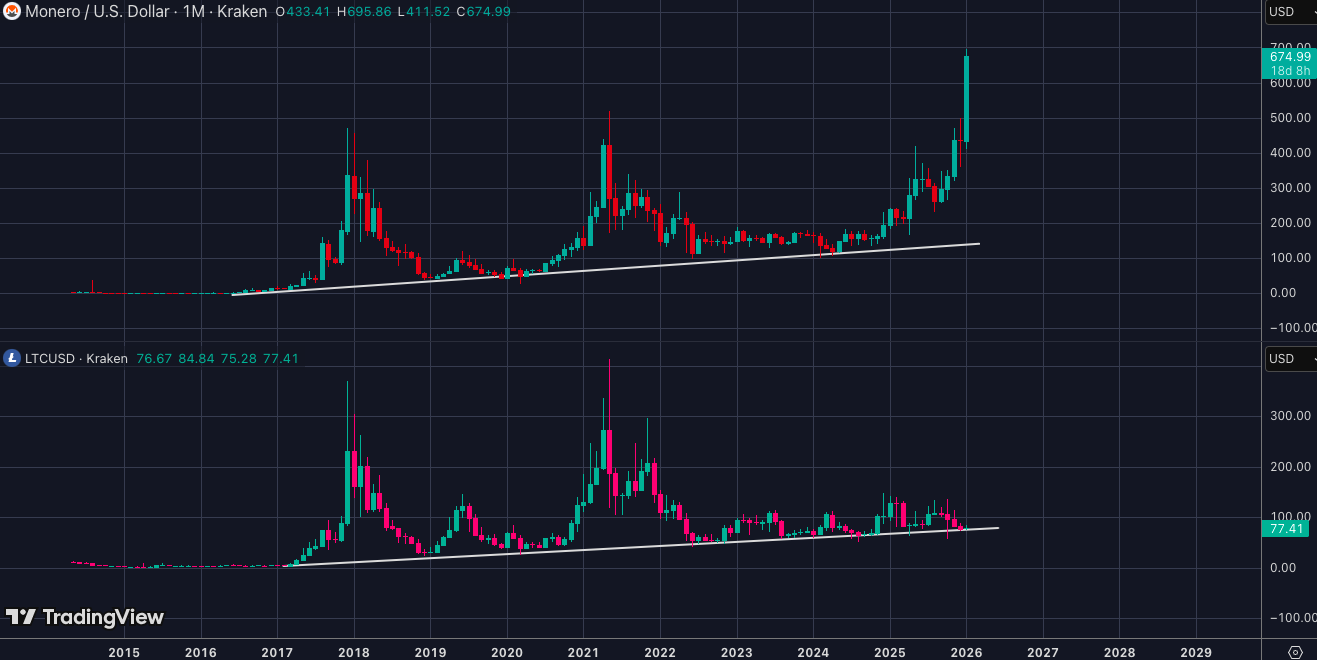
_XMR and LTC Monthly Fractal Chart/Credits: @CryptoSurf (X)
As long as this trendline holds, Litecoin’s broader structure remains intact. Prolonged consolidation at macro support often precedes volatility expansion, particularly when supply pressure dries up after extended drawdowns.
What Could Come Next for Litecoin (LTC)?
If the fractal comparison continues to play out, Litecoin may be approaching the later stages of its base formation.
Monero’s breakout followed:
For Litecoin, a similar roadmap would imply that the current consolidation phase could be a prelude to an upside rally, rather than a sign of weakness. The upper long-term trendline—currently far above price—stands out as the next major technical magnet if bullish momentum returns.
That said, structural support around $75 remains critical. Losing this level would weaken the fractal comparison and delay any bullish scenario.
Bottom Line
Despite recent downside pressure, Litecoin’s higher-timeframe structure suggests the correction may be part of a broader accumulation phase. The strong fractal similarity with Monero’s bullish path indicates that LTC could be lagging rather than weakening. As long as the $75 macro support holds, Litecoin may be positioning itself for a potential breakout in the coming cycle.
Frequently Asked Questions (FAQ)
Is Litecoin following Monero’s bullish price pattern?
Yes, Litecoin’s weekly and monthly charts show a strong fractal similarity to Monero, including shared cycle highs in 2017 and 2021 and a macro higher low formed after the 2022 bear market.
Why is the $75 level important for Litecoin?
The $75 region aligns with Litecoin’s long-term rising support trendline. Holding this level keeps the bullish higher-timeframe structure intact.
Disclaimer: The views and analysis presented in this article are for informational purposes only and reflect the author’s perspective, not financial advice. Technical patterns and indicators discussed are subject to market volatility and may or may not yield the anticipated results. Investors are advised to exercise caution, conduct independent research, and make decisions aligned with their individual risk tolerance.
About Author: Nilesh Hembade is the Founder and Lead Author of Coinsprobe, with over 5 years of experience in the cryptocurrency and blockchain industry. Since launching Coinsprobe in 2023, he has been providing daily, research-driven insights through in-depth market analysis, on-chain data, and technical research.
Disclaimer: The information on this page may come from third parties and does not represent the views or opinions of Gate. The content displayed on this page is for reference only and does not constitute any financial, investment, or legal advice. Gate does not guarantee the accuracy or completeness of the information and shall not be liable for any losses arising from the use of this information. Virtual asset investments carry high risks and are subject to significant price volatility. You may lose all of your invested principal. Please fully understand the relevant risks and make prudent decisions based on your own financial situation and risk tolerance. For details, please refer to
Disclaimer.
Related Articles
Crypto Fear and Greed Index Drops to 30, Signals Panic State
Gate News message, April 25 — The Crypto Fear and Greed Index currently stands at 30, down 8 points from yesterday, according to Coinglass data. The seven-day average is 33, while the 30-day average is 18, indicating a shift toward panic sentiment in the
GateNews18m ago
Not Too Late Yet: Altcoins Eye Rapid Move Ahead of Economic Uncertainty — 5 Picks Investors Are Watching
Market rotation is splitting attention between meme coins and infrastructure-driven blockchain projects.
TAO and FIL reflect stronger alignment with emerging tech and data infrastructure narratives.
DOGE and SHIB remain primarily driven by retail sentiment and short-term volatility
CryptoNewsLand3h ago
Bitcoin Quantum Computing Threat Is Manageable, Real Issue Is Governance: Analyst
Gate News message, April 25 — Bitcoin analyst James Check said quantum computing poses a "manageable risk" rather than a systemic threat to Bitcoin, according to CoinDesk. Approximately 1.7 million BTC are held in Satoshi-era addresses, which could face risk if quantum computing breaks elliptic
GateNews3h ago
Positioned or Left Behind? Altcoins Show Pre-Breakout Momentum with 150%+ Upside — 5 Coins Worth Buying Today
Liquidity is rotating selectively into both DeFi and infrastructure tokens.
Meme assets show higher volatility compared to utility-driven protocols.
Market conditions resemble early-stage accumulation before potential expansion phases.
Market participants are observing renewed accumulati
CryptoNewsLand5h ago
Altcoins Are Not a Lottery: Why Discipline Beats Hype — Top 5 Crypto Coins Worth Buying This Cycle
Markets favor disciplined allocation over hype, with Chainlink/Uniswap tied to DeFi liquidity, and stablecoins as buffers; altcoin cycles face structural shifts amid cautious, liquidity-driven strategies.
Abstract: The article highlights a secular shift in crypto markets from speculative cycles to disciplined, liquidity-aware allocation. It links Chainlink and Uniswap activity to actual DeFi usage and liquidity trends, while stablecoins USDT and USDC serve as buffers amid uncertainty. The outlook emphasizes macro conditions and liquidity shifts as primary determinants of market direction, with institutional actors adopting structured approaches.
CryptoNewsLand5h ago
SUI Price Eyes $1.10 Breakout as Whale Positions Rise
Key Insights
SUI trades at $0.96 with RSI at 53.66, showing neutral momentum while maintaining upside room for expansion toward resistance levels.
Whale positioning at 70% long signals strong institutional confidence, aligning with rising open interest and steady capital inflows despite
CryptoNewsLand9h ago