SUI trades near $0.97 ahead of Grayscale’s GSUI ETF launch on NYSE Arca, with weekly gains of 10% and rising open interest.
SUI price is trading near key resistance levels as Grayscale prepares to launch its Sui Staking ETF under the ticker GSUI.
The token has posted steady weekly gains, and traders are watching whether the ETF debut could drive further price movement.
SUI Records Weekly Gains Ahead of ETF Launch
SUI traded around $0.97 on Wednesday after a modest daily increase of less than 1%.
Over the past seven days, the token has gained about 10%, reflecting gradual upward momentum.
The broader crypto market has also shown signs of recovery. Bitcoin traded above $68,000, while Ethereum hovered near the $2,000 level.
Other major altcoins such as Solana, XRP, and Dogecoin recorded mild gains during the same period.
SUI has remained above the $0.90 support zone in recent sessions. Market participants are monitoring whether sustained trading above $0.98 could support additional upside pressure.
Grayscale’s GSUI ETF Set for NYSE Arca Trading
Grayscale Investment confirmed that its Sui Staking ETF will begin trading on NYSE Arca under the ticker GSUI.
The launch follows an 8-A filing with the US Securities and Exchange Commission, which became effective automatically.
Grayscale Sui Staking ETF (Ticker: $GSUI) offers investors direct exposure to $SUI. 💧 $GSUI starts trading tomorrow on @NYSE Arca. pic.twitter.com/HzhTyAd3pd
— Grayscale (@Grayscale) February 18, 2026
The ETF is designed to provide regulated exposure to the SUI token. Investors will gain access to SUI price performance and potential staking rewards through a traditional exchange-traded product structure.
The fund carries a management fee of 0.35%, though Grayscale stated that the fee will be waived for the first three months.
The waiver remains in place until assets under management reach $1 billion. The launch adds another crypto-linked ETF to US markets.
**Related Reading: **$143M in Short Liquidations Stack Above SUI – What Happens Next?
Technical Indicators and Price Levels in Focus
SUI recently tested resistance near the $1.20 level after stabilizing above $1.00. Analysts are observing whether the token can break above this resistance and approach the $1.50 range.
The Relative Strength Index stands near 52, which suggests moderate bullish momentum without entering overbought territory. Meanwhile, the Moving Average Convergence Divergence indicator shows the short-term line approaching the signal line.
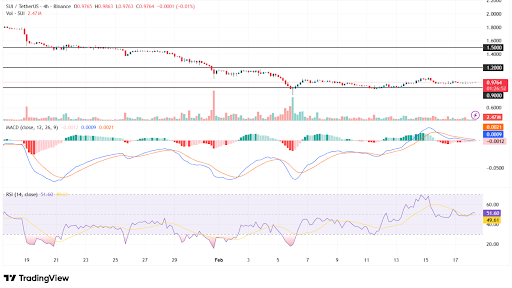
SUI consolidates near resistance as momentum cools. Source: TradingView
Open interest in SUI derivatives rose by 0.82% to about $512.65 million. The increase suggests growing trading activity as the ETF launch approaches.
Traders continue to monitor the $0.90 support level, as a break below that area could shift short-term price direction.
Disclaimer: The information on this page may come from third parties and does not represent the views or opinions of Gate. The content displayed on this page is for reference only and does not constitute any financial, investment, or legal advice. Gate does not guarantee the accuracy or completeness of the information and shall not be liable for any losses arising from the use of this information. Virtual asset investments carry high risks and are subject to significant price volatility. You may lose all of your invested principal. Please fully understand the relevant risks and make prudent decisions based on your own financial situation and risk tolerance. For details, please refer to
Disclaimer.
Related Articles
PEPE Reclaims 0.00000400 — Is This 1.8% Move the Start of a Bigger Run?
PEPE rebounds from 0.00000385 support, forming higher lows and stronger bullish structure.
Technical indicators like MACD and RSI show momentum with room for further upside.
Key resistance at 0.00000410; support at 0.00000380 critical for trend continuation.
PepeCoin — PEPE, has
CryptoNewsLand4h ago
ETH drops 0.58% in 15 minutes: derivatives liquidity contraction and proactive position reduction dominate short-term pullback
From 2026-04-19 04:30 to 2026-04-19 04:45 (UTC), within ETH’s 15-minute candlestick chart, the return recorded -0.58%, and the price range was 2321.62 to 2342.04 USDT, with an amplitude of 0.87%. The short-term selloff occurred against a backdrop of increased overall market volatility and a broad decline in the prices of major crypto assets; overall market risk appetite clearly fell, and traders’ wait-and-see sentiment strengthened.
The main driver behind this abnormal move is a sharp contraction in liquidity in the derivatives market and leveraged funds proactively reducing positions. Data shows that over the past 24 hours, the ETH/USD perpetual contract trading volume dropped 67.16% to approximately 74.87 million, open interest edged down 3.33% to 329 million, and liquidation amounts did not expand unusually. This structure indicates that the market lacks the risk of passive cascades; more funds chose to proactively step aside and wait on the sidelines, intensifying short-term selling pressure.
In addition, the long/short structure in which shorts held the upper hand (long/short ratio 47.48%:52.52%) and sentiment synchronization with the panic range reinforced the downward price trend. During the same period, major coins such as BTC and SOL also fell 2%-3.4% in tandem, further showing that this pullback was driven by system-wide risk sentiment. On-chain funds did not show any large abnormal transfers or large-scale liquidations of DeFi protocols; spot and on-chain liquidity remained generally stable, and no sudden system risk resonance was observed.
Current volatility-related risks still need close monitoring, especially as overall risk appetite continues to contract—ETH’s short-term price may face further downside probing. Watch subsequent changes in derivatives trading volume and open interest, extreme shifts in the long/short ratio and funding rate, and promptly monitor on-chain fund flows, large transfers, and any signs of amplified platform net outflows. For more market anomalies and deeper analysis, please continue to follow our upcoming market updates.
GateNews4h ago
Spark Protocol's January delisting of rsETH proves prudent as Aave faces ETH liquidity crisis
Spark Protocol's strategy of delisting low-usage assets and tightening collateral has faced initial backlash but proved wise during market turmoil. While maintaining higher interest rate caps, SparkLend ensures liquidity, unlike Aave, which now faces significant risks.
GateNews5h ago
Request Network (REQ) Surges 23.68% in 15 Minutes, 24-Hour Gain Reaches 116.52%
Request Network (REQ) surged 23.68% in just 15 minutes, reaching $0.152, with a 24-hour rise of 116.52% and trading volume over $8 million. Factors include retail interest and whale accumulation. Resistance at $0.160 and support at $0.122 are under observation.
GateNews6h ago
Solana Price Stalls Near $80 as ETF Outflows Weigh
Solana trades around $80, facing bearish sentiment due to ETF outflows and declining retail participation. Technical indicators show mixed signals, with resistance at $87 and $98, while support at $77 remains critical for stability.
CryptoFrontNews11h ago
Dogecoin Holds $0.094 as X Cashtags Drive Market Attention
Key Insights
Dogecoin holds above $0.094 despite market weakness as Bitcoin and Ethereum stabilize, reflecting resilience and sustained demand across major cryptocurrencies during the consolidation phase.
X launches smart cashtags enabling real-time crypto and stock tracking, improving marke
CryptoNewsLand14h ago
