XRP Taps Critical Support but is a Retest of $0.55 Incoming? (Ripple Price Analysis)
After experiencing significant volatility, Ripple’s price underwent an impulsive bearish leg characterized by large red candles with notable shadows.
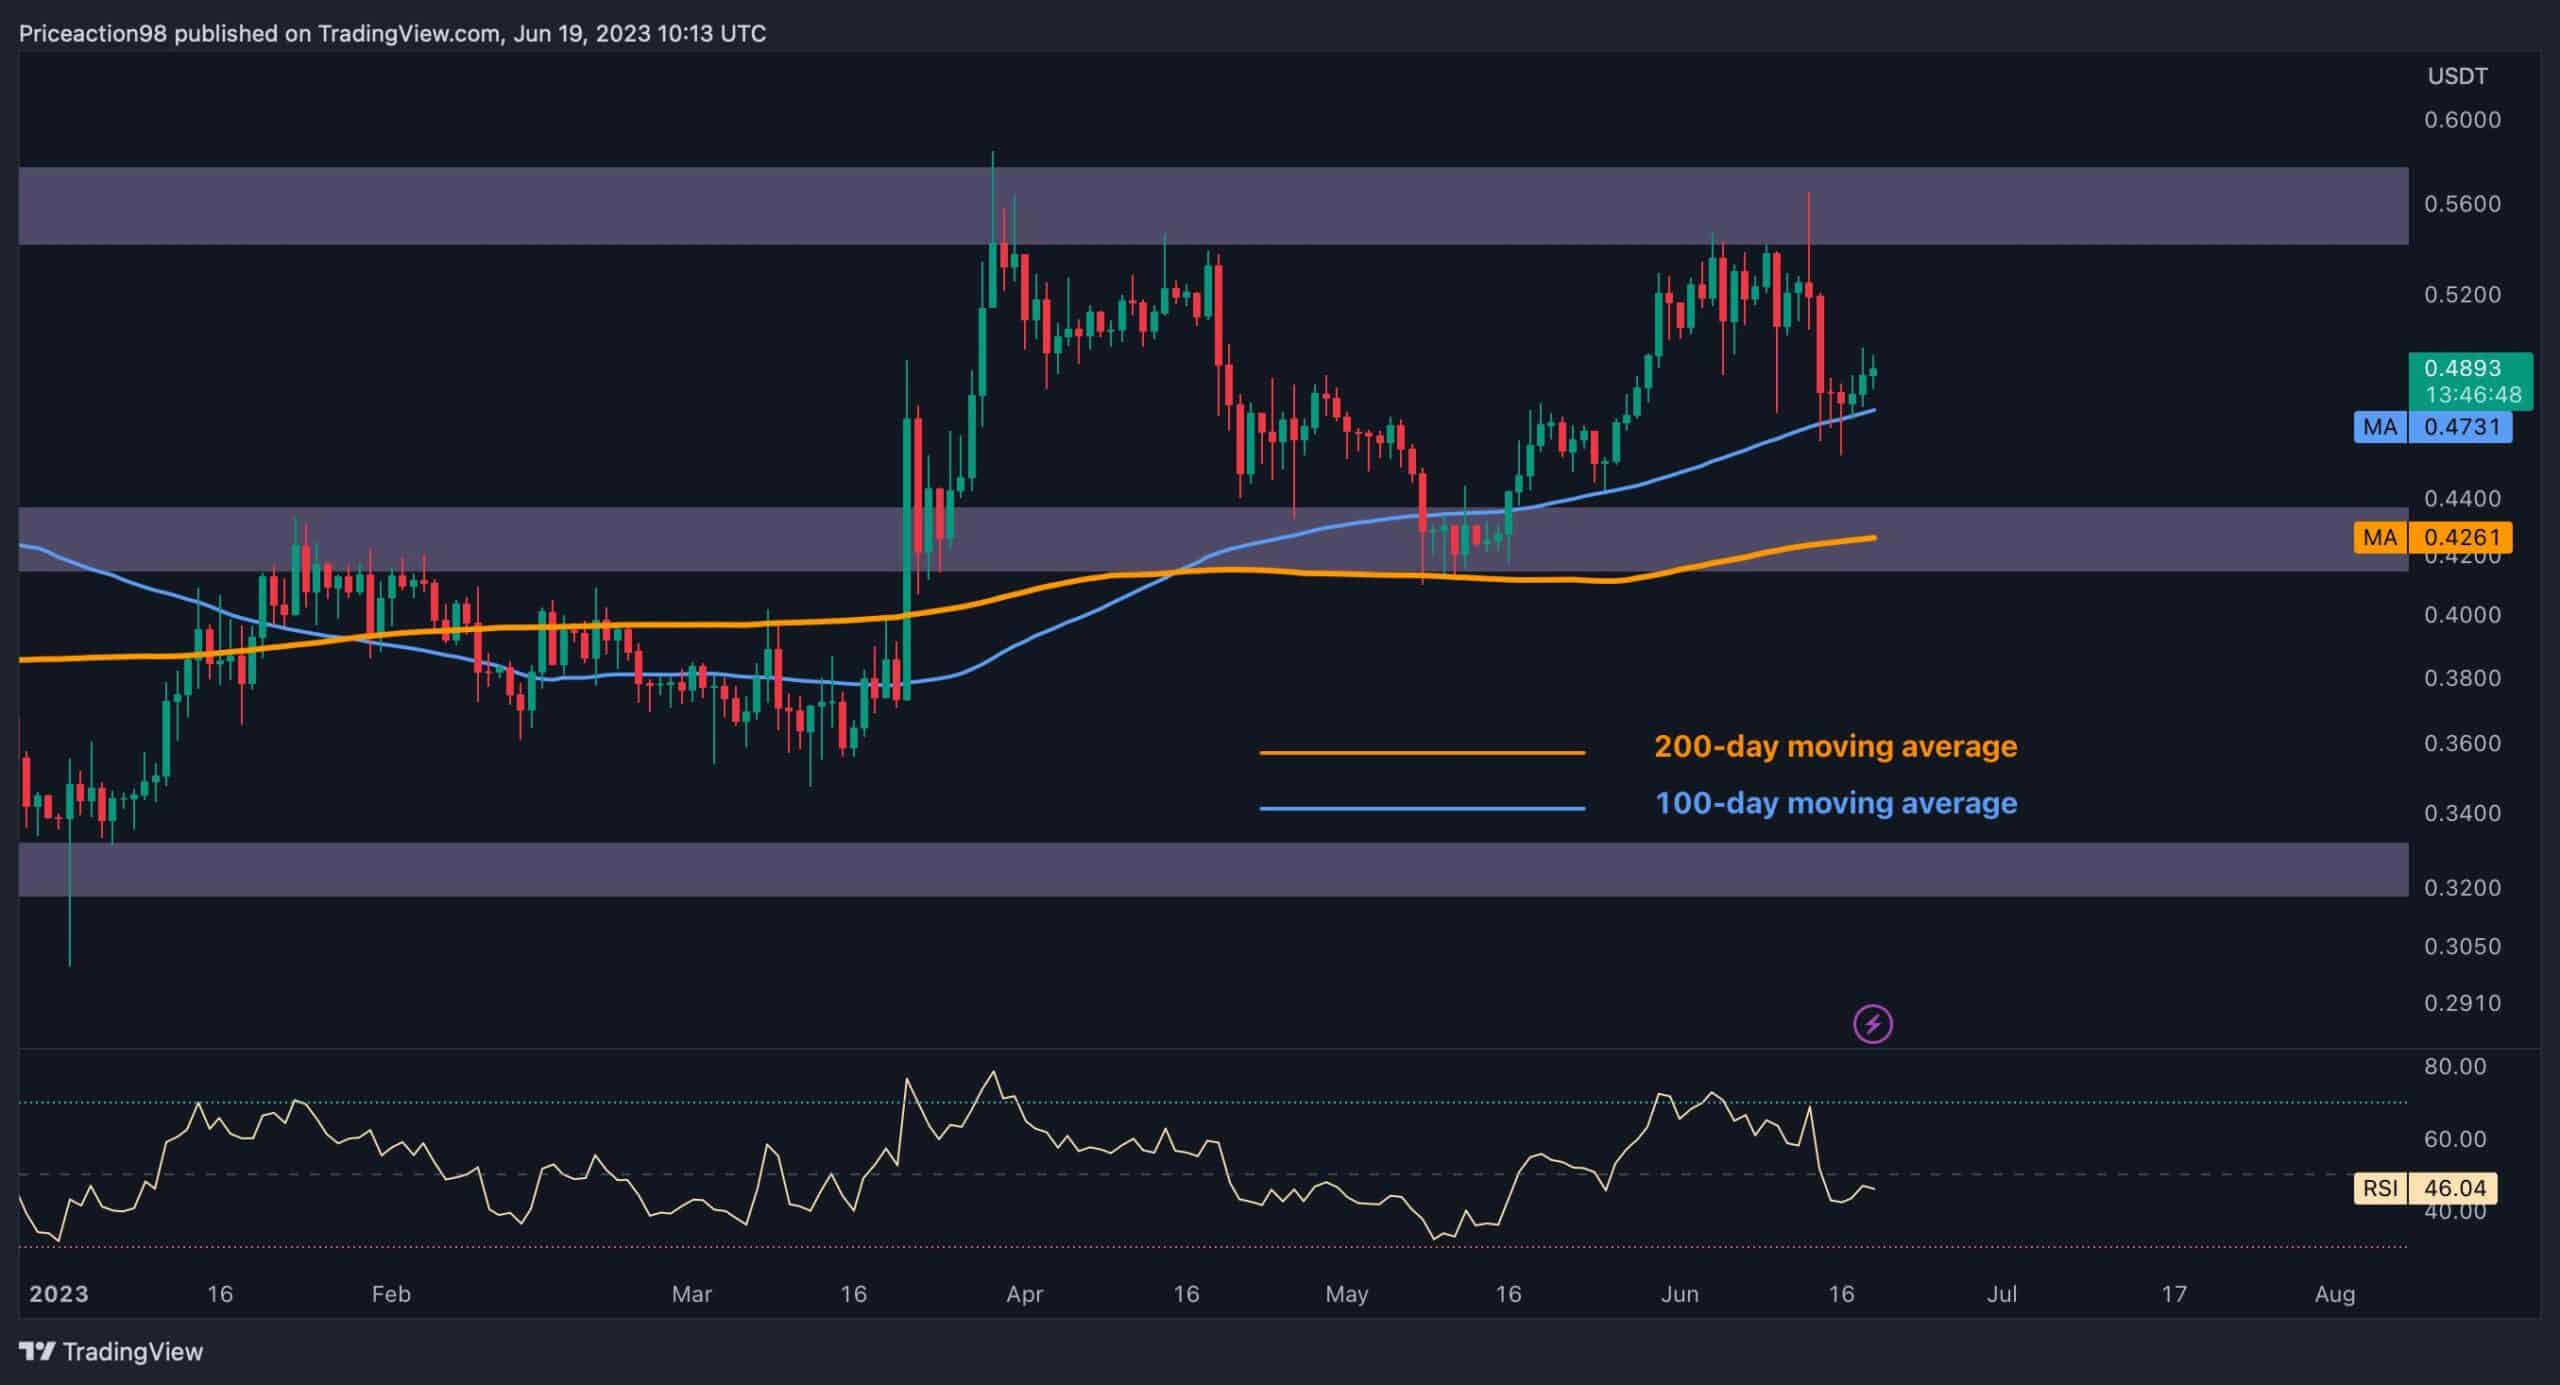
XRP ultimately reached the 100-day moving average at $0.47, which serves as strong support. However, if it breaks below this level, another cascade will become possible.
Ripple Price Technical Analysis
By Shayan
The Daily Chart
Ripple’s price went through extreme volatility around the crucial resistance region of $0.5, resulting in choppy PA lacking a clear direction. Nevertheless, the cryptocurrency experienced a substantial decline and reached a significant support region encompassing the 100-day moving average situated at $0.47.
Furthermore, a double-top pattern has formed at the $0.55 zone, indicating a bearish outlook for Ripple in the short term.
However, it could also be the case that the price will enter a consolidation stage in the short term, considering the buying power observed around this crucial support region. Nonetheless, it should be noted that if XRP plummets below the moving average, a cascade toward the 200-day MA, currently positioned at $0.42, would be the most probable scenario for Ripple.
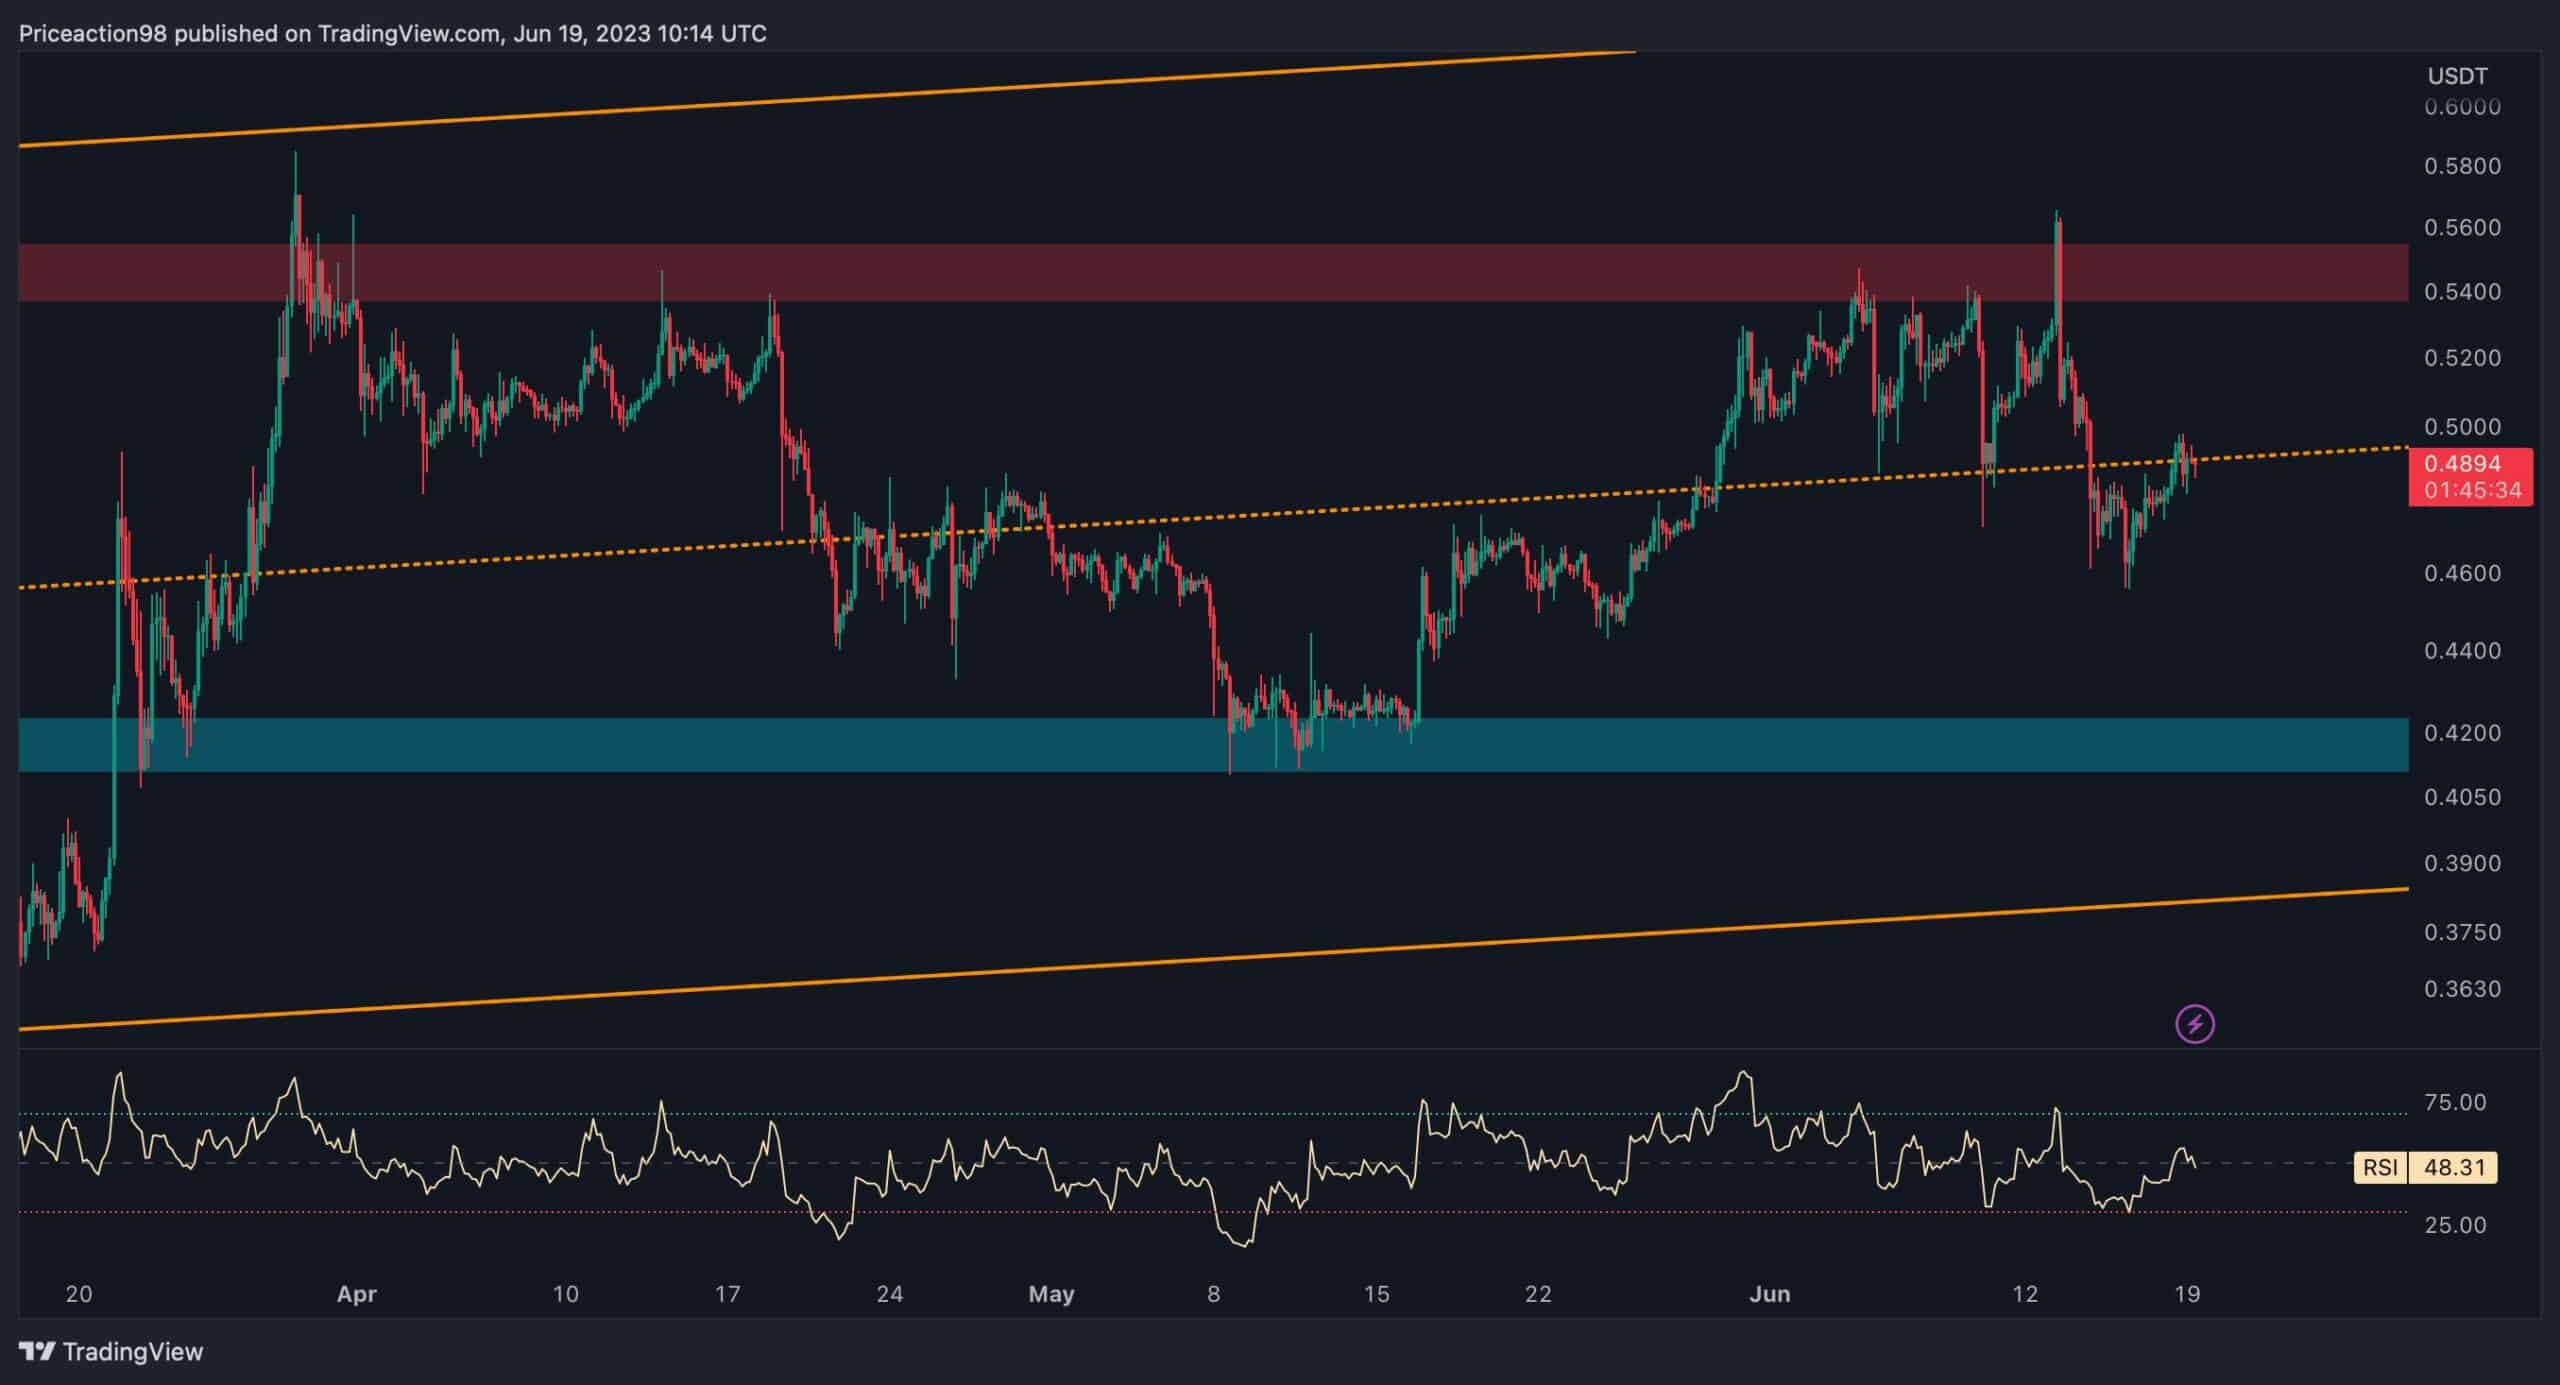
Shifting the focus to the 4-hour chart, the aforementioned volatility becomes more apparent. The price started increasing initially, surpassing the significant resistance level at $0.55 but subsequently reversed and experienced a substantial decline towards the middle boundary of the channel.
This development, along with the break below the channel’s mid-boundary at $0.49, indicates a bearish outlook for Ripple in the short term.
However, the price has retraced back to the broken level, forming a pullback and confirming a valid bearish trend. Consequently, if the mid-trendline rejects the price, a cascade towards the static support region of $0.42 would become a possibility. Conversely, breaching the aforementioned trendline up may potentially trigger an uptrend toward the $0.55 resistance zone.