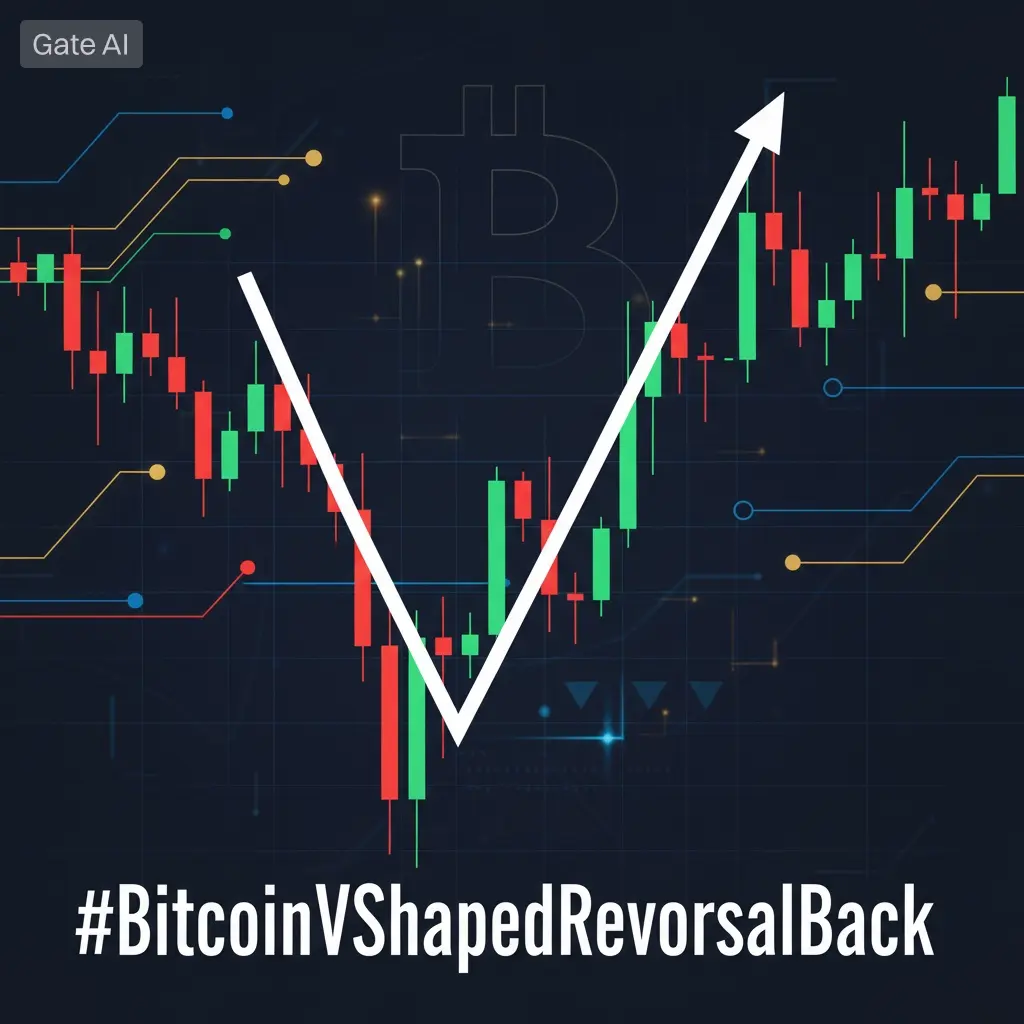

#BitcoinVShapedReversalBack
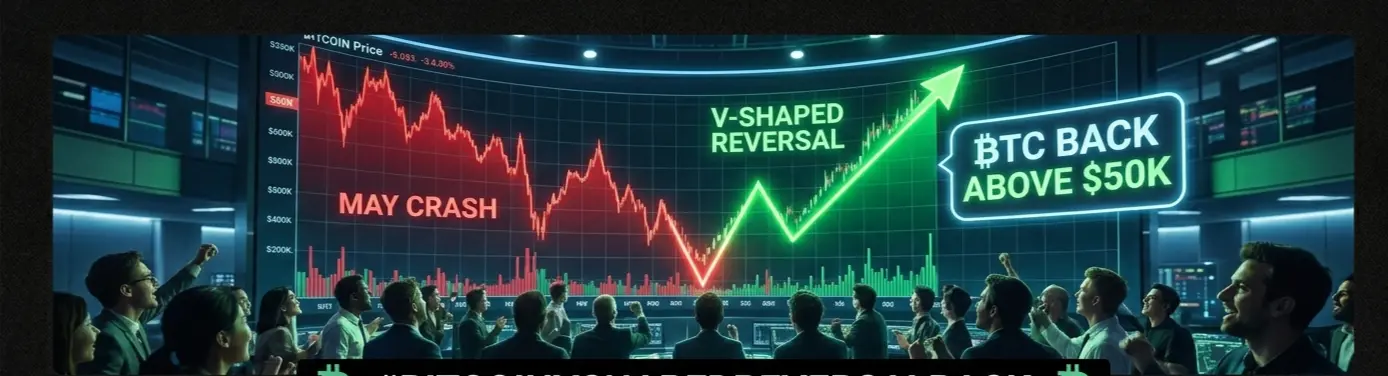
🚨🔥 𝗕𝗜𝗧𝗖𝗢𝗜𝗡 𝗘𝗫𝗣𝗟𝗢𝗗𝗘𝗦 𝗜𝗡 𝗩-𝗦𝗛𝗔𝗣𝗘𝗗 𝗥𝗘𝗩𝗘𝗥𝗦𝗔𝗟 𝗕𝗨𝗟𝗟𝗦 𝗦𝗡𝗔𝗧𝗖𝗛 𝗕𝗔𝗖𝗞 𝗖𝗢𝗡𝗧𝗥𝗢𝗟 📈⚡
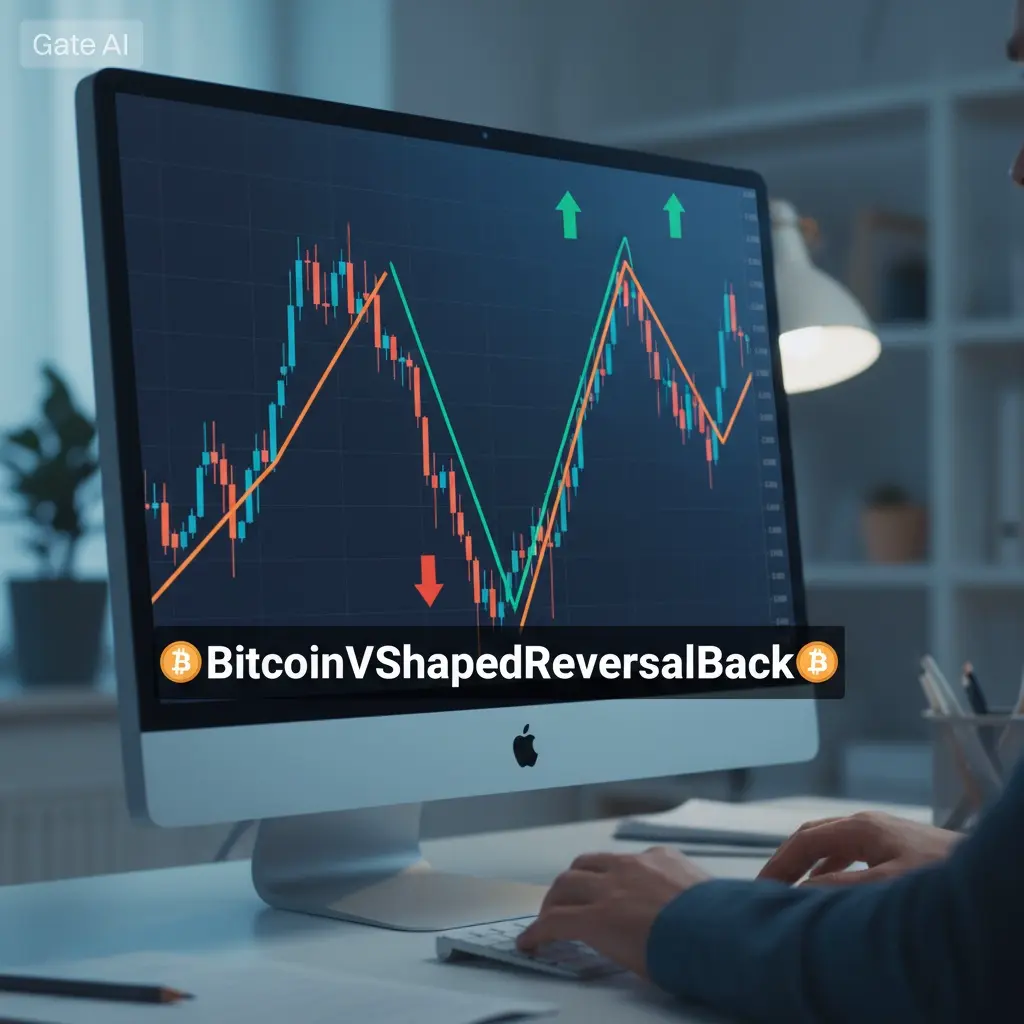
Bitcoin shocked the market in the early hours of May 15 with a violent V-shaped reversal that completely shifted short-term sentiment across the crypto sector. After collapsing below the $79,000 level and triggering fear across leveraged positions, BTC suddenly reversed direction with aggressive momentum, surging back above $82,000 in a powerful recovery move. 🚀🔥
The structure of the move was not random.
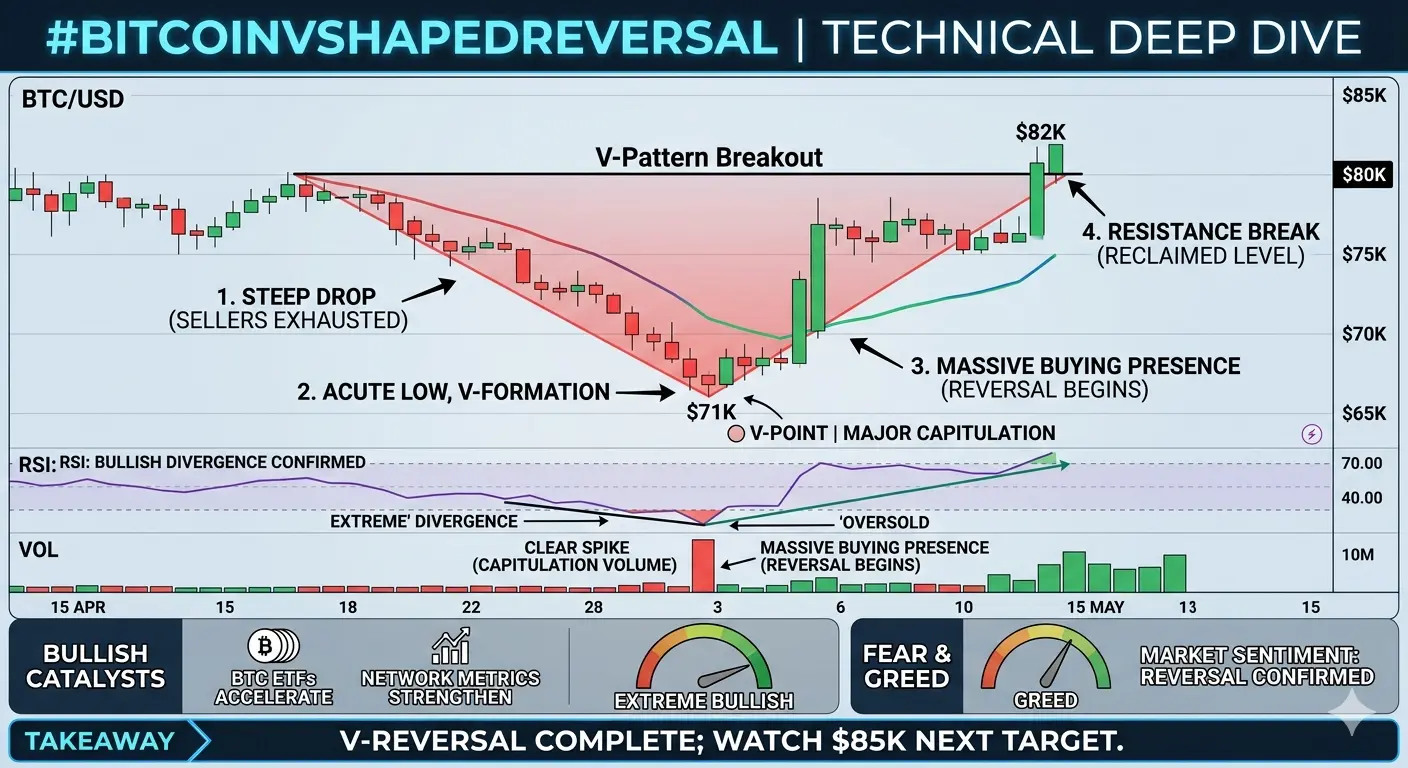
On the 4-hour chart, Bitcoin formed a clean double-bottom setup before buyers stepped in aggressively with rising volume and strong bullish continuation candles. What made this move especially important was how quickly the market repaired the previous breakdown. Bears were in control for only a short period before momentum completely flipped against them.
This was more than just a bounce.
It was a liquidity-driven reversal that trapped emotional sellers at the lows while forcing late short positions into rapid exits. The market essentially punished weakness and rewarded patience within hours. ⚔️📊
Several major catalysts fueled the move.
Positive sentiment surrounding the CLARITY Act injected optimism back into crypto markets, while strong momentum from tech giants like Nvidia created additional risk-on pressure across speculative assets. As traditional tech strength expanded, crypto traders quickly rotated back into high-beta exposure, accelerating Bitcoin’s rebound.
But despite the explosive recovery, one critical detail remains impossible to ignore:
⚠️ Heavy selling pressure is still sitting above the $82,000 zone.
Every push into higher levels is currently meeting resistance, suggesting that larger players are still distributing into strength rather than fully committing to a breakout continuation.
That means the market is not yet in confirmed trend expansion mode.
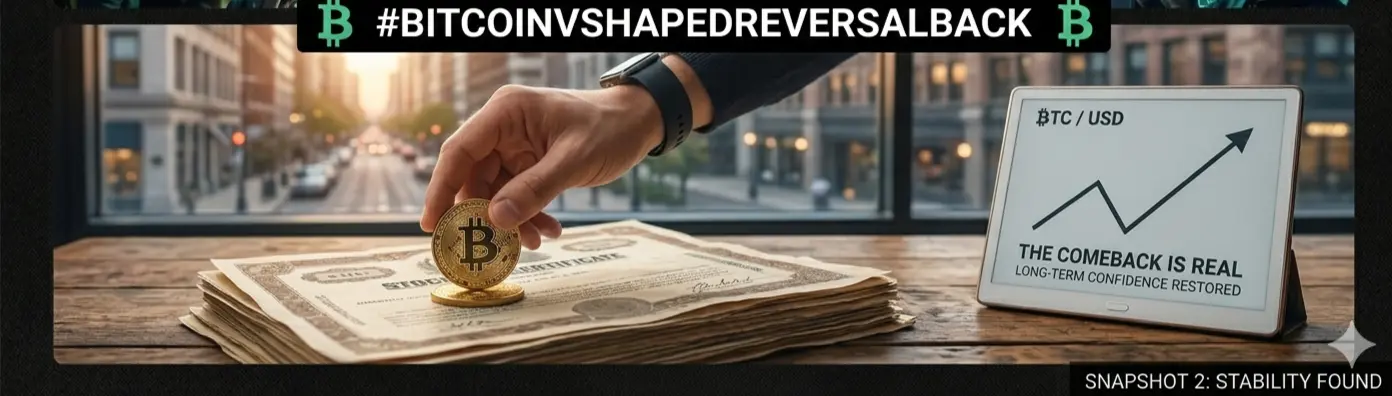
Right now, Bitcoin remains trapped inside a volatile short-term range where both bulls and bears are fighting aggressively for control. The V-shaped recovery repaired structure damage — but it did not officially confirm a new macro uptrend.
This is where emotional traders often make mistakes.
Many traders see one powerful green candle and immediately assume “new bull run.”
Professional traders understand something deeper:
Strong reversals inside ranges can still become liquidity traps if follow-through momentum disappears. 🧠⚡
The next major confirmation for bulls is simple:
📌 Sustained acceptance above resistance
📌 Continued volume expansion
📌 Strong higher-low formations
📌 Breakout continuation without immediate rejection
Without those confirmations, Bitcoin risks turning this recovery into another short-term volatility cycle rather than a true breakout phase.
One thing is clear though:
The market just reminded everyone how brutally fast sentiment can change.
Fear became FOMO in a matter of hours.
And in crypto…
That transition happens faster than most traders are psychologically prepared for. 🚀🔥
🚨🔥 𝗕𝗜𝗧𝗖𝗢𝗜𝗡 𝗘𝗫𝗣𝗟𝗢𝗗𝗘𝗦 𝗜𝗡 𝗩-𝗦𝗛𝗔𝗣𝗘𝗗 𝗥𝗘𝗩𝗘𝗥𝗦𝗔𝗟 𝗕𝗨𝗟𝗟𝗦 𝗦𝗡𝗔𝗧𝗖𝗛 𝗕𝗔𝗖𝗞 𝗖𝗢𝗡𝗧𝗥𝗢𝗟 📈⚡
Bitcoin shocked the market in the early hours of May 15 with a violent V-shaped reversal that completely shifted short-term sentiment across the crypto sector. After collapsing below the $79,000 level and triggering fear across leveraged positions, BTC suddenly reversed direction with aggressive momentum, surging back above $82,000 in a powerful recovery move. 🚀🔥
The structure of the move was not random.
On the 4-hour chart, Bitcoin formed a clean double-bottom setup before buyers stepped in aggressively with rising volume and strong bullish continuation candles. What made this move especially important was how quickly the market repaired the previous breakdown. Bears were in control for only a short period before momentum completely flipped against them.
This was more than just a bounce.
It was a liquidity-driven reversal that trapped emotional sellers at the lows while forcing late short positions into rapid exits. The market essentially punished weakness and rewarded patience within hours. ⚔️📊
Several major catalysts fueled the move.
Positive sentiment surrounding the CLARITY Act injected optimism back into crypto markets, while strong momentum from tech giants like Nvidia created additional risk-on pressure across speculative assets. As traditional tech strength expanded, crypto traders quickly rotated back into high-beta exposure, accelerating Bitcoin’s rebound.
But despite the explosive recovery, one critical detail remains impossible to ignore:
⚠️ Heavy selling pressure is still sitting above the $82,000 zone.
Every push into higher levels is currently meeting resistance, suggesting that larger players are still distributing into strength rather than fully committing to a breakout continuation.
That means the market is not yet in confirmed trend expansion mode.
Right now, Bitcoin remains trapped inside a volatile short-term range where both bulls and bears are fighting aggressively for control. The V-shaped recovery repaired structure damage — but it did not officially confirm a new macro uptrend.
This is where emotional traders often make mistakes.
Many traders see one powerful green candle and immediately assume “new bull run.”
Professional traders understand something deeper:
Strong reversals inside ranges can still become liquidity traps if follow-through momentum disappears. 🧠⚡
The next major confirmation for bulls is simple:
📌 Sustained acceptance above resistance
📌 Continued volume expansion
📌 Strong higher-low formations
📌 Breakout continuation without immediate rejection
Without those confirmations, Bitcoin risks turning this recovery into another short-term volatility cycle rather than a true breakout phase.
One thing is clear though:
The market just reminded everyone how brutally fast sentiment can change.
Fear became FOMO in a matter of hours.
And in crypto…
That transition happens faster than most traders are psychologically prepared for. 🚀🔥