
**Date: **Mon, Jan 05, 2026 | 07:04 AM GMT
As 2026 kicks off, the broader cryptocurrency market is showing renewed stability. Ethereum (ETH) is up around 4% on the week, and improving sentiment is gradually spreading across major altcoins — including the AI-focused blockchain token Near Protocol (NEAR).
NEAR has already gained more than 10% on a weekly basis, but the more important development is unfolding beneath the surface. Recent price action points to a notable structural shift — one that could mark the early stages of a bullish continuation if key resistance levels are reclaimed.
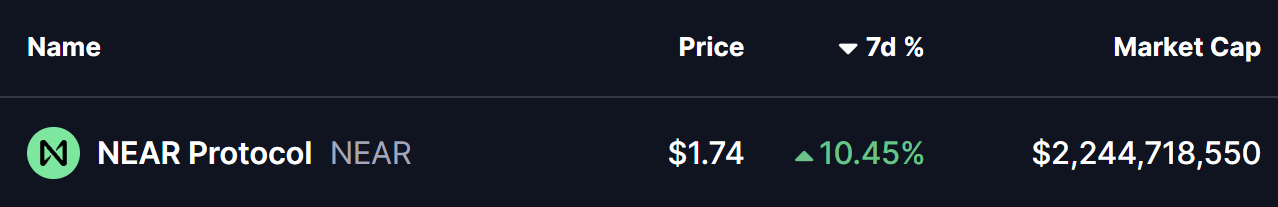
Source: Coinmarketcap
Rounding Bottom in Play
On the daily timeframe, NEAR appears to be forming a rounding bottom pattern, a classic bullish reversal structure that typically emerges after a prolonged corrective phase. This pattern reflects a gradual transition from distribution to accumulation, as selling pressure fades and buyers slowly regain control.
The setup began after NEAR faced a firm rejection near the $1.88 region late last month. That rejection triggered a sharp decline, dragging price down toward the $1.40 area. Importantly, sellers failed to push price meaningfully lower from there, and strong demand emerged at those levels. Over time, NEAR stabilized, volatility compressed, and price began to curl higher — completing the rounded base structure.
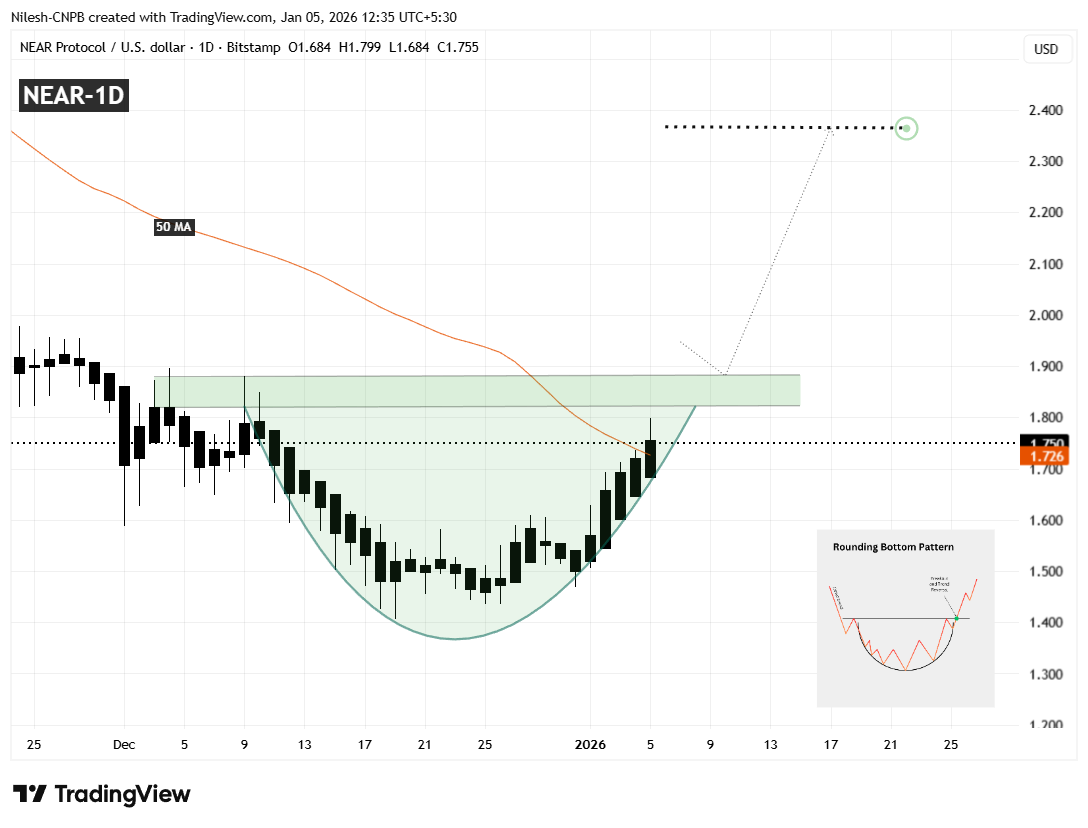
Near Protocol (NEAR) Daily Chart/Coinsprobe (Source: Tradingview)
After reclaiming the 50-day moving average near $1.726, NEAR has shown improving momentum. Currently, price is trading around the $1.75 level and pressing up against a well-defined resistance zone between $1.82 and $1.88. This area represents the neckline of the rounding bottom pattern and has capped upside attempts multiple times in the past, making it the most critical level to watch in the near term.
What’s Next for NEAR?
If NEAR continues to hold the 50-day moving average as support, a clean daily close above the $1.82–$1.88 resistance zone would confirm the bullish rounding bottom breakout. A successful breakout followed by a retest of this zone as support would significantly strengthen the bullish case and signal that a new upward leg is underway.
Based on the depth of the rounding structure, the projected upside target points toward the $2.36 region. Reaching that level would imply a potential upside of roughly 35% from current prices, aligning well with the measured move typically associated with this pattern.
That said, patience remains important. Before any confirmed breakout, NEAR could still experience short-term pullbacks — including a dip toward the rising base of the rounding structure, which has been acting as dynamic support during the recovery. Such pullbacks would not invalidate the bullish setup as long as price continues to hold above the higher-low structure.
Until a decisive breakout and follow-through occur, traders may want to remain cautious and avoid chasing price. The $1.82–$1.88 zone remains the line in the sand that will determine whether NEAR transitions into a sustained bullish phase or remains range-bound for longer.
Disclaimer: The views and analysis presented in this article are for informational purposes only and reflect the author’s perspective, not financial advice. Technical patterns and indicators discussed are subject to market volatility and may or may not yield the anticipated results. Investors are advised to exercise caution, conduct independent research, and make decisions aligned with their individual risk tolerance.
About Author: Nilesh Hembade is the Founder and Lead Author of Coinsprobe, with over 5 years of experience in the cryptocurrency and blockchain industry. Since launching Coinsprobe in 2023, he has been providing daily, research-driven insights through in-depth market analysis, on-chain data, and technical research.
Disclaimer: The information on this page may come from third parties and does not represent the views or opinions of Gate. The content displayed on this page is for reference only and does not constitute any financial, investment, or legal advice. Gate does not guarantee the accuracy or completeness of the information and shall not be liable for any losses arising from the use of this information. Virtual asset investments carry high risks and are subject to significant price volatility. You may lose all of your invested principal. Please fully understand the relevant risks and make prudent decisions based on your own financial situation and risk tolerance. For details, please refer to
Disclaimer.
Related Articles
Over $14 billion in options expiry looming! Bitcoin drops below $70,000, with $75,000 becoming a key battleground.
Bitcoin was pressured by a large-scale options expiration on March 27, 2026, causing the price to fall below $70,000, with a low of $69,990. The expiration of options contracts led to price volatility, especially around $75,000, while macro factors such as geopolitical risks and developments in crypto ETFs also influenced market sentiment. Technical analysis shows Bitcoin remains in an upward trend, with a short-term key range of $69,000 to $71,000.
GateNews42m ago
Chainlink (LINK) rebounds in April strengthen signals: whale accumulation, ETF inflows, and supply tightening resonate
Chainlink (LINK) experienced its first bullish candle in March 2026 after six months of decline, indicating an improvement in market sentiment. Whales and medium-sized holder addresses continue to add positions, and institutional demand remains steadily increasing, suggesting a growing willingness for medium- to long-term capital accumulation. Reduced supply and increased on-chain accumulation alleviate selling pressure. LINK is approaching a key support zone; holding this level could signal a reversal. However, macroeconomic uncertainties may still limit the upside potential.
GateNews44m ago
Pi Network (PI) ends 7 months of silence: volatility surges + negative correlation, Bitcoin's rise actually becomes a bearish signal?
Pi Network (PI) has experienced 7 months of low-volatility compression, leading to a clear change in market structure, with the current price around $0.1883. Recent volatility has rebounded above 100%, indicating a new phase in the market, but its rebound potential may be limited by its negative correlation with Bitcoin. Technical analysis shows a potential double-top pattern; if the price drops below $0.1894, it could fall to $0.1527. Short-term trends will be influenced by technical structures and changes in its correlation with Bitcoin.
GateNews45m ago
Ethereum hits the crucial $2,500 mark: capital outflows surge, but valuation risks emerge
Ethereum's current price remains above $2,100 and is in an upward channel, but a breakthrough of the key resistance at $2,393 is needed to continue rising toward $2,500. Meanwhile, on-chain fund inflows are increasing, indicating that investors are inclined to hold long-term, but valuation pressure is rising, and the impact of on-chain activity on price should be monitored. The short-term trend will depend on breaking through resistance levels and changes in market demand.
GateNews47m ago
Is Circle's stock price undervalued after a 22% plunge? Bitwise is optimistic about USDC, with a valuation potentially reaching $75 billion by 2030.
In March 2026, Circle's stock price experienced a significant pullback due to expectations surrounding the CLARITY Act, but Bitwise's Chief Investment Officer believes the market has misjudged. The core driving force behind stablecoins is payment efficiency. Bitwise predicts that by 2030, Circle's valuation could reach $75 billion. Despite increased short-term uncertainty, projects with strong compliance capabilities will benefit in the long run.
GateNews48m ago
Gold crashes 21%, hitting a 106-year record. After Bitcoin stays steady at $70,000, what is its future trend?
In March 2026, gold experienced its largest decline in nearly a century, dropping from $5,193 to $4,098, reflecting a reassessment of its safe-haven properties by investors. Meanwhile, Bitcoin performed relatively stably, becoming a new store of value for some investors. The correlation between gold and Bitcoin has fallen to -0.31, indicating diverging trends. Market opinions on gold's outlook are divided, and future movements will be influenced by geopolitical and monetary policy developments.
GateNews52m ago
