
SUI price has spent months moving quietly, then suddenly showed signs of life right where it mattered most. The latest daily chart shows price lifting from a familiar floor, the same area that has acted like a springboard several times before. That detail sits at the center of the current discussion and helps explain why attention is returning to Sui price after a long period of compression.
SUI has been trading inside a descending wedge pattern since late 2025, and that structure has shaped nearly every move since then. Lower highs continued to press price down, while the lower boundary of the wedge kept catching each drop. Each time SUI price touched that base, buyers stepped in and pushed it back toward the upper boundary.
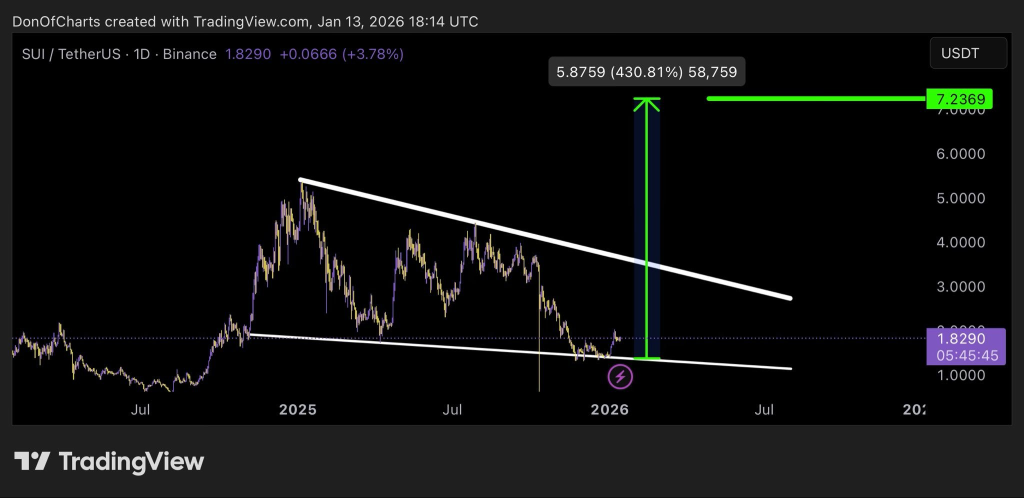
The attached chart highlights this clearly. Price slid down the wedge, tagged the lower trend line, then rebounded sharply. That move has happened more than once, which gives the pattern credibility. Current price action shows another bounce developing from that same zone, suggesting the structure remains active rather than broken.
Sui Insiders pointed to this behavior while noting that $1.60 remains the level holding the entire setup together. That level lines up closely with the wedge base shown on the chart and helps explain why price reactions there have been so consistent.
@SuiInsiders / X
SUI Price Pushes Toward The Upper Wedge Again
Momentum has shifted back upward following the latest bounce, and SUI price is now moving toward the top of the descending wedge once again. That area has acted as resistance in the past, often slowing price or sending it back down. The difference this time lies in how tightly price has been coiling.
The wedge has narrowed significantly, leaving less room for sideways movement. When patterns reach this stage, pressure tends to build. Sui Insiders described the structure as still bullish as long as the lower support holds, which aligns with the chart’s tightening range.
SUI price currently trades around $1.82, sitting above the base and below the descending resistance. That placement puts price right in the decision zone, where reactions tend to become more decisive rather than gradual.
SUI Price Targets Come Into View If Structure Resolves Higher
A clean move above the wedge would shift the short-term outlook. The chart projection highlights potential upside zones around $2.60, then $4.20, with $7.30 appearing as a longer extension if momentum continues. Those levels were shared by Sui Insiders and match historical reaction areas on the chart.
Here Are the Exact Reasons Why Ethereum, Bitcoin, and Crypto Prices Are Up_**
Price would still need to clear resistance step by step, yet the structure explains why these targets exist rather than appearing at random. Each level reflects previous market memory where SUI price paused or reversed before.
Shorter term price action remains tied to whether the wedge breaks or holds. SUI price staying above $1.60 keeps the pattern intact, while a sustained push through the upper trend line opens the door for a different phase altogether.
Disclaimer: The information on this page may come from third parties and does not represent the views or opinions of Gate. The content displayed on this page is for reference only and does not constitute any financial, investment, or legal advice. Gate does not guarantee the accuracy or completeness of the information and shall not be liable for any losses arising from the use of this information. Virtual asset investments carry high risks and are subject to significant price volatility. You may lose all of your invested principal. Please fully understand the relevant risks and make prudent decisions based on your own financial situation and risk tolerance. For details, please refer to
Disclaimer.
Related Articles
Gate Daily Report (April 24): US Treasury sanctions Cambodian crypto “pig butchering” scams; Tether mints an additional 1 billion USDT
Bitcoin (BTC) rebound momentum is weakening, with a temporary quote around $78,030 as of April 24. The U.S. Treasury Department’s Office of Foreign Assets Control (OFAC) sanctioned a Cambodian politician linked to a crypto “pig butchering” scam center. Tether issued another 1 billion USDT on the Ethereum network; over the past 5 days, it has issued a total of 3 billion USDT on the Ethereum network.
MarketWhisper1h ago
Trump ordered the sinking of ships in the Strait of Hormuz, and Bitcoin’s rebound momentum weakened to 78k
U.S. President Donald Trump posted on Truth Social on April 24, announcing that the ceasefire agreement between Israel and Lebanon will be extended by three weeks. On the same day, he also ordered the U.S. Navy to “sink any vessel currently laying mines in the Strait of Hormuz,” and instructed the military to carry out mine-clearing operations with “three times the force.” Brent crude spot prices have returned above $100, and Bitcoin is trading near $78,000 under pressure and consolidating.
MarketWhisper2h ago
Crypto Fear and Greed Index Drops to 39, Market in Panic State
Gate News message, April 24 — The Crypto Fear and Greed Index dropped to 39 today, down from 46 yesterday, according to data from Alternative.me. The index indicates the market remains in a panic state.
GateNews3h ago
U.S.-Iran talks hit a deadlock, oil prices rise, and Bitcoin holds steady at 78K
U.S.-Iran talks have again fallen into a stalemate, and geopolitical tensions have pushed up oil prices; Brent is over $105 and WTI is near $97. The U.S. says it will open fire if the Strait of Hormuz is hit by a “Bure” missile. Iran’s parliamentary speaker withdraws from the negotiating team, and the Islamic Revolutionary Guard Corps tightens its control, which has raised concerns from outside observers. Bitcoin is trading steadily and has stabilized above 78K; spot Bitcoin ETFs have recorded net inflows for six consecutive days, and spot Ethereum ETFs have recorded net inflows for nine consecutive days. The Fear & Greed Index has declined, but it still leans optimistic; financing rates have turned slightly negative, and leverage has not grown significantly.
ChainNewsAbmedia3h ago
Bloomberg Analyst Mike McGlone Flags $75,000 as Critical Bitcoin Level for 2026
Gate News message, April 23 — Bloomberg analyst Mike McGlone has released an assessment of Bitcoin's performance relative to traditional markets, highlighting $75,000 as a critical threshold for BTC in 2026.
According to McGlone's analysis, Bitcoin and the S&P 500 have shown similar performance
GateNews7h ago
Dogecoin Holds $0.1018 as Whales Accumulate $330M
Dogecoin continues to trade below the critical $0.1018 resistance level after multiple failed breakout attempts, with the asset trading at $0.09625 at the time of writing amid ongoing downtrend momentum and active selling pressure.
Resistance Limits Upside Momentum
The $0.1018 level has
CryptoFrontier7h ago