Trade
Trading Type
Spot
Trade crypto freely
Alpha
Points
Get promising tokens in streamlined on-chain trading
Pre-Market
Trade new tokens before they are officially listed
Margin
Magnify your profit with leverage
Convert & Block Trading
0 Fees
Trade any size with no fees and no slippage
Leveraged Tokens
Get exposure to leveraged positions simply
Futures
Futures
Hundreds of contracts settled in USDT or BTC
Options
HOT
Trade European-style vanilla options
Unified Account
Maximize your capital efficiency
Demo Trading
Futures Kickoff
Get prepared for your futures trading
Futures Events
Participate in events to win generous rewards
Demo Trading
Use virtual funds to experience risk-free trading
Earn
Launch
CandyDrop
Collect candies to earn airdrops
Launchpool
Quick staking, earn potential new tokens
HODLer Airdrop
Hold GT and get massive airdrops for free
Launchpad
Be early to the next big token project
Alpha Points
NEW
Trade on-chain assets and enjoy airdrop rewards!
Futures Points
NEW
Earn futures points and claim airdrop rewards
Investment
Simple Earn
Earn interests with idle tokens
Auto-Invest
Auto-invest on a regular basis
Dual Investment
Buy low and sell high to take profits from price fluctuations
Soft Staking
Earn rewards with flexible staking
Crypto Loan
0 Fees
Pledge one crypto to borrow another
Lending Center
One-stop lending hub
VIP Wealth Hub
Customized wealth management empowers your assets growth
Private Wealth Management
Customized asset management to grow your digital assets
Quant Fund
Top asset management team helps you profit without hassle
Staking
Stake cryptos to earn in PoS products
BTC Staking
HOT
Stake BTC and earn 10% APR
GUSD Minting
Use USDT/USDC to mint GUSD for treasury-level yields
More
大牛加密论
No content yet
大牛加密论
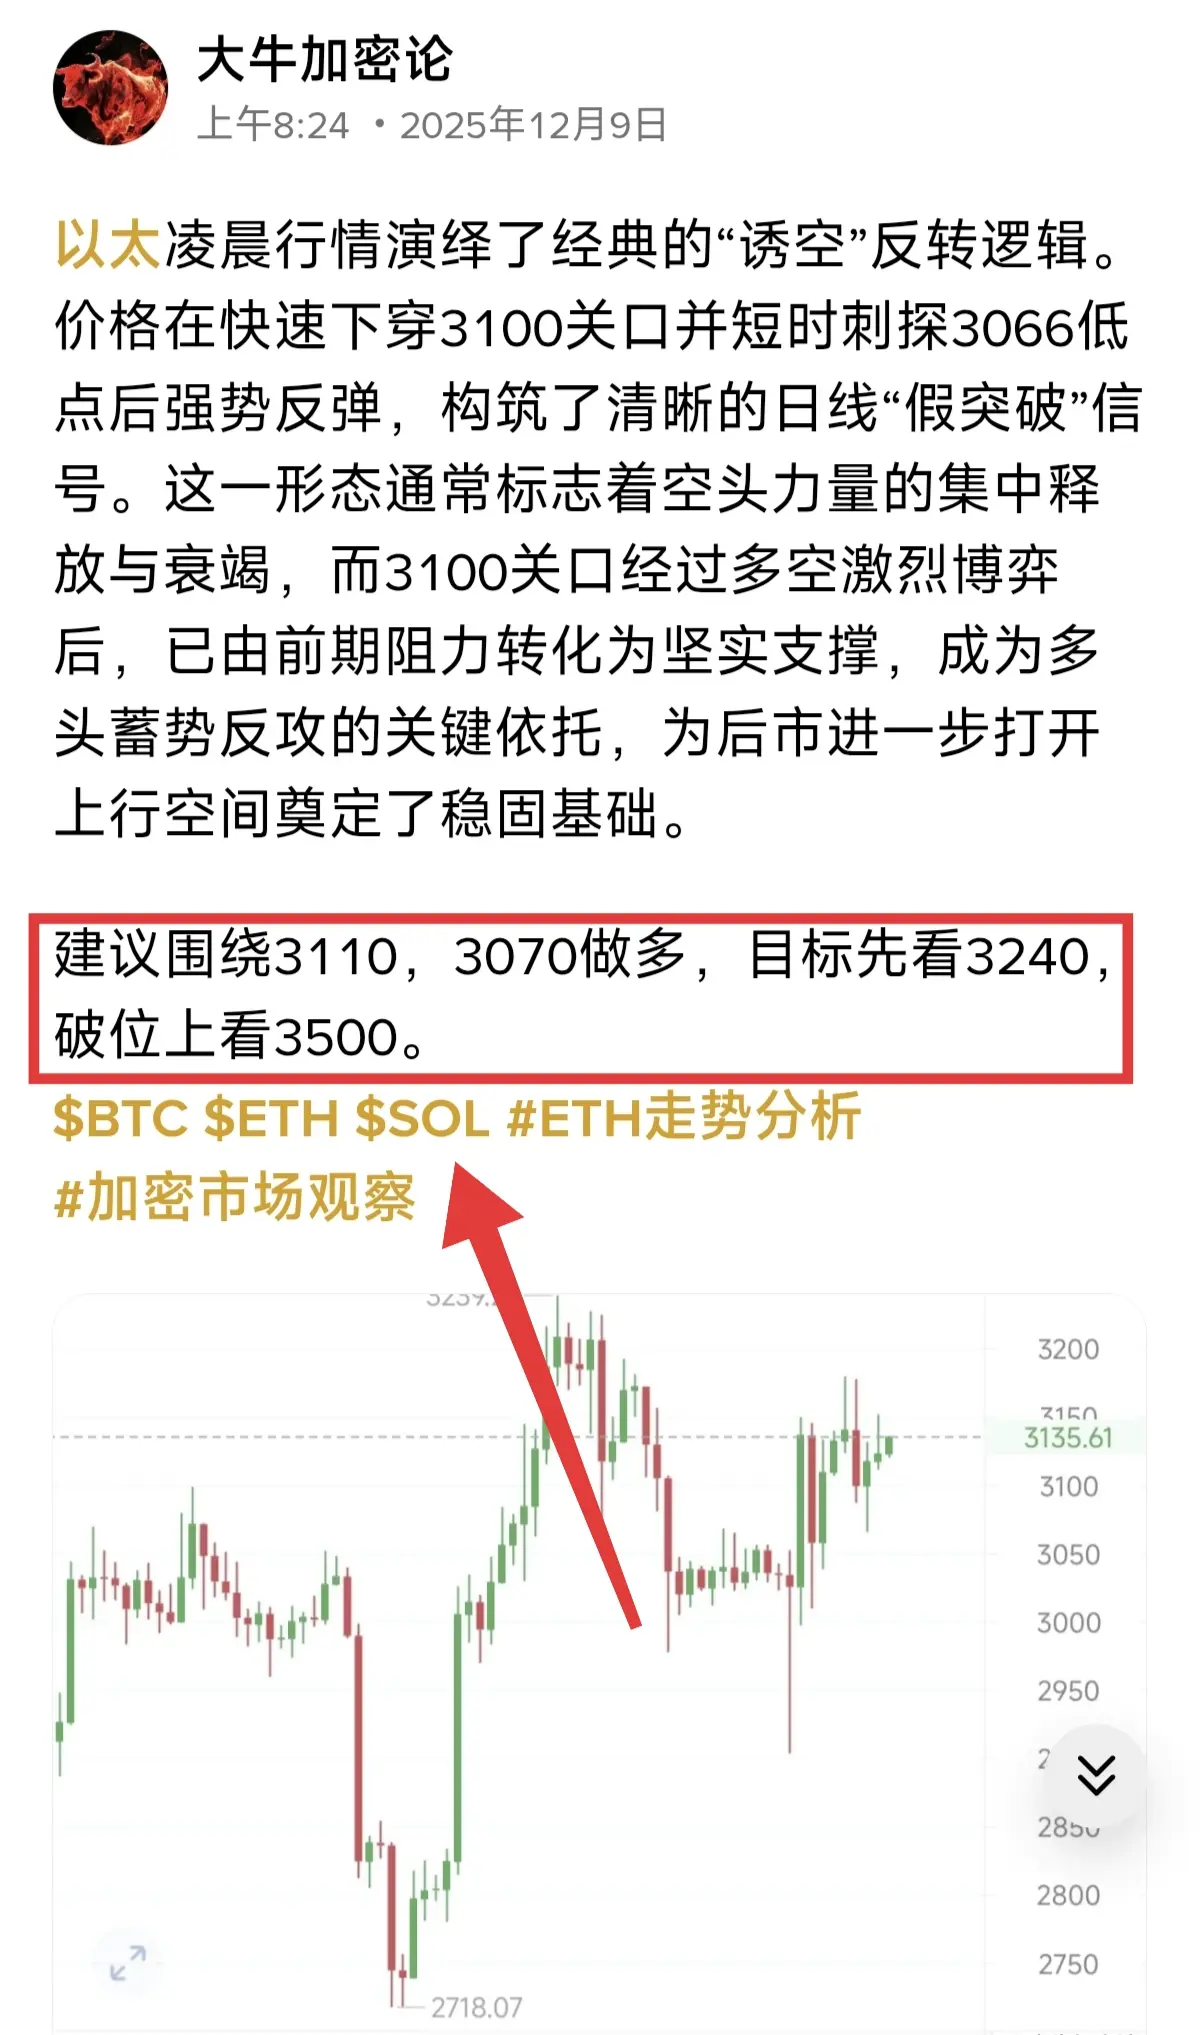
Ethereum's four-hour timeframe has strongly broken below the lower Bollinger Band, with the channel opening up and continuing to expand, significantly strengthening the bearish signal. The daily chart remains in a clear downtrend channel, with weak rebound momentum and no effective reversal. There are no clear signs of a bottoming out in the market yet.
It is recommended to short around 3020 and 2980, with the initial target at 2880, and if broken, further down to 2700.
$BTC $ETH #加密市场反弹
View OriginalIt is recommended to short around 3020 and 2980, with the initial target at 2880, and if broken, further down to 2700.
$BTC $ETH #加密市场反弹
- Reward
- like
- Comment
- Repost
- Share
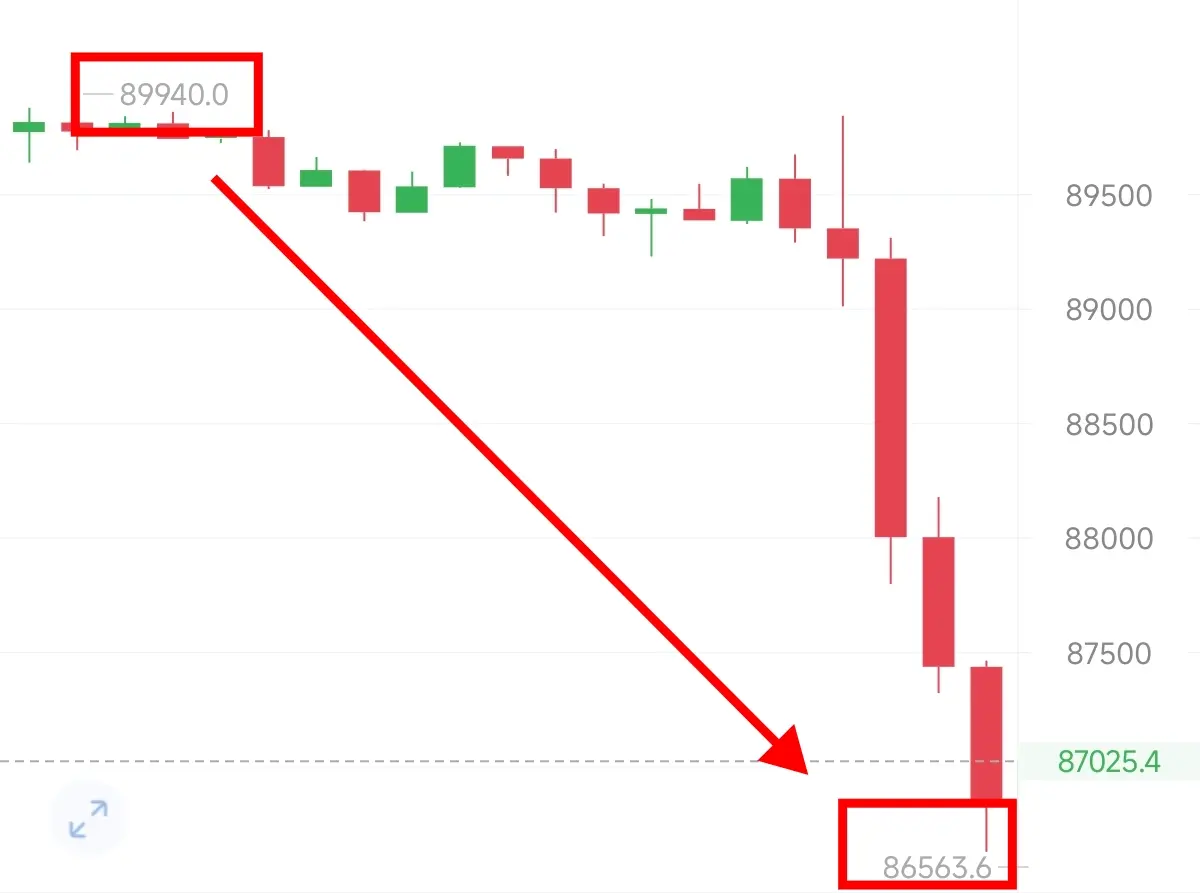
Bullish momentum is weakening, and the bears have already taken the dominant position.
Yesterday, Bitcoin remained flat within a narrow range, then experienced a cliff-like drop at around 89,800. After reaching a low near 85,000, it weakly rebounded. The overall decline was nearly 4,800 points. Currently, the price hovers around 86,400, oscillating and recovering. Friends who followed the strategy of shorting yesterday have perfectly captured this downward move, once again achieving precise gains!
From a technical perspective, on the 4-hour chart, the price has broken below the lower Bollinger
View OriginalYesterday, Bitcoin remained flat within a narrow range, then experienced a cliff-like drop at around 89,800. After reaching a low near 85,000, it weakly rebounded. The overall decline was nearly 4,800 points. Currently, the price hovers around 86,400, oscillating and recovering. Friends who followed the strategy of shorting yesterday have perfectly captured this downward move, once again achieving precise gains!
From a technical perspective, on the 4-hour chart, the price has broken below the lower Bollinger
- Reward
- like
- Comment
- Repost
- Share
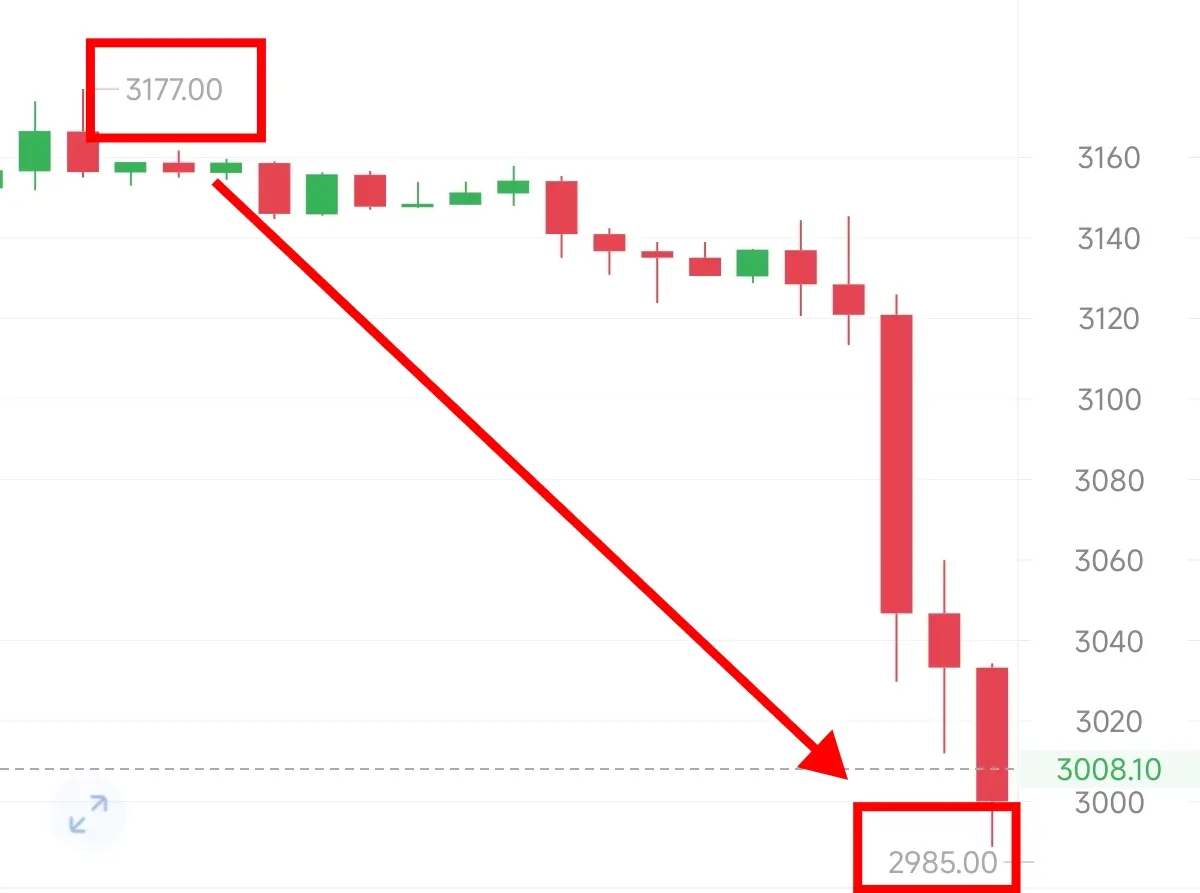
Ethereum: We precisely positioned a short around 3160 in the morning. The first target was 3020, which was broken directly, reaching a low of 2985, nearly 200 points of space.
3000 has been broken; even if there's a rebound, it only gives us an opportunity to short. Rebound and short, brothers.
$BTC $ETH #加密市场反弹
View Original3000 has been broken; even if there's a rebound, it only gives us an opportunity to short. Rebound and short, brothers.
$BTC $ETH #加密市场反弹
- Reward
- 1
- 2
- Repost
- Share
Brother :
:
3020 several times, last night it broke through the support.View More
It's hard to say it's going with the trend, after all, I am bullish on the big bull, and the market rises; I am bearish today, and the market falls. Bitcoin has moved out of a nearly 3500-point range. Maybe this is the strength of the big bull. Everyone is just jumping on the bandwagon, right?
$BTC #加密市场反弹 $ETH
View Original$BTC #加密市场反弹 $ETH
- Reward
- like
- Comment
- Repost
- Share
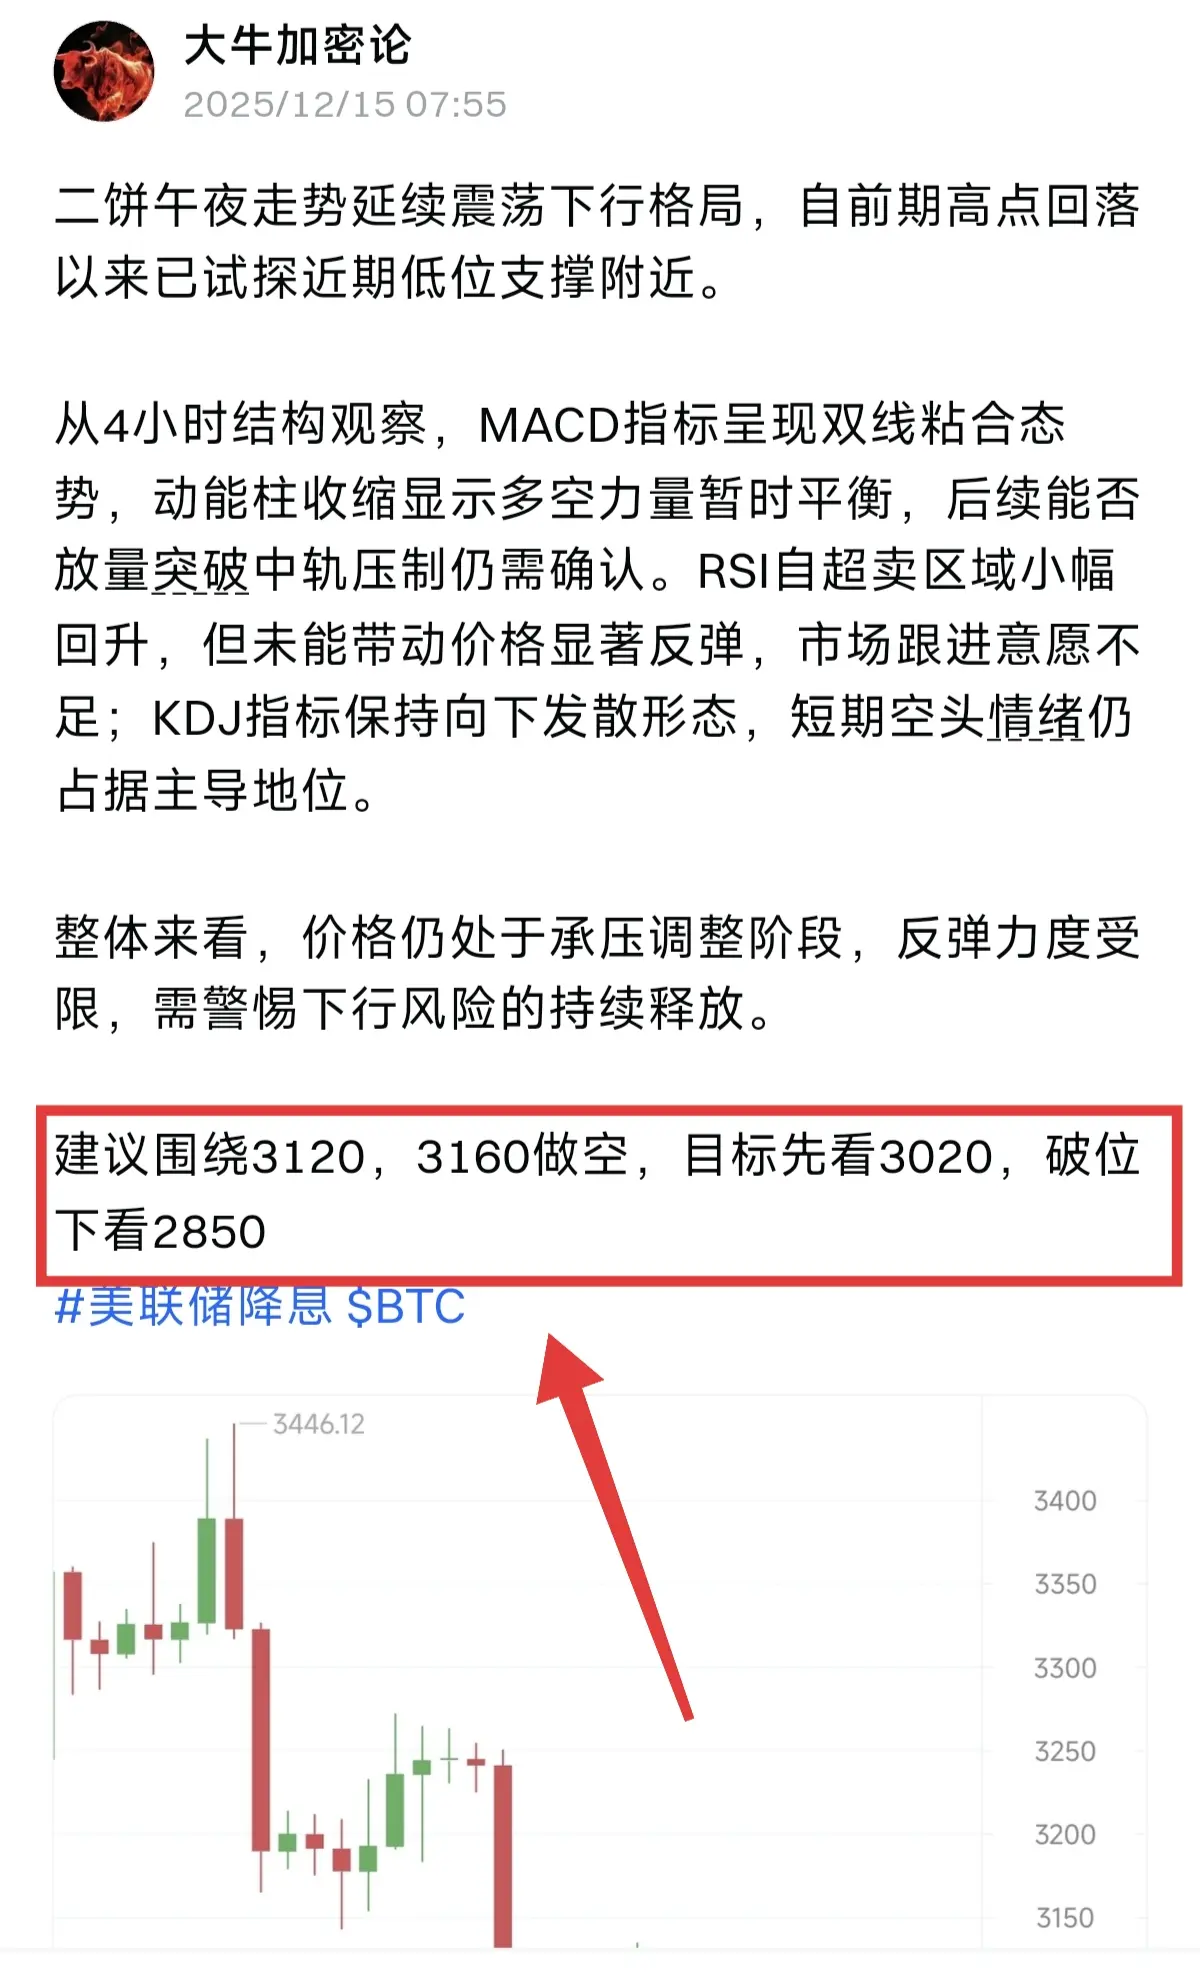
The second Bitcoin's midnight trend continues to oscillate downward, having tested recent lows since retreating from the previous high.
From a 4-hour structure perspective, the MACD indicator shows a dual-line convergence, with shrinking momentum bars indicating a temporary balance between bulls and bears. Whether it can break through the middle band with increased volume remains to be confirmed. The RSI has slightly rebounded from the oversold area but has not triggered a significant price rebound, indicating insufficient market follow-through; the KDJ indicator remains in a downward divergen
From a 4-hour structure perspective, the MACD indicator shows a dual-line convergence, with shrinking momentum bars indicating a temporary balance between bulls and bears. Whether it can break through the middle band with increased volume remains to be confirmed. The RSI has slightly rebounded from the oversold area but has not triggered a significant price rebound, indicating insufficient market follow-through; the KDJ indicator remains in a downward divergen
BTC-2.41%
- Reward
- like
- Comment
- Repost
- Share
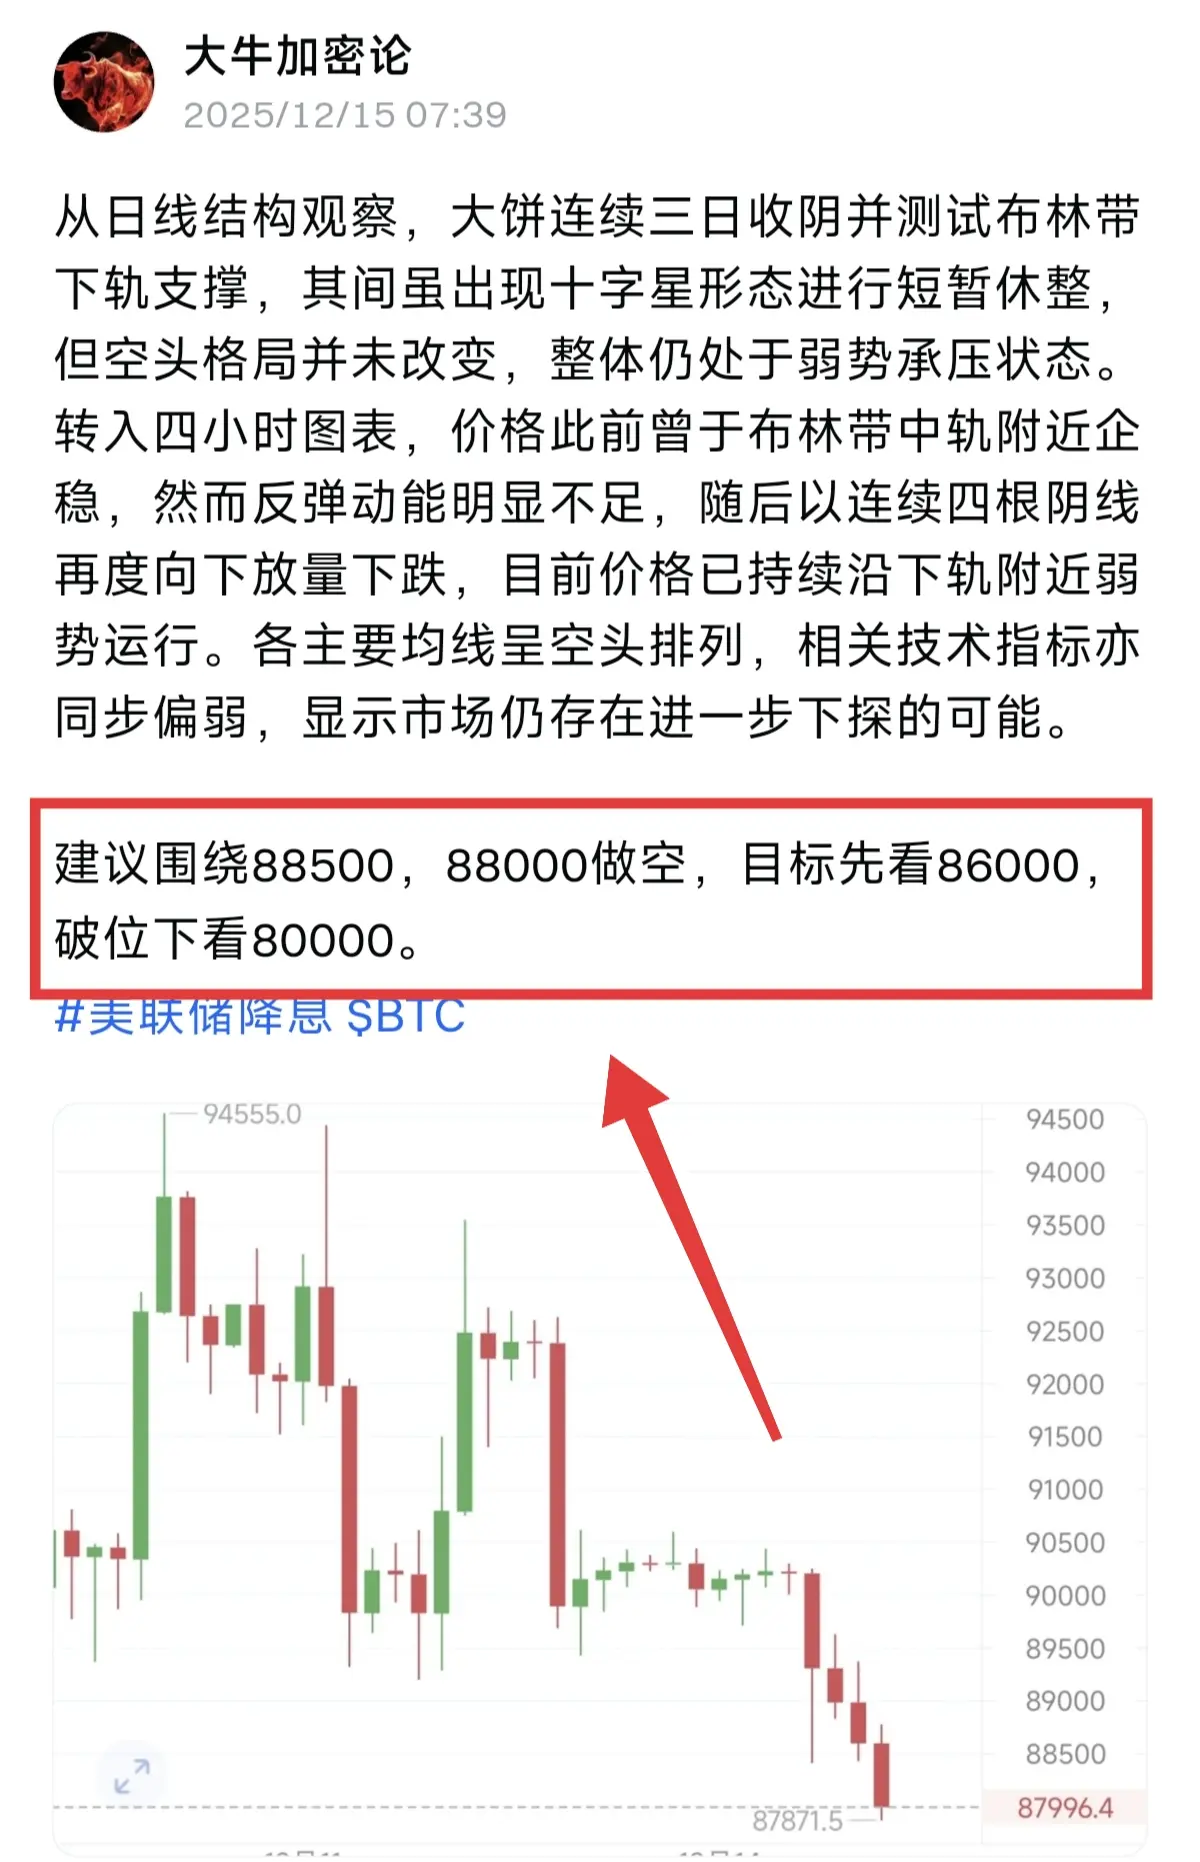
From the daily chart perspective, Bitcoin has closed in the red for three consecutive days and tested the lower Bollinger Band support. Although a doji pattern appeared for a brief correction, the bearish trend has not changed, and the overall remains in a weakly pressured state. Moving to the four-hour chart, the price previously stabilized near the middle Bollinger Band, but the rebound momentum was notably insufficient. It then declined with four consecutive bearish candles, continuing to fall with increased volume. Currently, the price is persistently trading weakly near the lower band. Ma
BTC-2.41%
- Reward
- like
- Comment
- Repost
- Share
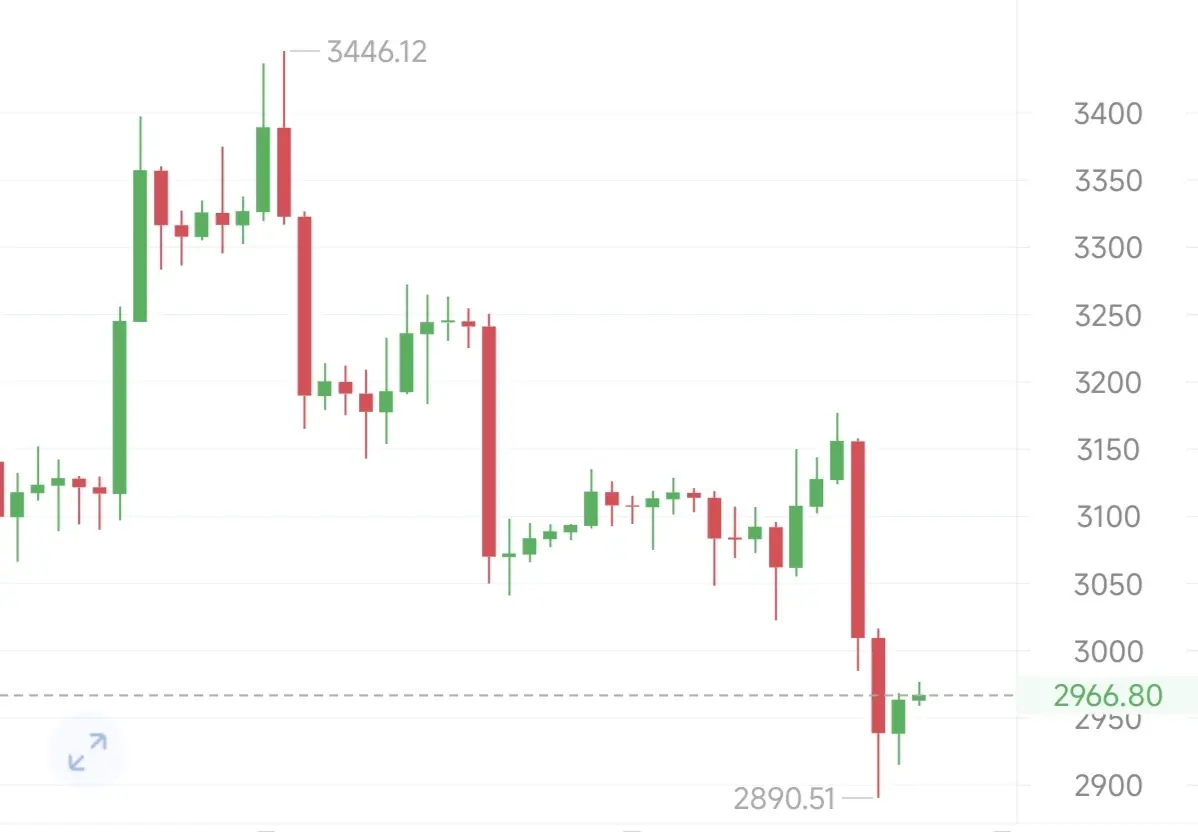
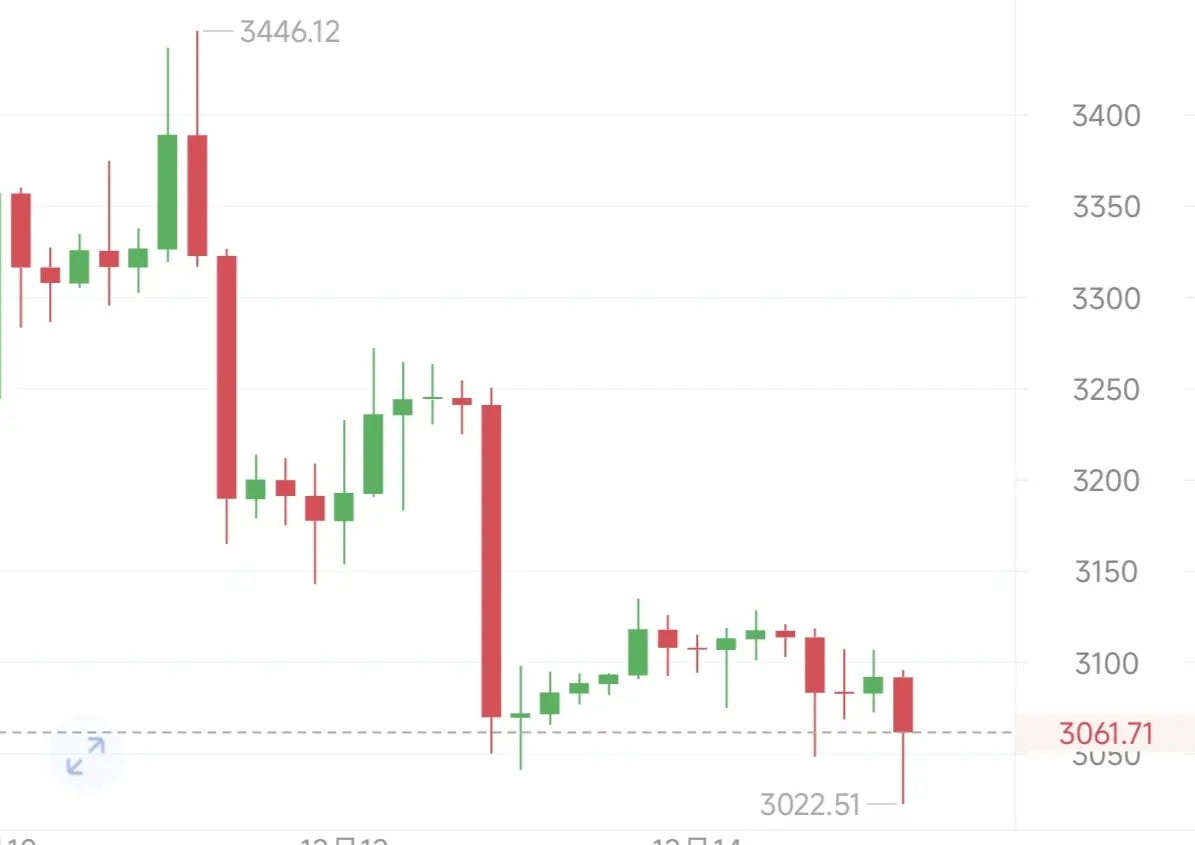
Ethereum Weekly Review: Long-term Investment Opportunities Emerging, How to Capture Gains in a Bearish Trend?
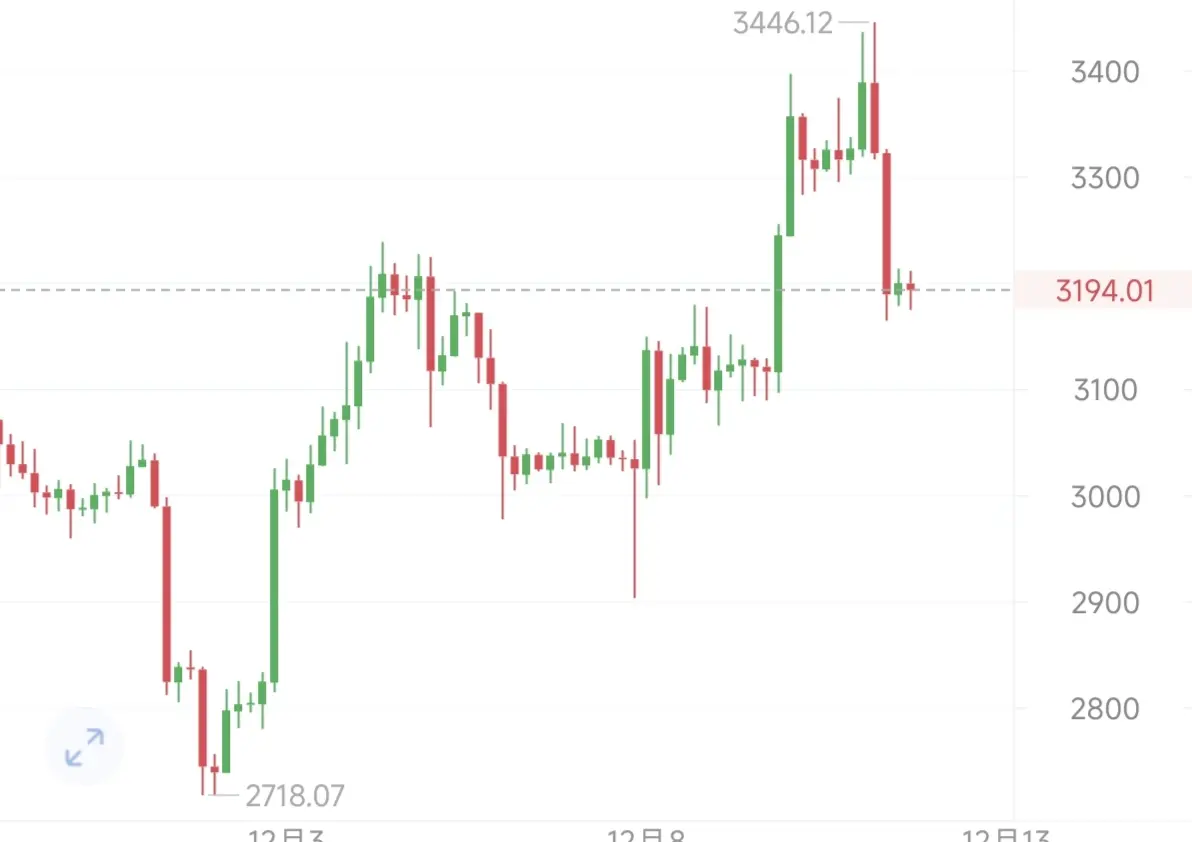
This week, Ethereum reached a high of around 3450, then continued to decline to around 3040. Currently, the price is fluctuating around 3100, with rebound strength clearly limited, and the overall trend is weak.
From a weekly perspective, Ethereum is operating near the middle-lower band of the Bollinger Bands, the MACD indicator is below the zero line and continues to expand, indicating a clear bearish trend. Even if there is a rebound, it is mostly a technical correction, which can be
View OriginalThis week, Ethereum reached a high of around 3450, then continued to decline to around 3040. Currently, the price is fluctuating around 3100, with rebound strength clearly limited, and the overall trend is weak.
From a weekly perspective, Ethereum is operating near the middle-lower band of the Bollinger Bands, the MACD indicator is below the zero line and continues to expand, indicating a clear bearish trend. Even if there is a rebound, it is mostly a technical correction, which can be
- Reward
- like
- Comment
- Repost
- Share
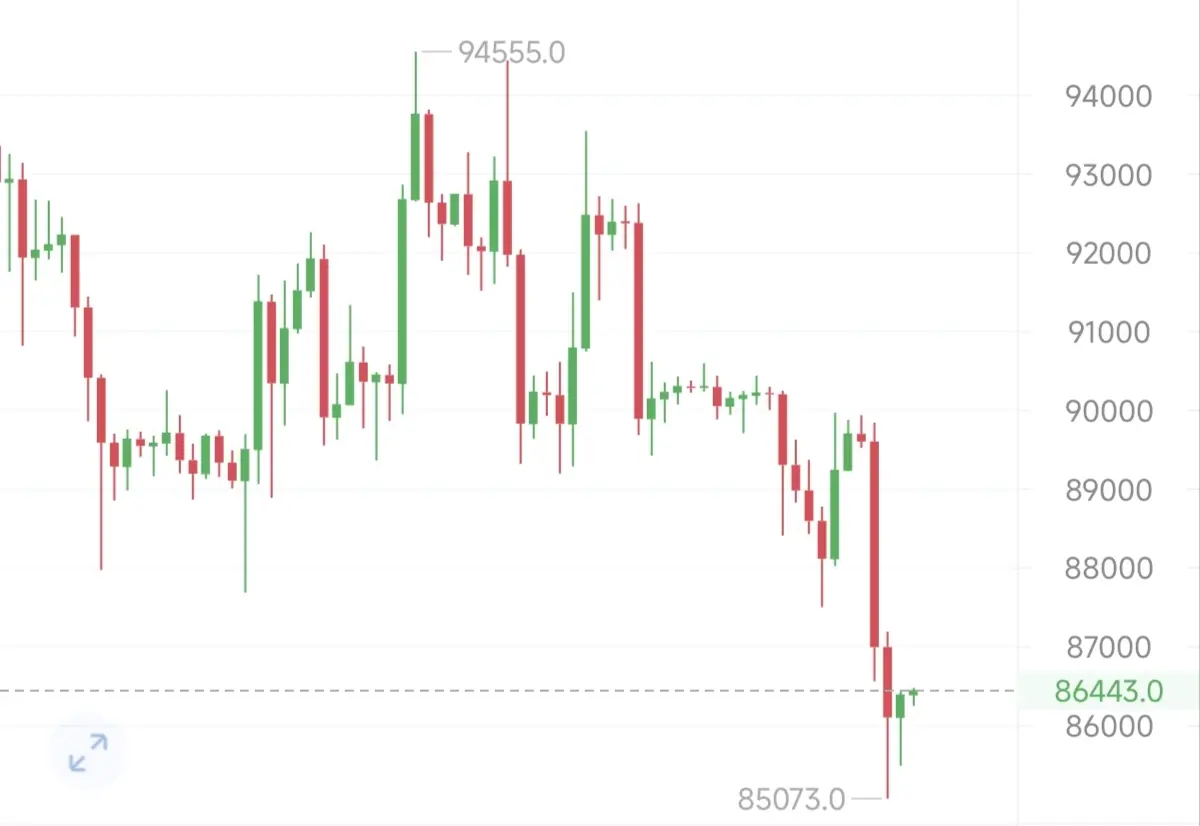
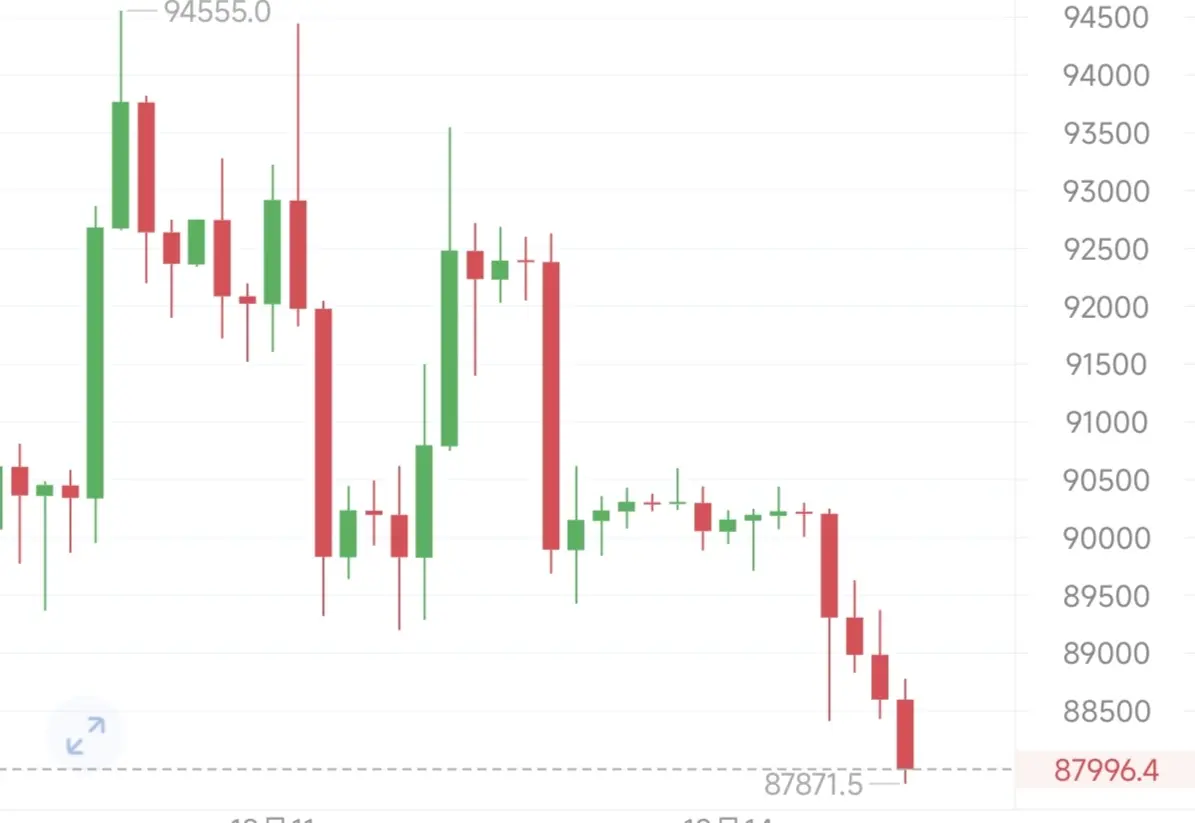
Bitcoin Weekly Review: Long-term Positioning Incoming, Are You Ready to Jump On?
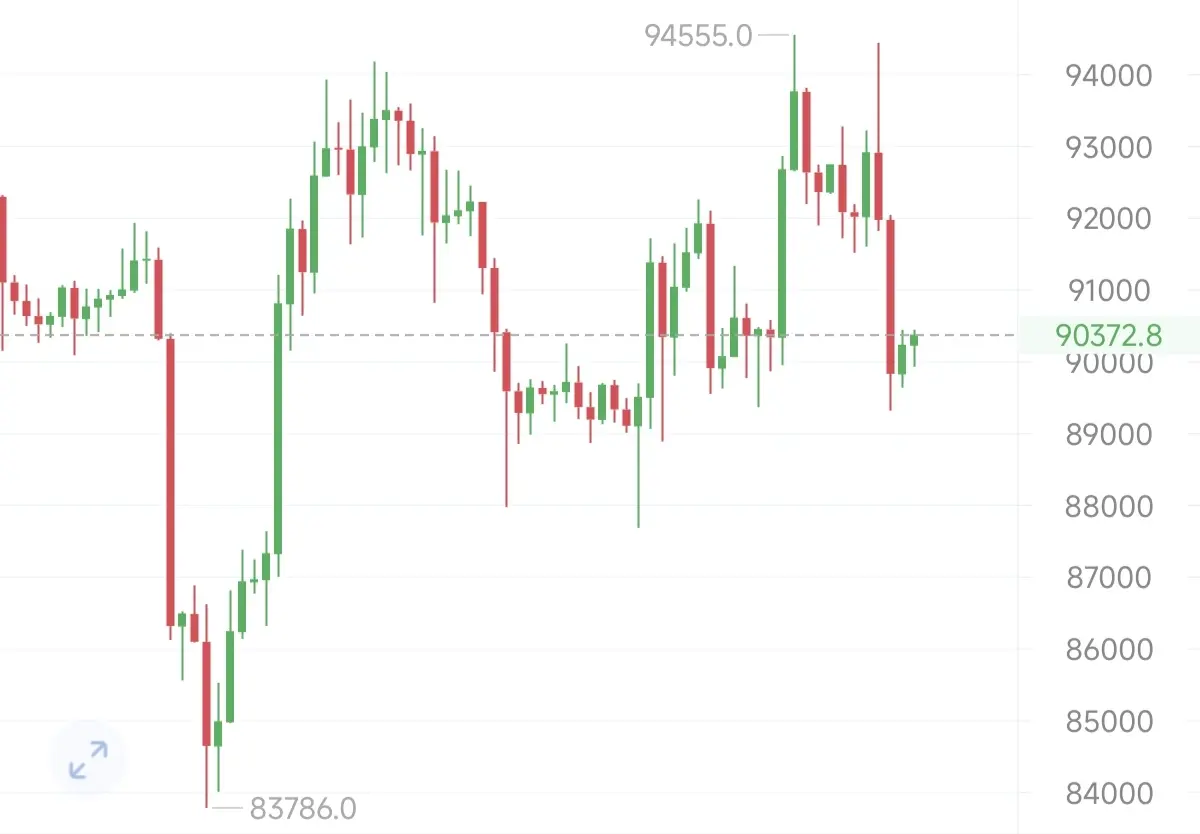
This week, it reached a high of around 94,800, then retraced to around 89,000. Currently, it is operating near 90,000, indicating limited rebound strength.
On the weekly chart, it is in the lower band of the Bollinger Bands, with volume continuing below the zero line. The lows are gradually decreasing, showing a bearish trend. Although there is a rebound, it only offers us an opportunity to enter short positions.
You can short around 90,800, add to your position at 91,800, with a stop-loss set at 92,500. The initi
BTC-2.41%
- Reward
- like
- Comment
- Repost
- Share
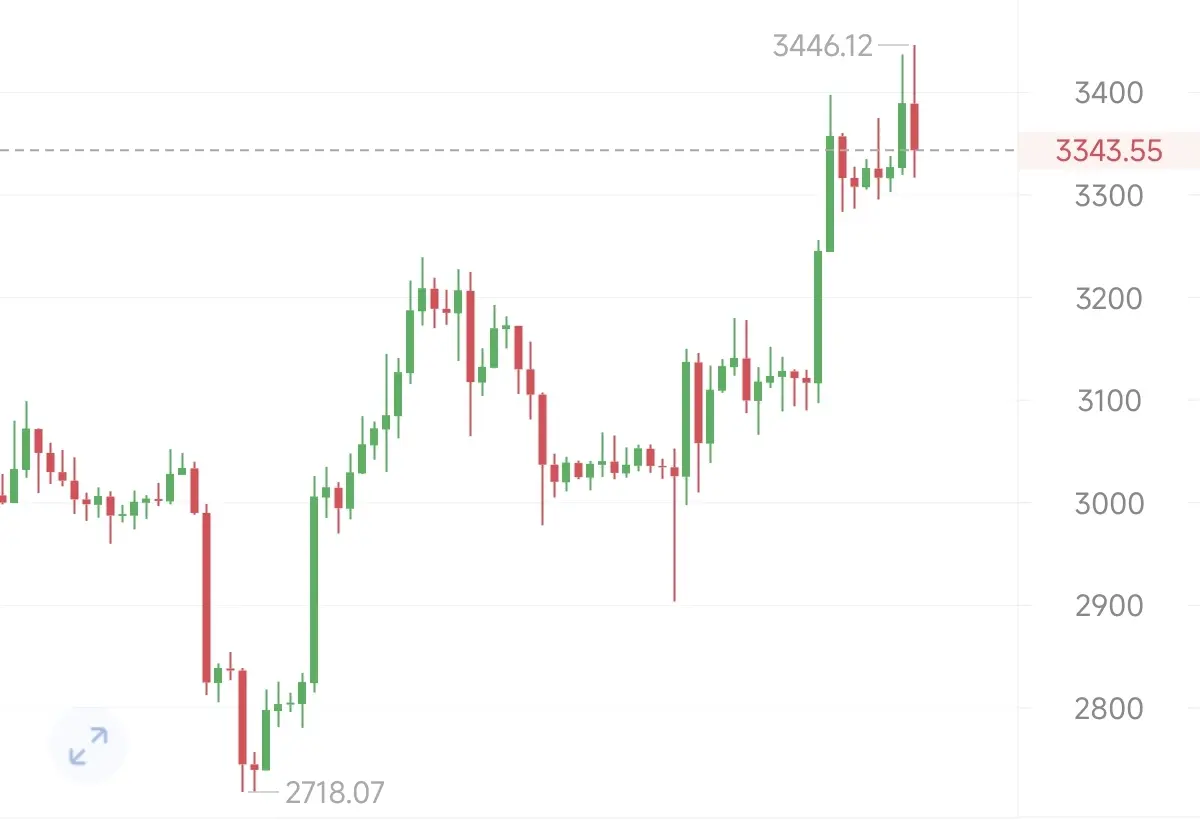
Ethereum's current correction has basically completed, and the price quickly rebounded after testing the mid-line support. The K-line closed with a clear long lower shadow at the low position, indicating that the buying strength below is solid, laying the foundation for the subsequent upward breakthrough. From the hourly chart, the three bands of the Bollinger Bands are generally extending upward, and the price is showing a oscillating upward trend while continuing to rise, with a clear overall bullish pattern and steady upward momentum.
It is recommended to go long around 3140 and 3170, with
It is recommended to go long around 3140 and 3170, with
ETH-6.08%

- Reward
- like
- Comment
- Repost
- Share
Bitcoin's Bollinger Bands are currently tightening overall, with strong support at the lower band. If it can hold above the middle band, the upward space will open directly.
On the moving averages, MA7 has already formed a golden cross with MA30, indicating a clear short-term trend reversal. The price has successfully stabilized above both MA30 and EMA30, while EMA7 is closely hugging the price to form dynamic support. The overall moving average arrangement is gradually shifting from a bearish to a bullish pattern.
Although the MACD indicator is still below the zero line, the downward momentum
View OriginalOn the moving averages, MA7 has already formed a golden cross with MA30, indicating a clear short-term trend reversal. The price has successfully stabilized above both MA30 and EMA30, while EMA7 is closely hugging the price to form dynamic support. The overall moving average arrangement is gradually shifting from a bearish to a bullish pattern.
Although the MACD indicator is still below the zero line, the downward momentum
- Reward
- like
- Comment
- Repost
- Share
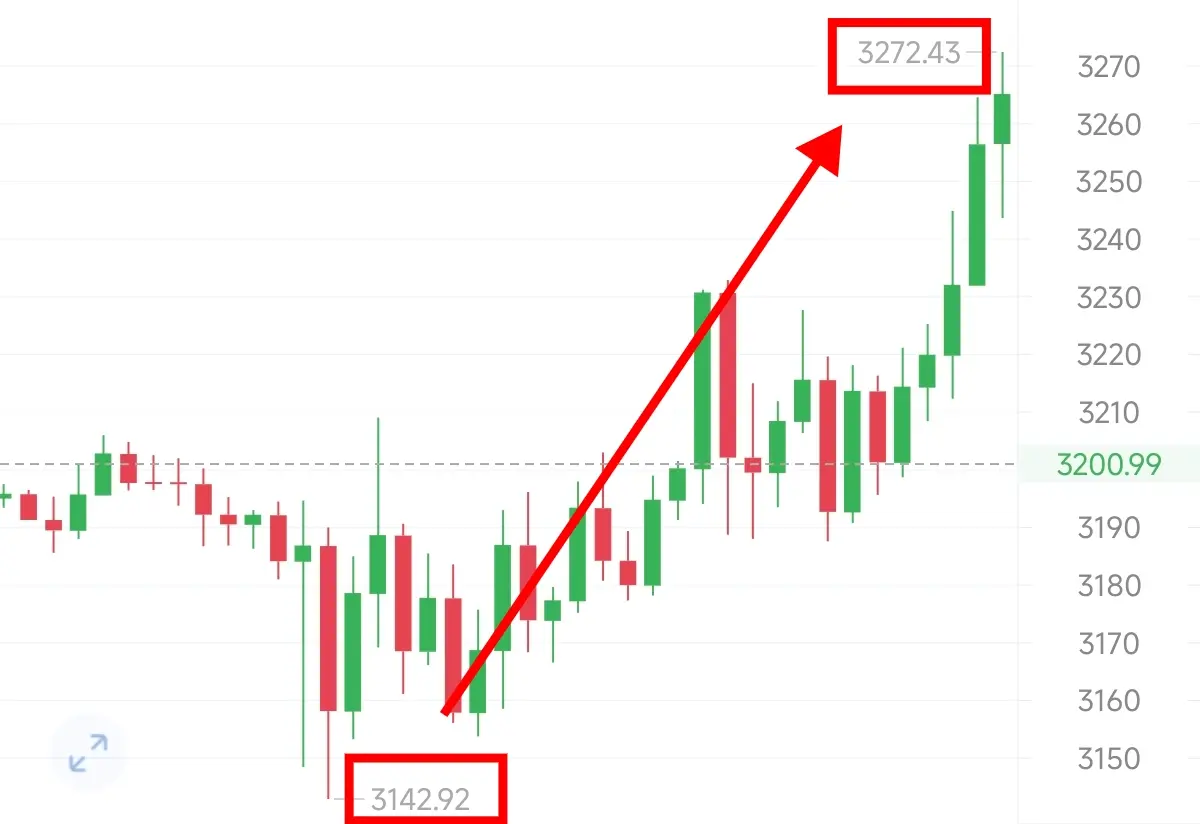
Our Duo Army ate meat again. We gave a buy around 3165 yesterday evening, and the market reached a high of 3272. The over 100-point space is already in place.
But in trading, we must be decisive, stick to the right direction, and when the direction is wrong, adjusting the strategy is progress, and turning around leads to substantial results.
$BTC $ETH #加密市场反弹
View OriginalBut in trading, we must be decisive, stick to the right direction, and when the direction is wrong, adjusting the strategy is progress, and turning around leads to substantial results.
$BTC $ETH #加密市场反弹
- Reward
- like
- Comment
- Repost
- Share

- Reward
- like
- Comment
- Repost
- Share
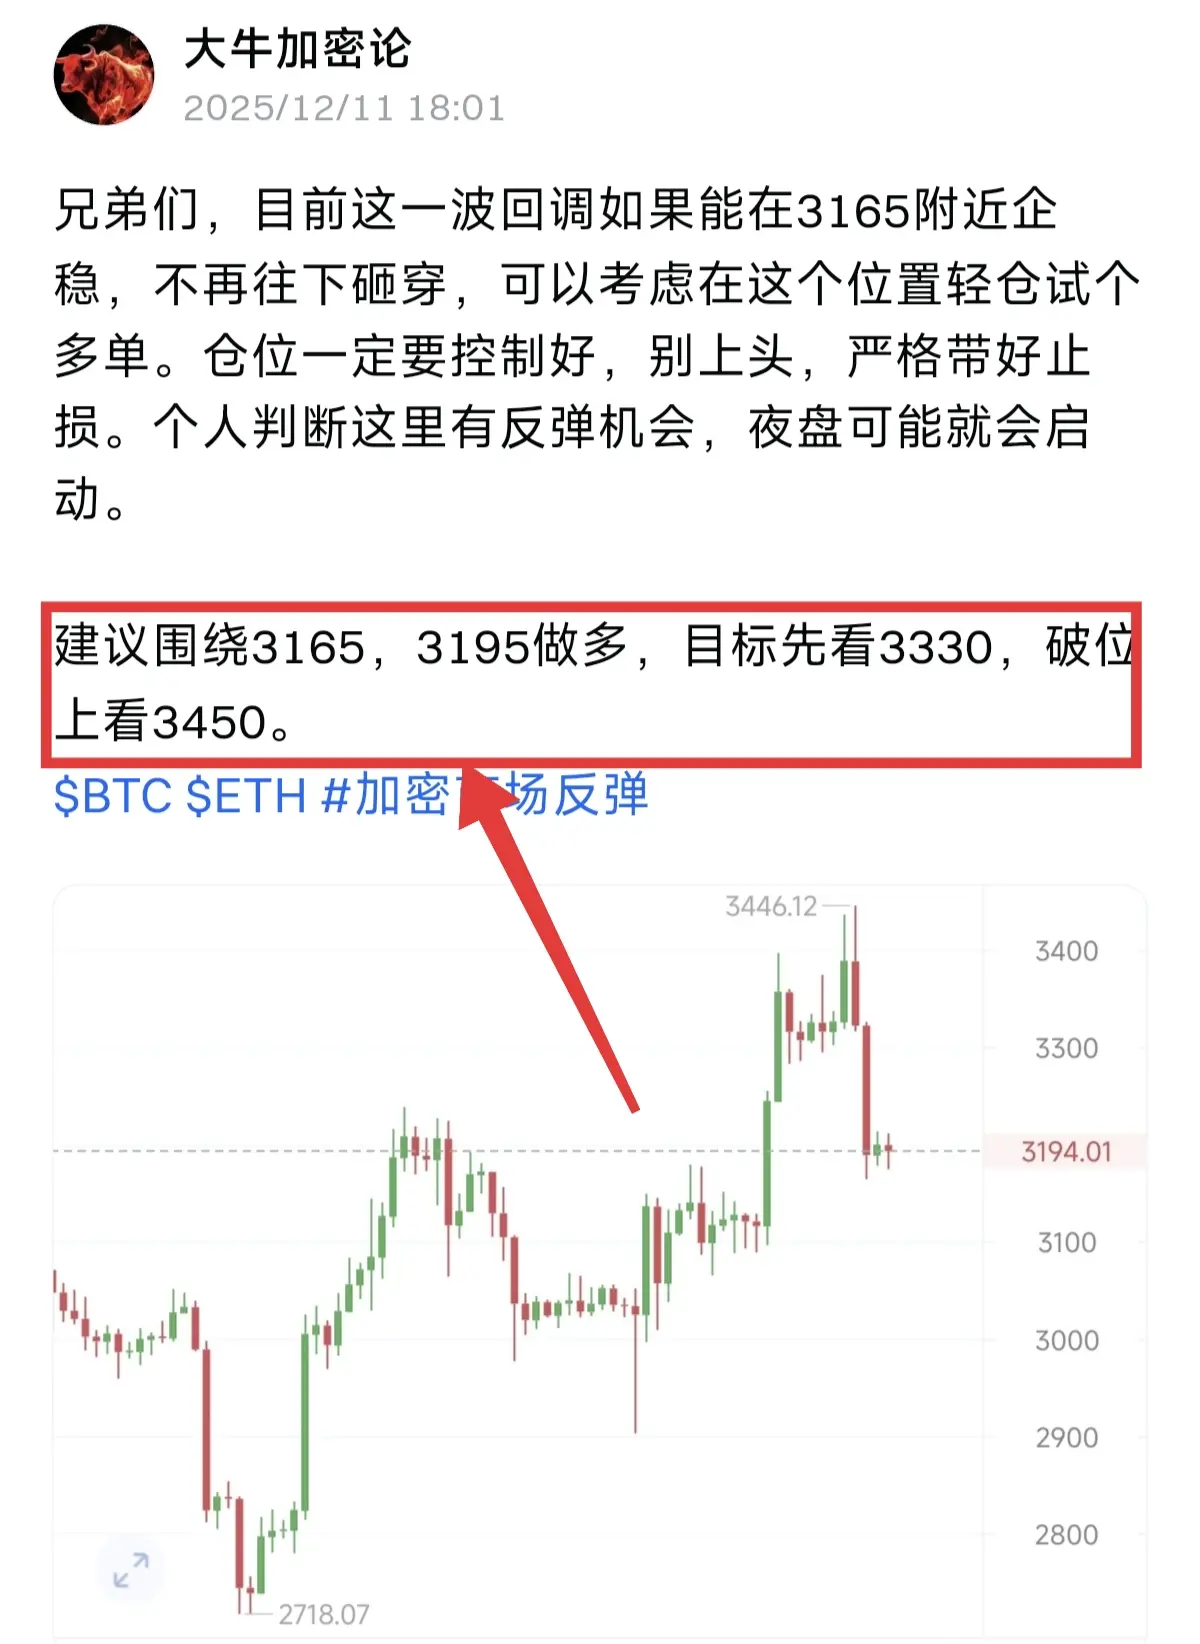
Brothers, if this wave of pullback can stabilize around 3165 and no longer break downward, you can consider opening a small long position at this level. Make sure to control your position size, avoid getting greedy, and strictly set stop-losses. I personally judge that there is a rebound opportunity here, and the night session may initiate a rally.
Suggested to go long around 3165 and 3195, with the first target at 3330, and if broken, then look towards 3450.
$BTC $ETH #加密市场反弹
View OriginalSuggested to go long around 3165 and 3195, with the first target at 3330, and if broken, then look towards 3450.
$BTC $ETH #加密市场反弹
- Reward
- like
- 1
- Repost
- Share
2Cakes :
:
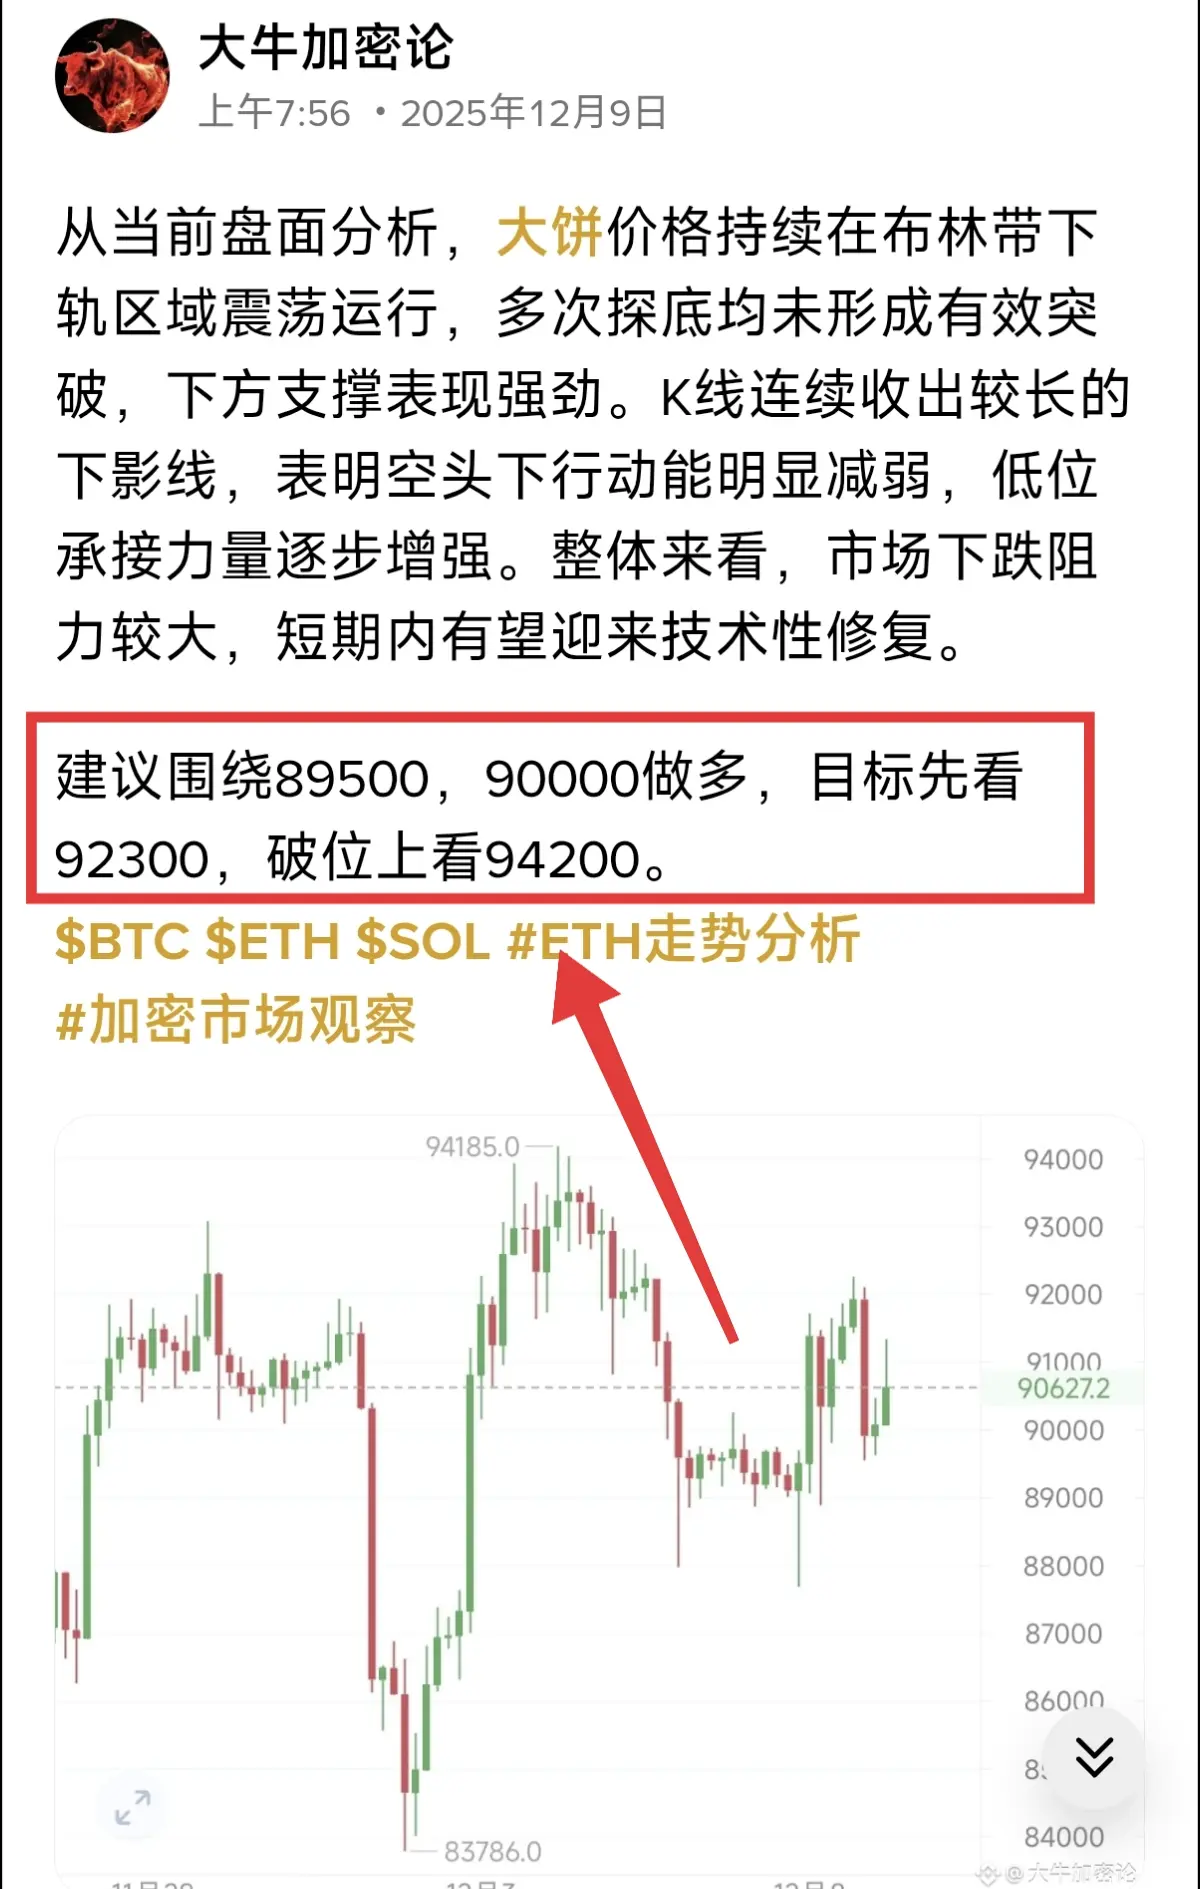
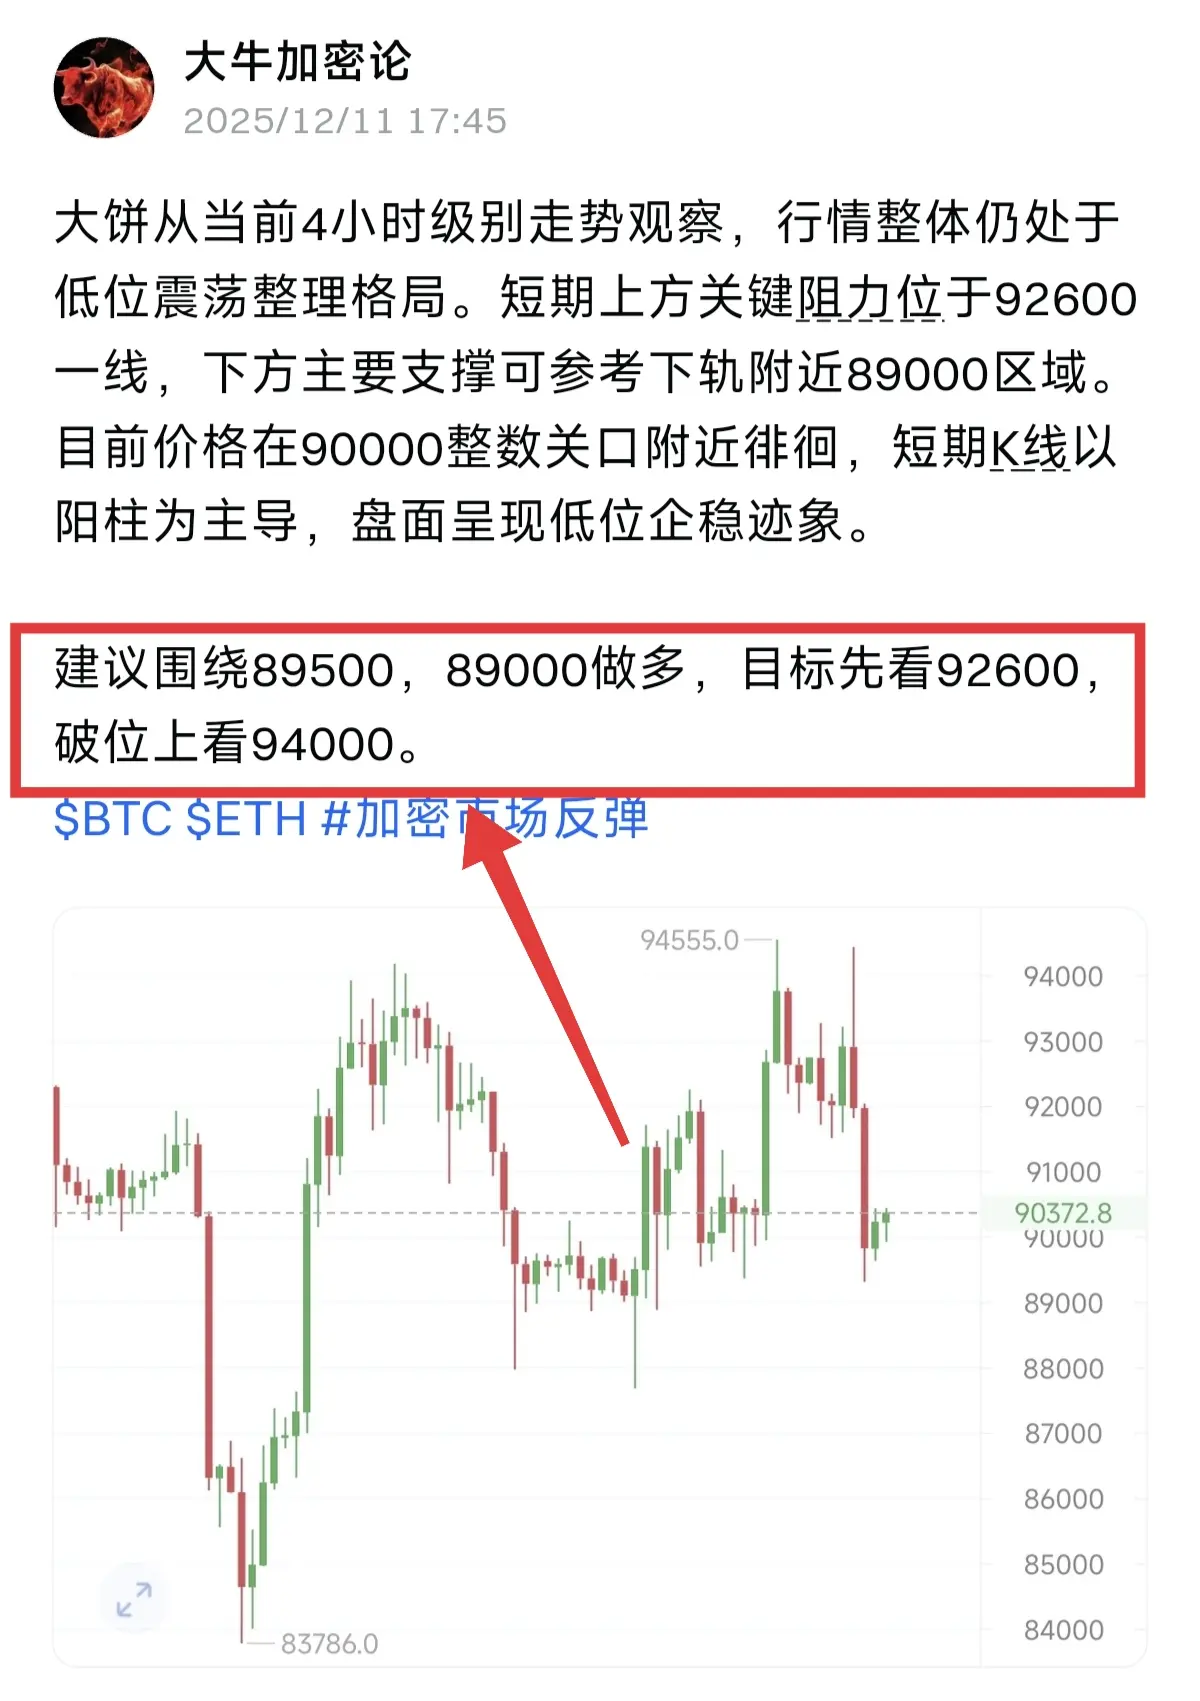
Can it really go this high? Pulling back directly to 3300 might be a bit challenging.From the current 4-hour trend analysis, the market overall remains in a low-range consolidation pattern. In the short term, the key resistance level is around 92600, while the main support can be referenced near the lower band around 89000. Currently, the price is hovering near the 90000 integer level, with short-term candlesticks mainly bullish, showing signs of stabilization at low levels.
It is recommended to go long around 89500 and 89000, with the first target at 92600 and a breakout to 94000.
View OriginalIt is recommended to go long around 89500 and 89000, with the first target at 92600 and a breakout to 94000.
- Reward
- like
- Comment
- Repost
- Share
The four-hour chart of Auntie Ta's trend is clear, consistently holding the key support at 3300 with strong performance.
Overall, the market correction is limited and has not disrupted the upward momentum; instead, it shows a strong pattern of hitting new highs daily. There is almost no obvious resistance during the rebound above, while during downward corrections, buy orders are frequently absorbed. The short-term pullback caused by news fluctuations is mostly a technical market correction and does not alter the overall sideways upward trend structure.
It is recommended to focus around 3300 a
View OriginalOverall, the market correction is limited and has not disrupted the upward momentum; instead, it shows a strong pattern of hitting new highs daily. There is almost no obvious resistance during the rebound above, while during downward corrections, buy orders are frequently absorbed. The short-term pullback caused by news fluctuations is mostly a technical market correction and does not alter the overall sideways upward trend structure.
It is recommended to focus around 3300 a
- Reward
- 1
- 1
- Repost
- Share
Long-shortEquityStrategyMaster:
Empty Ether sends Ether to the West,冲冲冲冲冲冲冲冲冲冲冲冲冲冲冲冲冲冲冲From a technical structure perspective, the hourly MACD shows that the bullish and bearish momentum are continuously entangled around the zero line, indicating that the short-term direction remains unclear; however, the RSI value has gradually rebounded from the lows, suggesting a recovery in market sentiment. The four-hour MACD still maintains a golden cross, although there are signs of a short-term pullback, the overall upward foundation has not been broken, and the medium-term trend structure still leans towards accumulation and consolidation.
It is recommended to go long around 91,500 and
View OriginalIt is recommended to go long around 91,500 and
- Reward
- like
- Comment
- Repost
- Share
From the 4-hour perspective, Ethereum's price has found effective support after retracing to the MA30 moving average. The moving average system is in a bullish alignment, indicating the medium-term trend remains strong. The Bollinger Bands are expanding upward in unison, with the bands widening, suggesting that upward momentum is continuing. The MACD indicator is above the zero axis, with both lines showing signs of turning upward again, and the green histogram bars are increasing, indicating the overall bullish pattern remains unchanged.
It is recommended to go long around 3280 and 3250, with
View OriginalIt is recommended to go long around 3280 and 3250, with

- Reward
- like
- Comment
- Repost
- Share
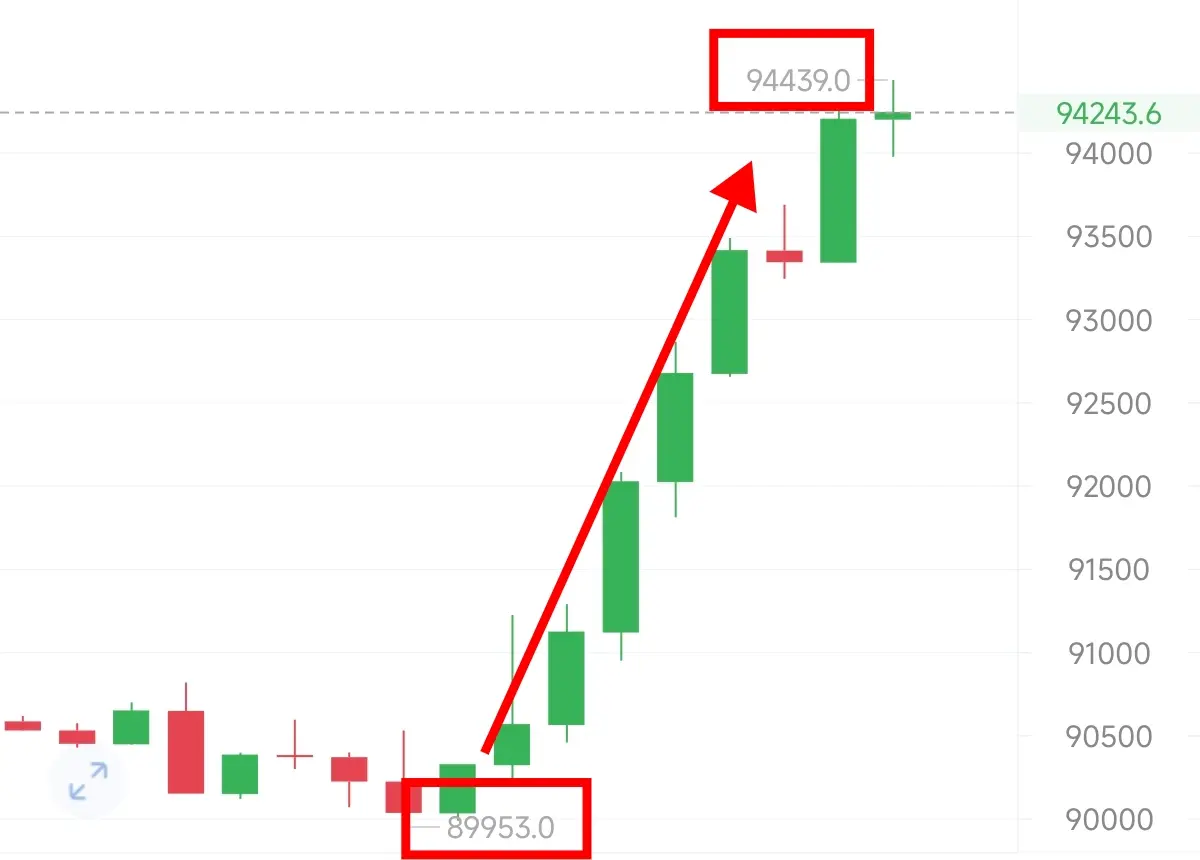
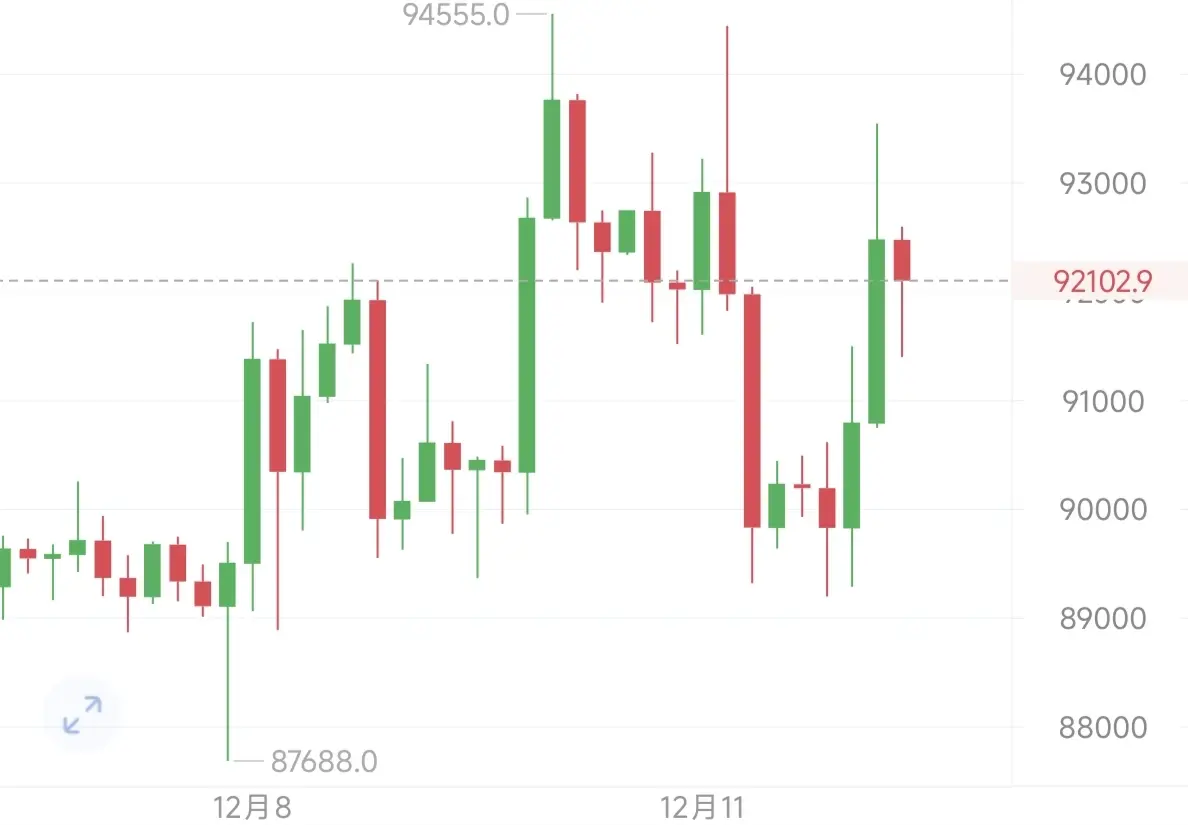
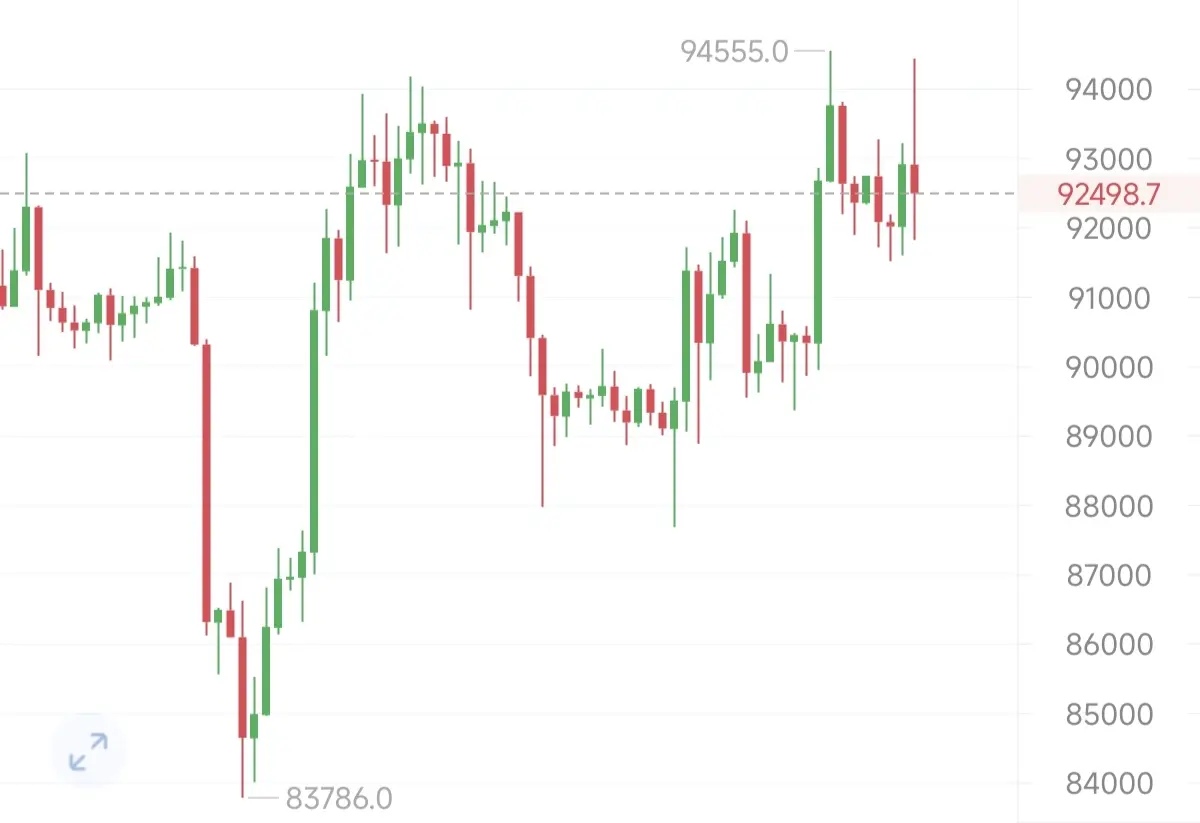
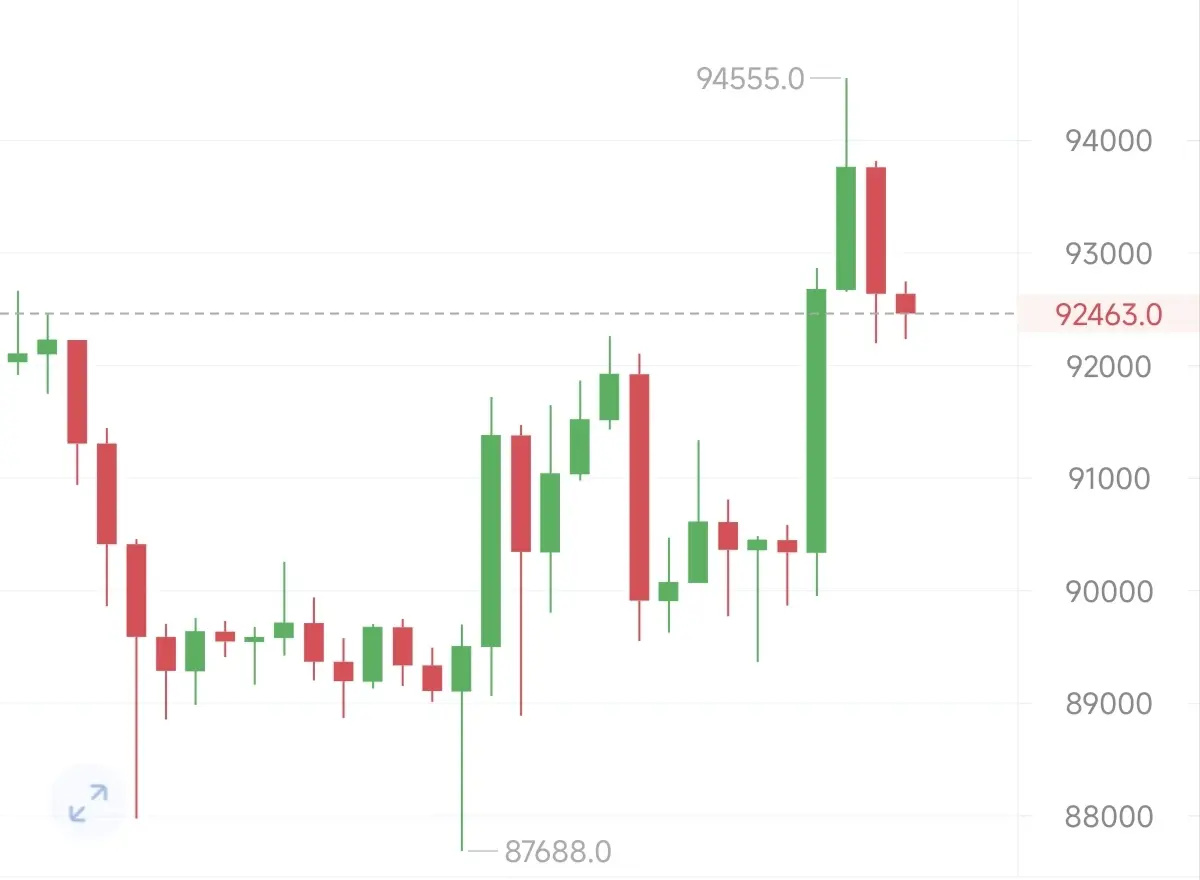
Yesterday, the market was relatively flat during the day, with limited price fluctuations for Bitcoin. However, in the evening, the trend strengthened significantly, and the price surged rapidly, reaching a high near 94,500 before starting to pull back. Currently, the market is consolidating around the 92,400 level.
Overall, after a sustained upward move, the market has entered a consolidation phase at a high level. Although there is some short-term downward pressure, the main technical structure still favors the bulls. Going forward, attention should be paid to whether the price can find effe
Overall, after a sustained upward move, the market has entered a consolidation phase at a high level. Although there is some short-term downward pressure, the main technical structure still favors the bulls. Going forward, attention should be paid to whether the price can find effe
BTC-2.41%
- Reward
- 1
- 1
- Repost
- Share
CryptoLoverArtist :
:
please 🙏 follow me. I Follow Back! 🎉What is the gap? This is the gap.
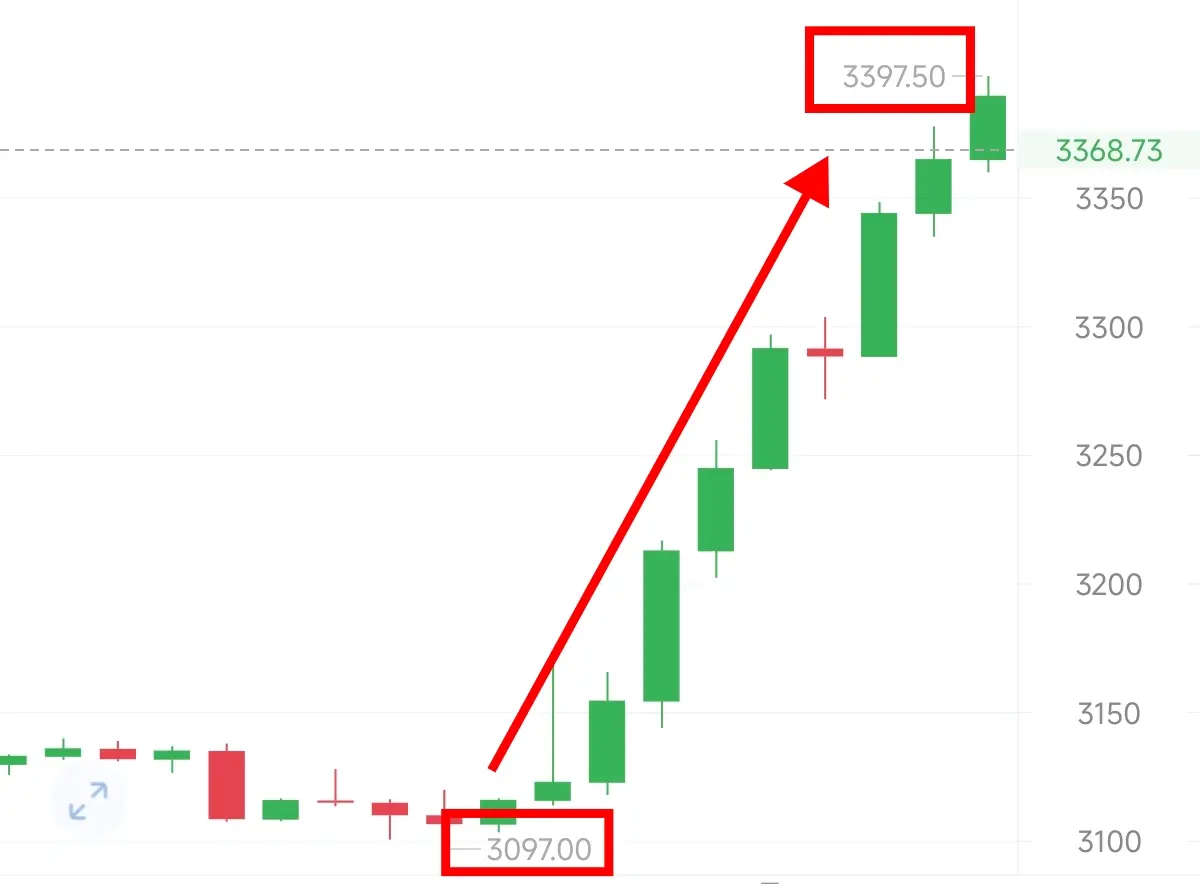
The Ethereum trade given in the morning moved a full 300 points.
If you don’t even have confidence in the strategies you share, how can you help friends in live trading achieve substantial results?
#晒出我的Alpha积分 $BTC $ETH
View OriginalThe Ethereum trade given in the morning moved a full 300 points.
If you don’t even have confidence in the strategies you share, how can you help friends in live trading achieve substantial results?
#晒出我的Alpha积分 $BTC $ETH
- Reward
- 1
- Comment
- Repost
- Share