MuxiTrading
vip
Age 0.7 Yıl
Peak Tier 5
No content yet
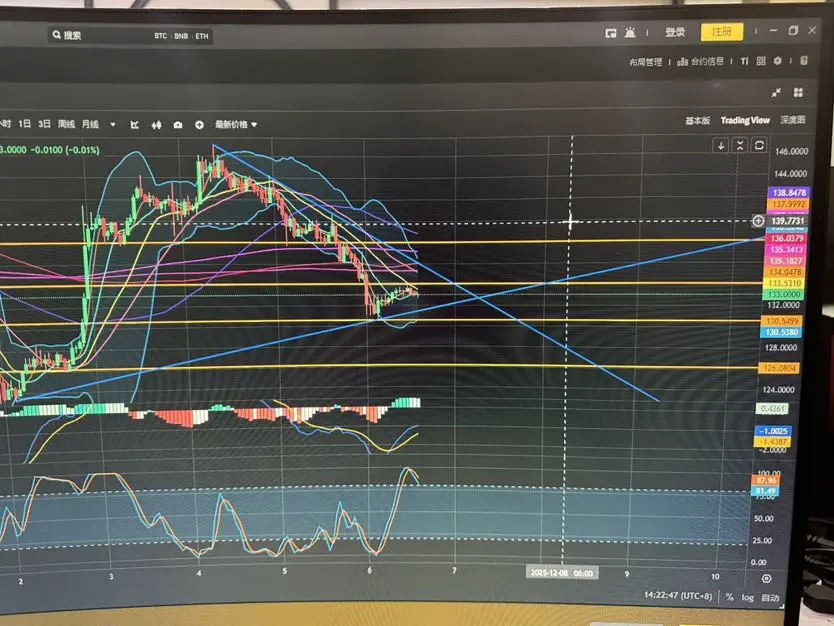
ETH 1-hour indicator shows Bollinger Bands opening and closing within the range of 3318-2988. The middle band downward corresponds to a price of 3152, ETH at a price of 3088.
Moving average indicators:
MA5 and MA10 crossover at 3079-3086.
30-day moving average downward at 3179.
60-day moving average downward at 3215.
120-day moving average upward at 3207.
240-day moving average upward at 3150.
360-day moving average upward at 3083.
MACD: Below the zero line, the fast line is below the slow line, indicating decreasing bearish momentum, with a bullish crossover trending upward.
RSI: 29-27, enter
ETH-4.8%
View Original
ETH
pump
fall
31 ParticipantsEnds In 1 Day
  • Reward
  • Comment
  • Repost
  • Share
#加密市场观察
ETH 1-Hour Indicator shows Bollinger Bands contracting between 3152-3275. The middle band descending corresponds to a price of 3213, and ETH's price is 3257.
Moving average indicators: The MA5 and MA10 double lines are upward, corresponding to prices of 3248-3239. The 30-day moving average crossing downward with the middle band corresponds to 3211. The 60-day moving average turning downward and crossing the upper band corresponds to 3270. The 120-day moving average trending upward corresponds to 3193. The 240-day moving average trending upward corresponds to 3172-3075; the 360-day mov
ETH-4.8%
View Original
  • Reward
  • Comment
  • Repost
  • Share
#参与创作者认证计划月领$10,000 ETH Direction: The four-hour chart just touched the four-hour MA30 and then rebounded to rise, currently below the four-hour MA10 and the middle band. The one-hour chart shows the Bollinger Bands are contracting. It just touched the upper band of the Bollinger Bands and then pulled back.
Resistance levels above are 3257 and 3283. Support levels below are 3186 and 3154.
Summary:
High short strategy: Short at 3257, add to short at 3283
Low long strategy: Long at 3186, add to long at 3154
ETH-4.8%
View Original
  • Reward
  • 1
  • Repost
  • Share
GateUser-2a9c9a64vip:
You people always talk nonsense.
#美联储降息预测 ETH1-Hour Indicators show Bollinger Bands are narrowing between 3426-3177. The midline is trending downward at 3302, with ETH at 3207.
Moving average indicators: MA5 and MA10 are both trending downward at 3307-3208. The 30-day moving average is declining at 3257. The 60-day moving average is trending upward at 3248, the 120-day at 3160, and the 240-day at 3090; the 360-day is trending upward at 3060.
MACD: Below the zero line, the fast line is below the slow line, indicating a bearish crossover.
RSI: 13-8. Entering oversold territory, both lines are trending upward, indicating a poten
ETH-4.8%
View Original
  • Reward
  • Comment
  • Repost
  • Share
#加密市场观察
Based on the 1-hour SOL indicator, the Bollinger Bands are opening, corresponding to the range of 141-130.8. The middle band shows a downward trend, corresponding to a price of 136, and SOL corresponds to a price of 133.5.
Moving average indicators: ma5 has crossed below ma10 from above. The downward movement of ma5 corresponds to a price of 136. ma10 shows a downward trend, corresponding to a price of 137.6. The 30-day moving average is trending upward, corresponding to a price of 135. The 60-day moving average is trending upward, corresponding to a price of 135.5. The 120-day moving
SOL-3.09%
View Original
  • Reward
  • Comment
  • Repost
  • Share
#美联储降息预测 ETH 1-hour indicators show the Bollinger Bands narrowing, corresponding to the range of 3448-3015. The middle band is moving upward, corresponding to a price of 3231, and ETH’s corresponding price is 3294.
Moving Averages: MA5 has crossed below MA10 from above, with a downward price of 3308. MA10 is showing a downward trend, corresponding to a price of 3335. The 30-day moving average is rising, corresponding to a price of 3194. The 60-day moving average is rising, corresponding to a price of 3149. The 120-day moving average is rising, corresponding to a price of 3104. The 240-day movi
ETH-4.8%
View Original
  • Reward
  • Comment
  • Repost
  • Share
#今日你看涨还是看跌? From the SOL 1-hour indicators, the Bollinger Bands are opening, corresponding range 138.3-130.6. The middle band is moving down, corresponding price 134.4; SOL at 132.
Moving average indicators.
ma5 and ma10 are both trending down and are now above SOL at 132.8-133.1. The 30-day MA is trending up at 134.8. The 60-day MA is trending up at 133.7, the 120-day MA is trending down at 135.2, the 240-day MA is trending down at 135.18; the 360-day MA is flat at 136.3.
MACD: below the 0 line. The fast line is below the slow line, a bearish crossover and falling.
RSI: 15-6. The two lines c
SOL-3.09%
View Original
  • Reward
  • Comment
  • Repost
  • Share
#美联储降息预测 ETH 1-hour indicators show the Bollinger Bands opening up with a range of 3163-3092. The middle band is trending upward with a corresponding price of 3127, and ETH's corresponding price is 3104.
Moving averages:
ma5 has crossed below ma10, currently at 3116.
ma10 is rising, corresponding price 3118.
30-day MA is declining, corresponding price 3115.
60-day MA is rising, corresponding price 3082.
120-day MA is declining, corresponding price 3095.
240-day MA is rising, corresponding price 3028.
360-day MA is flat, corresponding price 3008.
MACD: Above the zero line. The slow line is abov
ETH-4.8%
View Original
  • Reward
  • Comment
  • Repost
  • Share
#美联储降息预测 SOL 1-hour indicators: The Bollinger Bands are opening with a corresponding range of 139-131. The middle band is descending, corresponding to a price of 135, and SOL's corresponding price is 132.
Moving averages:
MA5 has crossed below MA10, with a corresponding price of 133.4. The 30-day moving average is descending at 134.9. The 60-day moving average is ascending at 133, the 120-day moving average is descending at 135.6, the 240-day moving average is descending at 135, and the 360-day moving average is flat at 136.
MACD: Below the zero line. The fast line is below the slow line in a
SOL-3.09%
View Original
  • Reward
  • Comment
  • Repost
  • Share
#比特币活跃度走高 SOL 1-hour indicators: The Bollinger Bands are opening up, corresponding to the range of 137-129. The middle band is trending upward, corresponding to a price of 133, and SOL is corresponding to a price of 135.
Moving Average Indicators:
MA5 has crossed above MA10 from below, corresponding to a price of 134.6. The 30-day moving average is trending downward, corresponding to a price of 133. The 60-day moving average is trending downward, corresponding to a price of 132.8. The 120-day moving average is trending downward, corresponding to a price of 136. The 240-day moving average is tr
BTC-2.12%
SOL-3.09%
View Original
  • Reward
  • Comment
  • Repost
  • Share
#反弹币种推荐 SOL 1-hour indicators: The Bollinger Bands are opening, corresponding to the range 136.2-129. The middle band is trending downward, corresponding to the price of 132.6, and SOL is at 132.8.
Moving average indicators:
The MA5 has crossed below the MA10 at 132.1. The 30-day moving average is trending downward at 132.6. The 60-day moving average is trending downward at 132.7, the 120-day moving average is trending downward at 137, the 240-day moving average is trending upward at 135.6, and the 360-day moving average is flat at 136.
MACD: Above the 0 axis. The fast line is above the slow l
SOL-3.09%
View Original
  • Reward
  • Comment
  • Repost
  • Share
#百倍币种分享 nvSOL 1-hour indicators show the Bollinger Bands opening and closing with a corresponding range of 136.5-130.5. The middle band is trending downward, corresponding to a price of 133.5, with SOL at 133.
Moving average indicators:
The MA10 has crossed above the MA5 from below, corresponding to a price of 133.1. The 30-day moving average is trending downward at 135.18. The 60-day moving average is trending upward at 138.8, the 120-day moving average is trending upward at 136, the 240-day moving average is trending upward at 137.18; the 360-day moving average is flat at 135.3.
MACD: Below
SOL-3.09%
View Original
post-image
  • Reward
  • Comment
  • Repost
  • Share
#十二月行情展望 ETH 1-hour indicators: Bollinger Bands are opening downward, corresponding to the range 3190-2963. The middle band is moving down, corresponding to a price of 3077, and ETH is at 3021.
Moving averages:
ma5 and ma10 are about to cross at 3022.
ma10 is moving up, corresponding to 3154. The 30-day moving average is starting to turn downward at 3102. The 60-day moving average is turning downward at 3133, the 120-day moving average is turning upward at 3012, the 240-day moving average is moving up at 3010, and the 360-day moving average is flat at 2947.
MACD: Below the 0 axis. Bearish mome
ETH-4.8%
View Original
  • Reward
  • Comment
  • Repost
  • Share
Looking at the ETH 1-hour indicators, the Bollinger Bands are opening and closing with a corresponding range of 3200-3113. The middle band is trending downward, corresponding to a price of 3157, and ETH's corresponding price is 3159.
Moving Average Indicators:
The MA5 has crossed above the MA10 from below, corresponding to a price of 3166.
The MA10 is trending upward, corresponding to 3154.
The 30-day MA is turning downward, corresponding to 3170.
The 60-day MA is trending upward, corresponding to 3121.
The 120-day MA is trending downward, corresponding to 3001.
The 240-day MA is trending upwa
ETH-4.8%
View Original
  • Reward
  • Comment
  • Repost
  • Share
Will ETH fall back below 3000? #十二月行情展望
ETH Direction: Looking at the four-hour chart, it is still in an uptrend pullback and has not broken below the MA5 and MA10. On the one-hour chart, it is currently at the short-term support level of MA30. If it breaks below, it will test the middle line of the one-hour chart. If it doesn't break during the test, you can open a long position there.
Upper resistance levels: 3207, 3270
Lower support levels: 3127, 3062
Summary:
High short strategy: open an initial short at 3207, add to the position at 3270
Low long strategy: open an initial long at 3127, ad
ETH-4.8%
View Original
  • Reward
  • 1
  • Repost
  • Share
MuxiTradingvip:
快上车!🚗
From the 1-hour SOL indicators, the Bollinger Bands are opening downward, corresponding to the 145-138 range. The middle band is trending upward with a corresponding price of 141.5, and SOL's current price is 139.8.
Moving Average Indicators:
- MA5 is trending downward with a corresponding price of 139.2.
- MA10 is trending downward with a corresponding price of 140.1.
- 30-day MA is trending downward with a corresponding price of 142.5.
- 60-day MA is trending upward with a corresponding price of 141.4.
- 120-day MA is trending upward with a corresponding price of 135.9.
- 240-day MA is trend
SOL-3.09%
View Original
  • Reward
  • Comment
  • Repost
  • Share
From the 1-hour ETH indicators, the Bollinger Bands are opening and closing within the range of 3225-3010. The middle band is trending upward, corresponding to a price of 3117, and ETH’s corresponding price is 3210.
Moving averages:
MA5 is trending upward, corresponding to a price of 3197.
MA10 is trending upward, corresponding to a price of 3166.
30-day moving average is trending upward, corresponding to a price of 3087.
60-day moving average is trending upward, corresponding to a price of 2960.
120-day moving average is trending downward, corresponding to a price of 2952.
240-day moving aver
ETH-4.8%
View Original
  • Reward
  • Comment
  • Repost
  • Share
Technical Analysis of ETH on July 28, 2025
1. Bollinger Bands (1 hour): Opening upwards, range 3882.5 - 3757.
The current price is above the middle track (3819), showing a unilateral upward trend.
The price once broke through the upper track and has now slightly retraced.
2. Moving Average System (MA):
Overall, it shows a one-sided upward arrangement.
MA5 (3856) and MA10 (3842) have crossed upwards.
Key moving averages: MA30(3800), MA60(3757), MA120(3707), MA360(3506).
The current price is testing the support near the Bollinger Band middle line/MA30 (3820/3800) after falling below MA100(.
3. T
ETH-4.8%
View Original
post-image
[The user has shared his/her trading data. Go to the App to view more.]
  • Reward
  • Comment
  • Repost
  • Share
BTC/USDT Analysis
Current trend: sideways consolidation
Core range: 108,610- 109,310 Key resistance: 109,810
Key Support: 107,310 Current Trend: The price is currently testing the upper range resistance at 109,310. If it fails to break through effectively, a slight pullback is expected. Key Observation Point: Need to closely monitor the strength of the support level at 108,610. If it can stabilize above this level, the range-bound pattern will be maintained; if it breaks down effectively, it may test the 107,310 support.
ETH/USDT Analysis
Current trend: Consolidation
Core range: 2,586 - 2,621
ETH-4.8%
BTC-2.12%
View Original
  • Reward
  • Comment
  • Repost
  • Share
BTC Analysis and Review
Today's Bitcoin Market Analysis
Market Review:
Yesterday's strategy suggested shorting at 109,010 and adding positions around 110,010. The market rebounded to a high near 109,510 in the morning yesterday before starting to fluctuate and decline, reaching a low of 107,210 before beginning to rebound. During this period, the price remained in a small range consolidation between 108,610 and 108,010.
4-Hour Technical Analysis:
Bollinger Bands: The opening is narrowing, and the current range is 107,484 - 109,179. The middle line (108,340) is running horizontally. After a pri
BTC-2.12%
View Original
[The user has shared his/her trading data. Go to the App to view more.]
  • Reward
  • Comment
  • Repost
  • Share
  • Trending TopicsView More
  • Pin
Trade Crypto Anywhere Anytime
qrCode
Scan to download Gate App
Community
  • 简体中文
  • English
  • Tiếng Việt
  • 繁體中文
  • Español
  • Русский
  • Français (Afrique)
  • Português (Portugal)
  • Bahasa Indonesia
  • 日本語
  • بالعربية
  • Українська
  • Português (Brasil)