Trade
Basic
Futures
Futures
Hundreds of contracts settled in USDT or BTC
TradFi
Gold
Trade global traditional assets with USDT in one place
Options
Hot
Trade European-style vanilla options
Unified Account
Maximize your capital efficiency
Demo Trading
Futures Kickoff
Get prepared for your futures trading
Futures Events
Participate in events to win generous rewards
Demo Trading
Use virtual funds to experience risk-free trading
Earn
Launch
CandyDrop
Collect candies to earn airdrops
Launchpool
Quick staking, earn potential new tokens
HODLer Airdrop
Hold GT and get massive airdrops for free
Launchpad
Be early to the next big token project
Alpha Points
Trade on-chain assets and enjoy airdrop rewards!
Futures Points
Earn futures points and claim airdrop rewards
Investment
Simple Earn
Earn interests with idle tokens
Auto-Invest
Auto-invest on a regular basis
Dual Investment
Buy low and sell high to take profits from price fluctuations
Soft Staking
Earn rewards with flexible staking
Crypto Loan
0 Fees
Pledge one crypto to borrow another
Lending Center
One-stop lending hub
VIP Wealth Hub
Customized wealth management empowers your assets growth
Private Wealth Management
Customized asset management to grow your digital assets
Quant Fund
Top asset management team helps you profit without hassle
Staking
Stake cryptos to earn in PoS products
Smart Leverage
New
No forced liquidation before maturity, worry-free leveraged gains
GUSD Minting
Use USDT/USDC to mint GUSD for treasury-level yields
More
Bit_Hunterrr
No content yet
Bit_Hunterrr
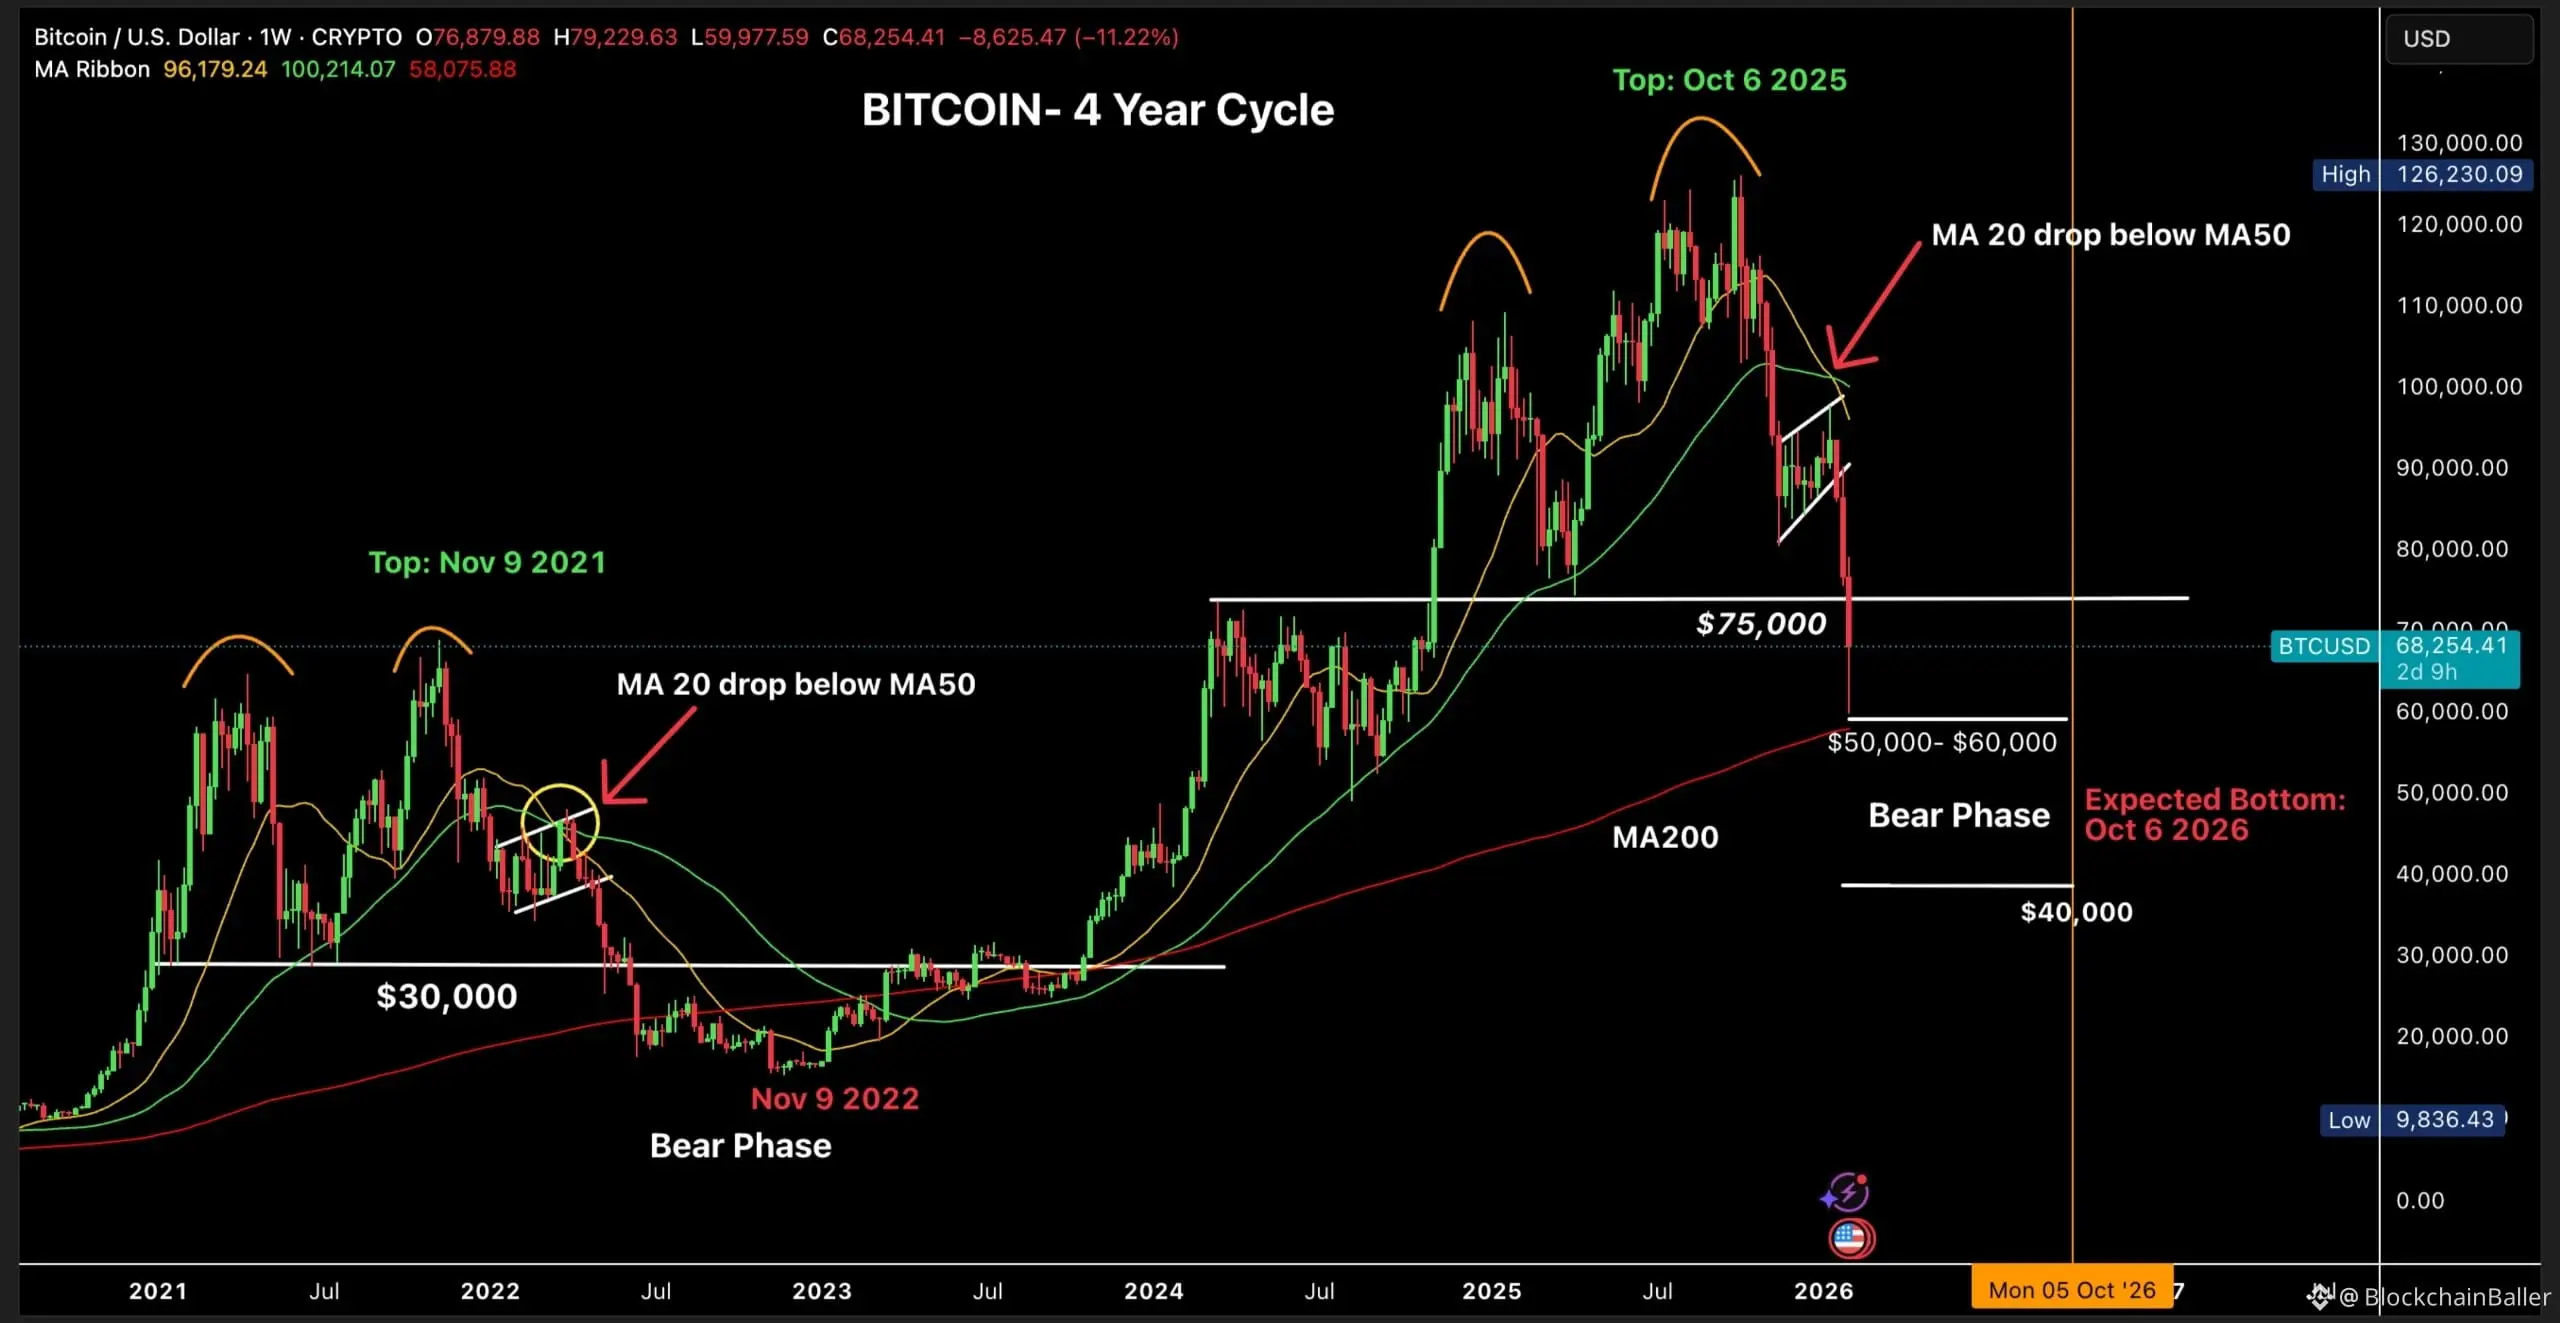
$BTC $75,000 zone we highlighted earlier was a very crucial level for Bitcoin.....
The moment $BTC lost that weekly support, the downside accelerated fast. Within just a few days, price tapped the $60,000 zone, exactly the range we had highlighted.
Once $75K broke, the higher high and higher low structure on the bigger timeframe failed. That structure break is what opened the door for this straight move lower.
Now Bitcoin is trading below both the 20W and 50W moving averages, which keeps momentum weak on the weekly timeframe.
As long as BTC stays below these MA, upside remains capped and rall
BTC3%
- Reward
- like
- Comment
- Repost
- Share
- Reward
- 1
- Comment
- Repost
- Share
1. Today's News Flash: Technical Rebound and Bullish Counterattack After the Sharp Drop
• $BTC Reclaims the $70,000 Mark: After yesterday's plunge to a near one-year low of $60,500, Bitcoin has launched a strong counterattack. The latest price is currently around $70,700 - $71,300. With leverage largely cleared during the sharp drop, the market is showing strong rebound resilience 📈.
• US Stock Market Impact: Overnight strength in US stocks (especially Nvidia) boosted risk appetite. As a result, crypto stocks such as MicroStrategy (MSTR) rebounded sharply by 25% after yesterday's plunge, boo
BTC3%

- Reward
- like
- Comment
- Repost
- Share
$ADA Market Report
Market Bias: Cautiously Bullish
After an extended decline, ADA has bounced from recent lows and is attempting to form a base. Early signs of buyer interest are appearing, though confirmation is still developing.
Volume Analysis:
Buying volume is increasing on green candles, while selling pressure remains weak. This suggests sellers may be losing control, supporting a potential short-term upside move.
Trade Plan:
Entry Zone: 0.355 – 0.360 (buy on pullback)
Stop-Loss: Below 0.339
Targets:
TP1: 0.385
TP2: 0.405 (if momentum continues)
Notes:
Price should not be chased. Pullback
ADA2,92%
- Reward
- like
- Comment
- Repost
- Share
* 21SHARES FILES FOR U.S. SPOT@$ONDO ETF IN MAJOR RWA / DEFI PUSH On Feb 6, 2026, asset manager 21Shares filed a preliminary prospectus with the SEC to launch the 21Shares Ondo Trust, a spot ETF tracking the ONDO token.
The fund would directly hold ONDO, track the CME CF Ondo Finance; Dollar Reference Rate, use Coinbase Custody, and target a Nasdaq listing. If approved, it would be one of the first U.S. spot ETFs tied to an ERC-20 token focused on tokenized real-world assets (RWAs), signaling accelerating institutional adoption beyond Bitcoin and Ethereum.$ONDO
The fund would directly hold ONDO, track the CME CF Ondo Finance; Dollar Reference Rate, use Coinbase Custody, and target a Nasdaq listing. If approved, it would be one of the first U.S. spot ETFs tied to an ERC-20 token focused on tokenized real-world assets (RWAs), signaling accelerating institutional adoption beyond Bitcoin and Ethereum.$ONDO
ONDO0,71%

- Reward
- 1
- Comment
- Repost
- Share
- Reward
- like
- Comment
- Repost
- Share
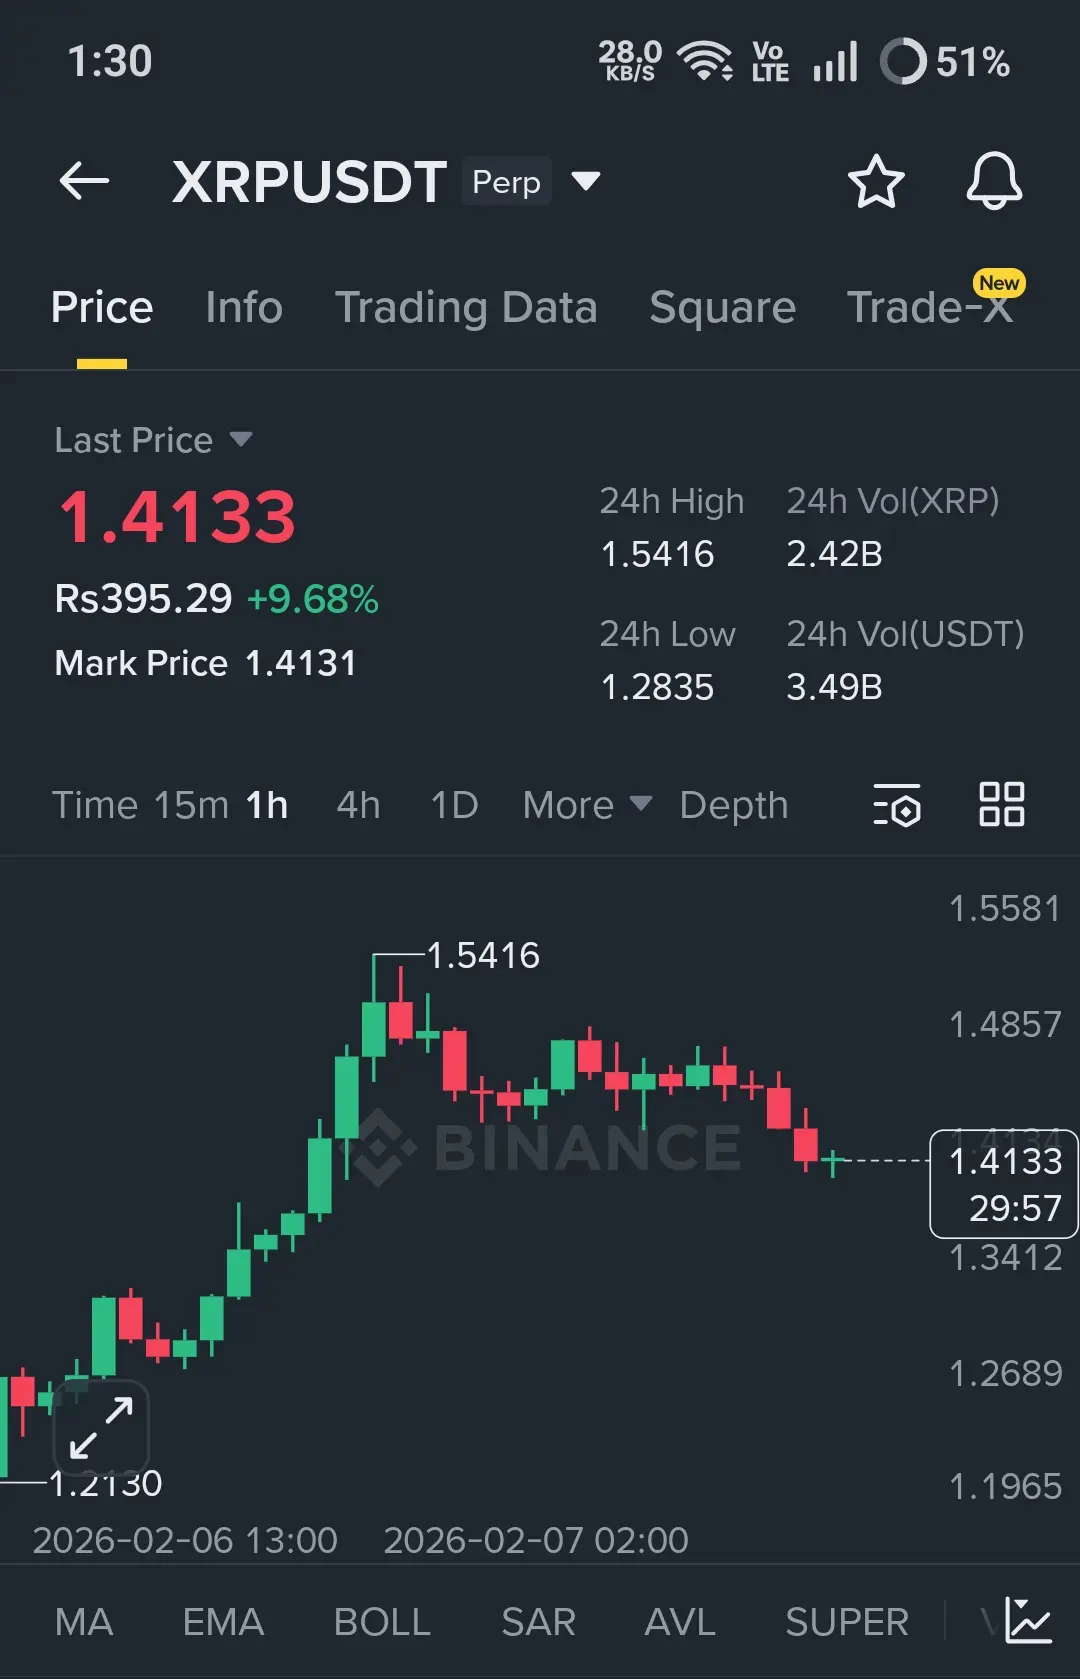
$XRP – SHORT
Trade Plan:
Entry: $1.40 – $1.42
SL: $1.47
TP1: $1.36
TP2: $1.32
TP3: $1.26
Why this setup?
After a strong rally, XRP is showing clear rejection near the recent high zone around $1.48–$1.50 and is now printing lower highs on the 1h timeframe. Momentum is fading and price is slipping back toward mid range support. This SHORT setup targets a pullback move as buyers lose control and early longs begin to unwind.
Debate:
Is this the start of a deeper correction, or will bulls defend the dip again?$XRP
XRP-0,42%
- Reward
- like
- Comment
- Repost
- Share
CALLED $ETH CRASH AT $3,700. NOW 65% DOWN. ACCUMULATION ZONE ACTIVATED
REMEMBER MY WARNING?
When ETH Broke $3,700-$3,600 Support, I told you: "Major Breakdown Incoming"
THE RESULT:
✅ Entry Warning: $3,700
✅ Current Price: ~$1,700
✅ Total Drop From Our Entry: -54% (65% from Peak in Last 6 months)
ACCUMULATION ZONES:
✅ Zone 1: $2,000-$1,800 - FILLED (First Bids Triggered)
🎯 Zone 2: $1,400-$1,270 (0.786 Fib) - BIDS PLACED
→ This is maximum Pain Zone
→ Historical Bounce Level
→ Best Long-Term Entry
WHY I’M LONG-TERM BULLISH ON #ETH:
→ U.S. #ETHETFs Have Accumulated 6M ETH ($55B) in ~18 months
→ #
ETH5,03%

- Reward
- 1
- Comment
- Repost
- Share
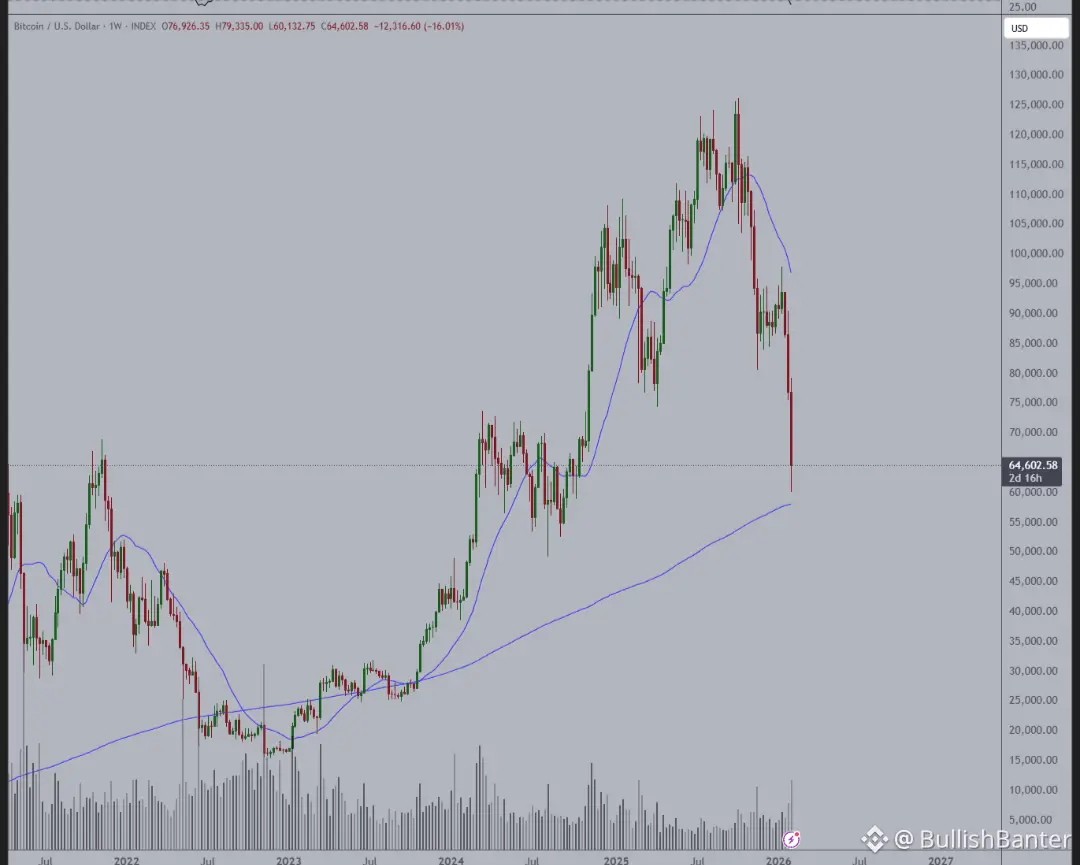
In a blink of an eye, we went sub $60K.
Massive correction. In just two weeks, #Bitcoin drops from $98K to $60K.
Now, the 200-Week MA is beneath us, and it's all depending on the coming days/hours.
Given that the hourly candle sub $60K was the largest volume candle, the assumption can be made that we hit the low there, for now.
If prices can rally up slightly, we're going to see a large wick.
Like we always see with capitulation events.$BTC
BTC3%
- Reward
- 1
- Comment
- Repost
- Share
- Reward
- like
- 1
- Repost
- Share
Plastikkid :
:
Follow 🔍 closely🚨 Is the Crypto Crash Almost Over? 📉 Key Signals Hint at a Potential Market Rebound Is the Crypto Crash Almost Over?
Key Signals Hint at a Potential Market Rebound
The crypto market has been under intense pressure, with major assets like Bitcoin and Ethereum experiencing sharp corrections. Panic selling, liquidations, and negative sentiment have dominated headlines. But beneath the surface, several key indicators suggest that the worst of the downturn may be nearing its end.
So, is a recovery finally on the horizon?
Oversold Conditions Flashing Green Technical indicators across multiple time

- Reward
- like
- Comment
- Repost
- Share
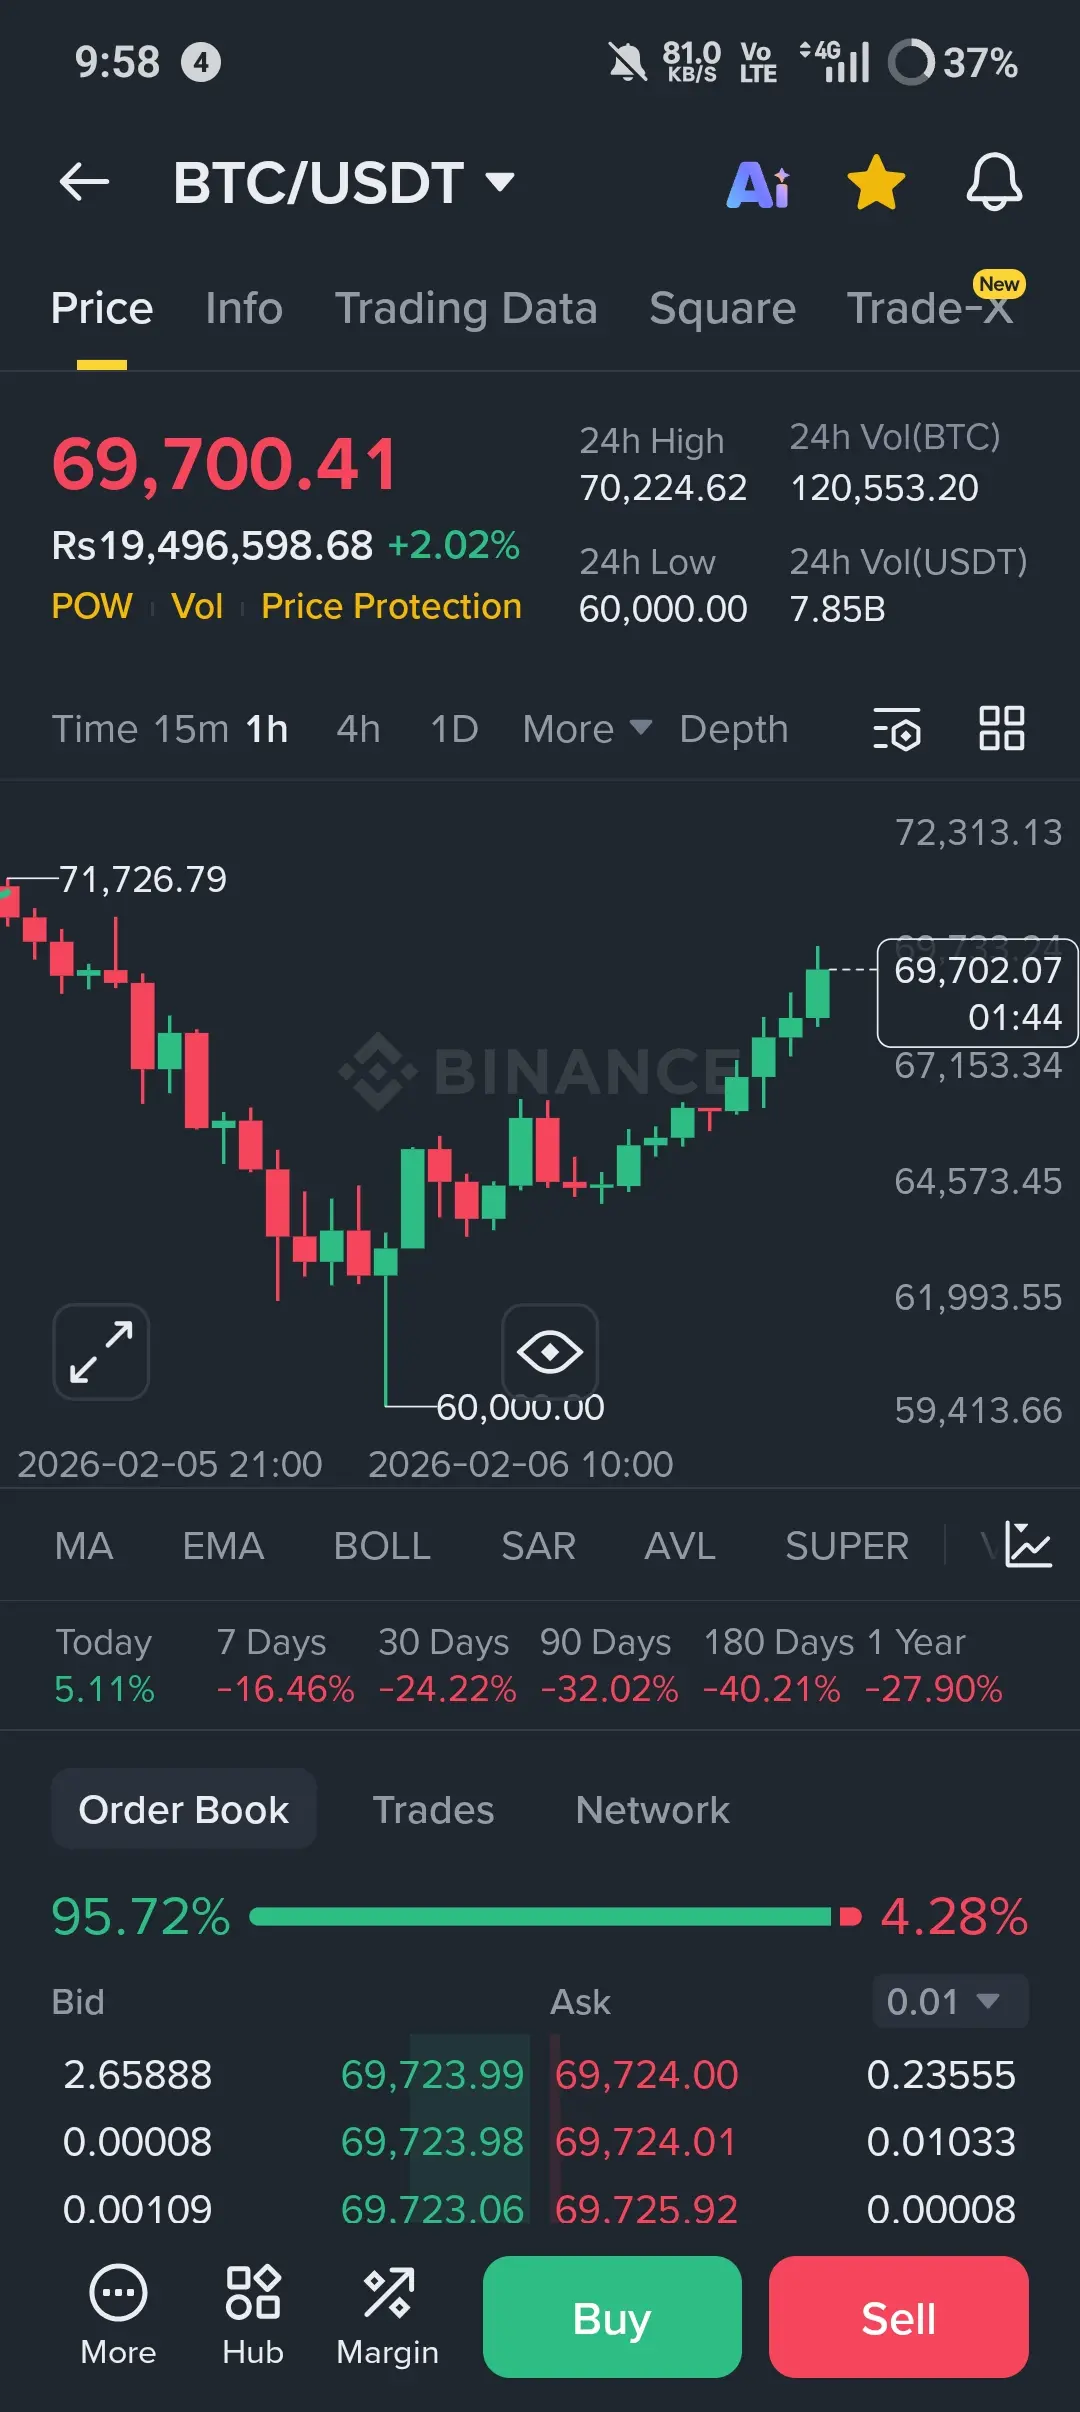
$BTC Long Trade Setup
Entry Zone
$69000
$69500
Targets
TP1 $71000
TP2 $73500
TP3 $76000
Stop Loss
$65000
Analysis
BTC has confirmed a strong bullish reversal from the $60000 demand zone and is now forming higher highs and higher lows on the 1H timeframe. Momentum is clearly shifting in favor of buyers, with price reclaiming key resistance near $69000. Holding above this zone keeps the upside continuation valid toward higher resistance levels.
Buy and Trade $BTC
BTC3%
- Reward
- like
- Comment
- Repost
- Share
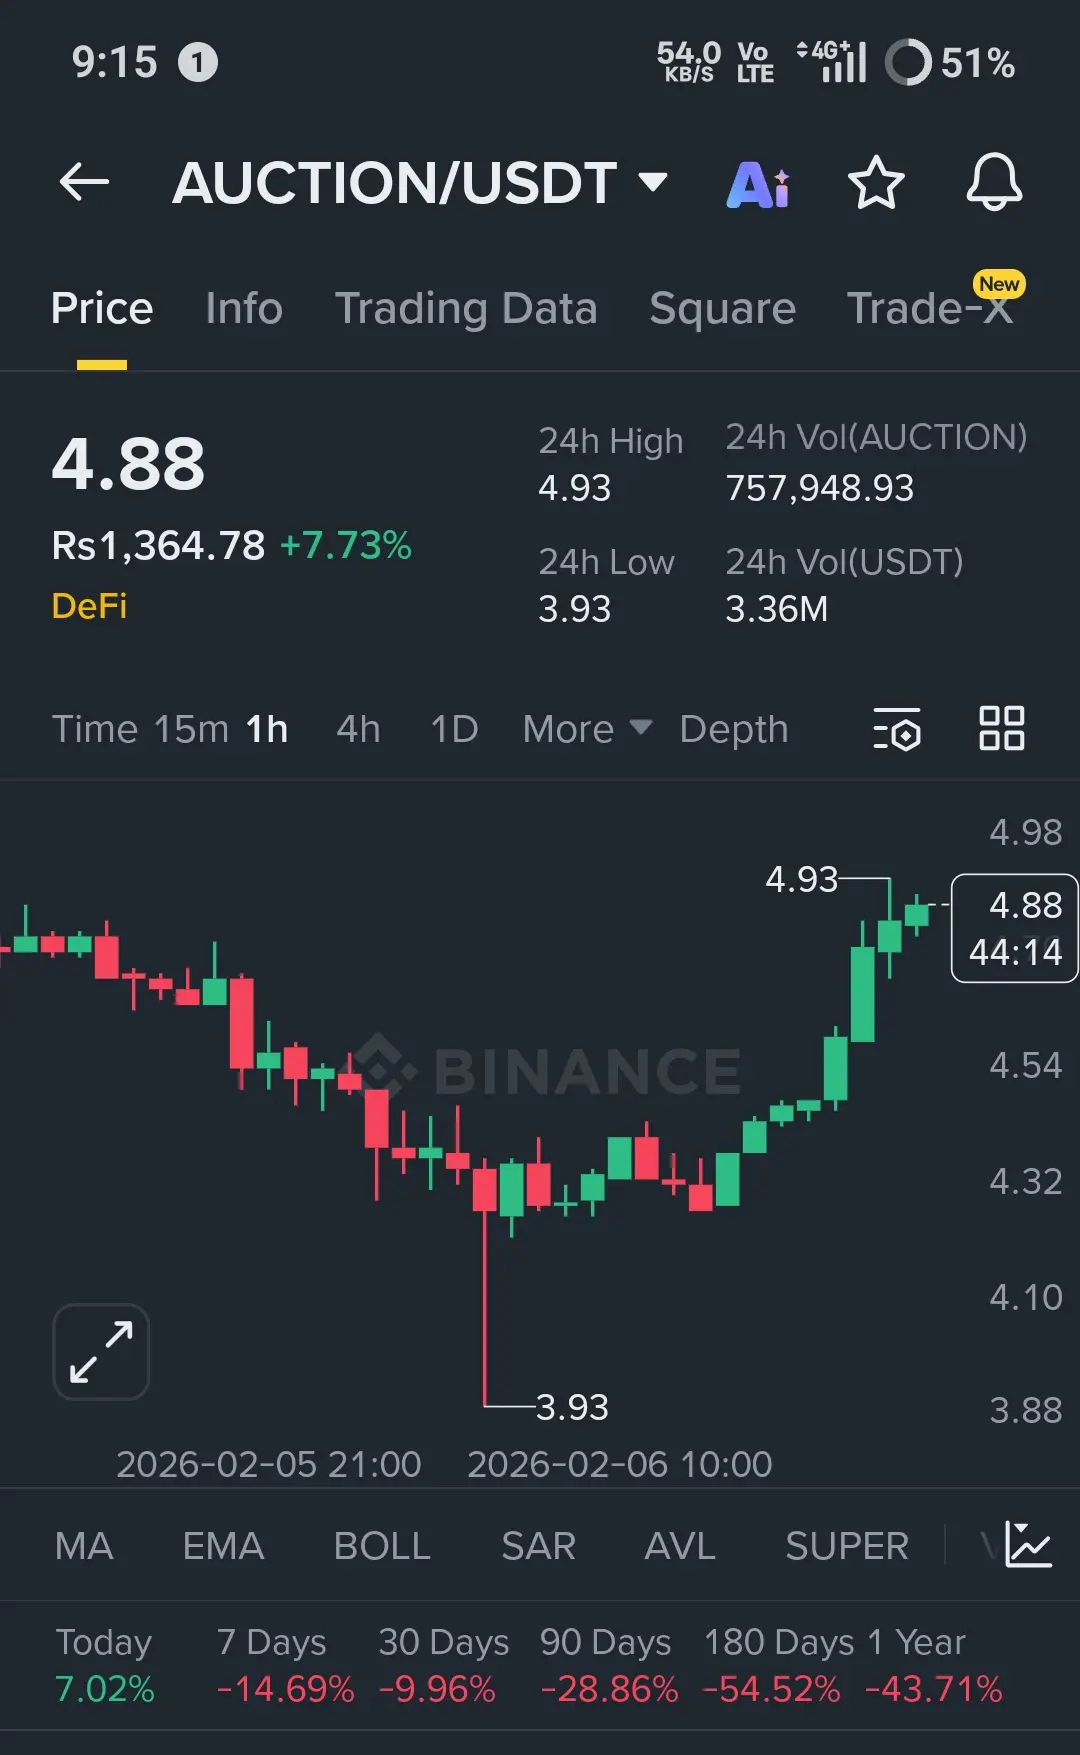
$AUCTION /USDT Strong Bullish Reversal From Demand Zone
AUCTION has printed a clear reversal after tapping the strong demand zone around $4.20 to $4.30. The sharp impulsive move upward on the 4H timeframe shows aggressive buyer interest, flipping short term structure to bullish. Price is now consolidating near highs, which often acts as a continuation signal rather than weakness.
Entry Zone
$4.70 to $4.90
Target 1
$5.15
Target 2
$5.50
Target 3
$5.90
Stop Loss
$4.30
As long as price holds above the $4.50 support area, bullish momentum remains intact. A confirmed break above $5.00 will likely ac
AUCTION3,66%
- Reward
- like
- Comment
- Repost
- Share
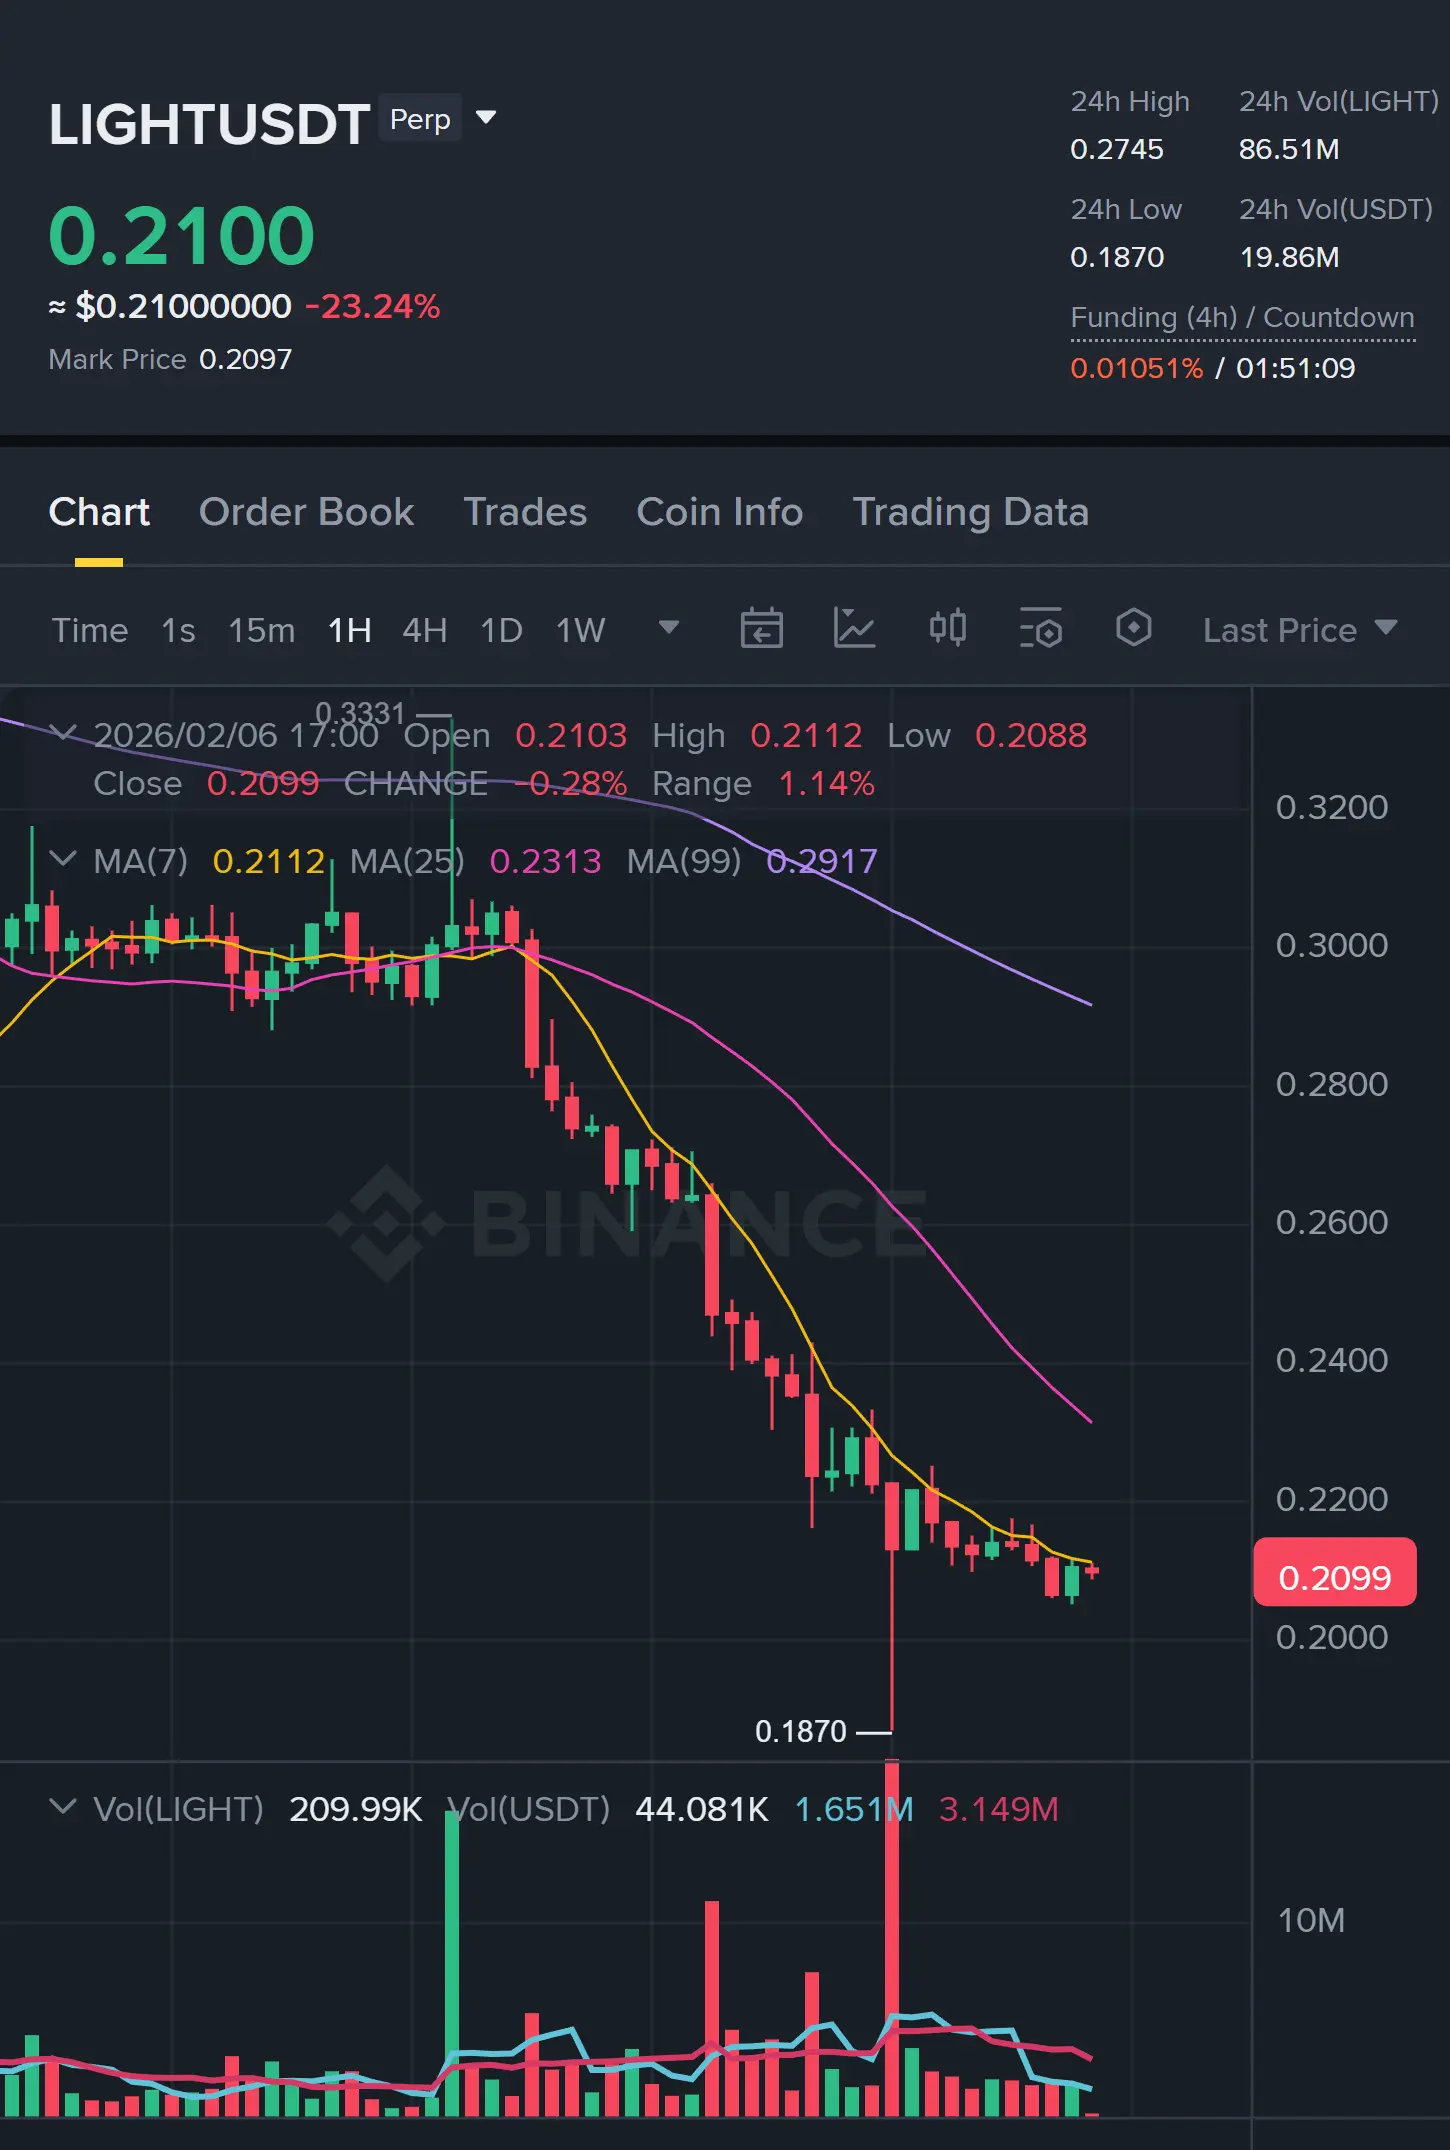
$LIGHT is trying to reclaim — if it can’t, it dumps.
$LIGHT - SHORT
Trade Plan:
Entry: 0.207 – 0.212
SL: 0.223
TP1: 0.196
TP2: 0.191
TP3: 0.182
Why this setup?
4h plan is valid only on confirmation at (0.207-0.212).
The 1d trend is range-bound, so location matters, so I’m aligning entries with the higher-timeframe pressure.
Once the zone confirms, TP1 at 0.196 is the first magnet move. Lower TF RSI shows no extreme oversold, leaving room for the move to develop.
Reclaim beyond 0.330 = thesis broken.
Debate:
Do bears get the rejection into 0.196, or do bulls reclaim above 0.330 and squeeze sho
LIGHT0,65%
- Reward
- like
- Comment
- Repost
- Share
- Reward
- like
- Comment
- Repost
- Share
$ETH is running into overhead supply — the short is armed on rejection.
$ETH - SHORT
Trade Plan:
Entry: 1893.197 – 1924.080
SL: 2001.286
TP1: 1815.991
TP2: 1785.108
TP3: 1723.343
Why this setup?
The 1d trend is bearish, reinforcing the bias, while the 4h plan targets a move toward 1815.991 first.
I’m watching lower timeframes for confirmation inside (1893.197-1924.080) — no guessing, just reaction.
Weakness confirms and we unwind; TP1 is the first checkpoint. Lower TF RSI shows no extreme oversold, leaving room for the move to develop.
Reclaim/acceptance beyond 2400.976 invalidates this idea.
ETH5,03%
- Reward
- 1
- Comment
- Repost
- Share