Trade
Basic
Futures
Futures
Hundreds of contracts settled in USDT or BTC
TradFi
Gold
Trade global traditional assets with USDT in one place
Options
Hot
Trade European-style vanilla options
Unified Account
Maximize your capital efficiency
Demo Trading
Futures Kickoff
Get prepared for your futures trading
Futures Events
Participate in events to win generous rewards
Demo Trading
Use virtual funds to experience risk-free trading
Earn
Launch
CandyDrop
Collect candies to earn airdrops
Launchpool
Quick staking, earn potential new tokens
HODLer Airdrop
Hold GT and get massive airdrops for free
Launchpad
Be early to the next big token project
Alpha Points
Trade on-chain assets and enjoy airdrop rewards!
Futures Points
Earn futures points and claim airdrop rewards
Investment
Simple Earn
Earn interests with idle tokens
Auto-Invest
Auto-invest on a regular basis
Dual Investment
Buy low and sell high to take profits from price fluctuations
Soft Staking
Earn rewards with flexible staking
Crypto Loan
0 Fees
Pledge one crypto to borrow another
Lending Center
One-stop lending hub
VIP Wealth Hub
Customized wealth management empowers your assets growth
Private Wealth Management
Customized asset management to grow your digital assets
Quant Fund
Top asset management team helps you profit without hassle
Staking
Stake cryptos to earn in PoS products
Smart Leverage
New
No forced liquidation before maturity, worry-free leveraged gains
GUSD Minting
Use USDT/USDC to mint GUSD for treasury-level yields
More
Korean_Girl
No content yet
Korean_Girl
【$1000RATS Signal】Pullback to Long + 1H Rebound EMA20 Support
$1000RATS The 1H timeframe is currently in a healthy pullback phase after a strong rally, with the price receiving initial support near the EMA20 moving average. The 4H timeframe has broken through the downward trendline, but the price is far from the EMA50, requiring a pullback for confirmation. The current market shows that although the price has retreated from the high point, the open interest remains stable, with no signs of large-scale capital outflows, indicating a clear intention of the main force to defend the market. The 1-
$1000RATS The 1H timeframe is currently in a healthy pullback phase after a strong rally, with the price receiving initial support near the EMA20 moving average. The 4H timeframe has broken through the downward trendline, but the price is far from the EMA50, requiring a pullback for confirmation. The current market shows that although the price has retreated from the high point, the open interest remains stable, with no signs of large-scale capital outflows, indicating a clear intention of the main force to defend the market. The 1-

- Reward
- 1
- 3
- Repost
- Share
CryptoEye :
:
To The Moon 🌕View More
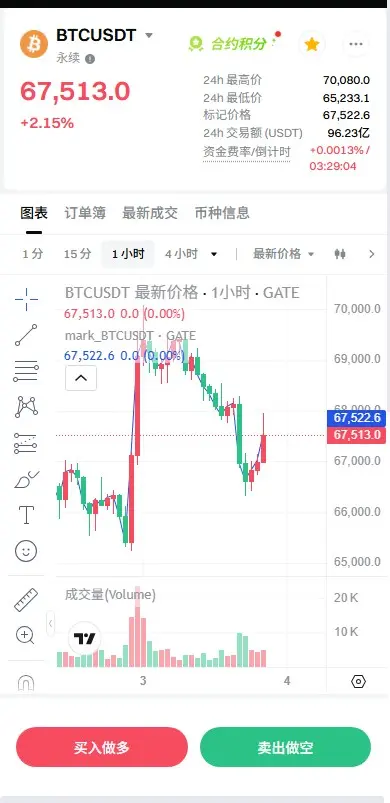
#美伊局势影响 The US-Iran situation sparks a major divergence in global assets | Will BTC stay steady at 70,000? Is gold/oil/BTC the true safe haven? Is the Fed's rate cut on hold?
The US announced an imminent large-scale attack on Iran, and the Middle East geopolitical storm is directly stirring up global financial markets: risk assets are fluctuating across the board, traditional safe havens like gold and oil are strengthening simultaneously, while Bitcoin is rebounding against the trend. Three core issues are now directly in front of all investors👇
1️⃣ BTC rebounds against the trend, is the 70,0
BTC-0,39%
- Reward
- 1
- 2
- Repost
- Share
CryptoEye:
To The Moon 🌕View More
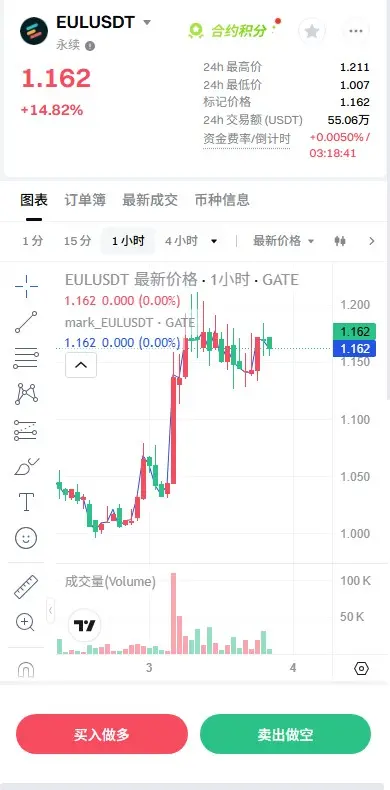
【$EUL Signal】Long - 1H breakout pullback confirmation, main force clearly intends to defend the market
$EUL On the 1H timeframe, after experiencing a massive surge yesterday, the price is currently consolidating strongly at high levels, staying close above the 1-hour moving averages, which is a typical healthy pullback after a breakout. The 4-hour timeframe has already stabilized above all moving averages, indicating a bullish trend. The current order book depth is solid, and the open interest remains stable during sideways trading, suggesting that the main force has not exited but is actively
$EUL On the 1H timeframe, after experiencing a massive surge yesterday, the price is currently consolidating strongly at high levels, staying close above the 1-hour moving averages, which is a typical healthy pullback after a breakout. The 4-hour timeframe has already stabilized above all moving averages, indicating a bullish trend. The current order book depth is solid, and the open interest remains stable during sideways trading, suggesting that the main force has not exited but is actively

- Reward
- 1
- 1
- Repost
- Share
CryptoEye:
To The Moon 🌕#贵金原油价格飙升 Affected by the Middle East situation, gold, silver, and crude oil prices surged collectively!
On March 1st, local time, it was reported that due to the ongoing escalation of the Middle East situation, international oil prices rose sharply. Brent crude oil prices once increased by nearly 13% on that day, reaching around $82 per barrel. Analysts pointed out that this round of increase, combined with the previous gains caused by escalating tensions, has resulted in a year-to-date cumulative increase of about 17%. Due to rising geopolitical risks and soaring energy prices, U.S. stock fu
On March 1st, local time, it was reported that due to the ongoing escalation of the Middle East situation, international oil prices rose sharply. Brent crude oil prices once increased by nearly 13% on that day, reaching around $82 per barrel. Analysts pointed out that this round of increase, combined with the previous gains caused by escalating tensions, has resulted in a year-to-date cumulative increase of about 17%. Due to rising geopolitical risks and soaring energy prices, U.S. stock fu
- Reward
- 1
- 1
- Repost
- Share
CryptoEye:
LFG 🔥Crypto Daily ( 03.03 ): Bitcoin briefly surges past $69,000 as institutional holdings increase amid geopolitical risks
I. Bitcoin Price Dynamics
1. Bitcoin experienced multiple price fluctuations on March 2, 2026, including breaking through 67,000 USDT (0.45% increase), surpassing 68,000 USDT (1.53% increase), and breaking through 69,000 USDT (2.74% increase). It also dipped below 66,000 USDT (0.75% decline in 24 hours or a decrease in the gain to 1.41%).
2. During the US morning trading session on March 2, Bitcoin rebounded from weekend lows to $68,600, with a 24-hour increase of 2.3%. Major


- Reward
- 2
- 2
- Repost
- Share
CryptoEye:
2026 GOGOGO 👊View More
#Gate广场发帖领五万美金红包 2 days remaining! The $50,000 Red Envelope Rain at Gate Square is ongoing 🧧
Post to win — 100% winning rate, increased reward cap!
New and existing users can earn up to 28U per post. Higher daily limits — the more you post, the more you earn.
How to participate: 1️⃣ Update the app to v8.8.0 2️⃣ Rewards are automatically issued after posting. Post now 👉 https://www.gate.com/post Details 👉 https://www.gate.com/announcements/article/49773


- Reward
- 1
- 1
- Repost
- Share
CryptoEye:
To The Moon 🌕#Gate全球注册用户突破5000万 Over 50 million users: Gate is showing the market what “scalable” really means
In the crypto industry today, the word “explosive growth” has become a bit cliché, and simply pushing user numbers has limited significance. What we should really discuss is whether this scale has translated into solid structural capabilities.
Take Gate’s recent disclosure of 50 million registered users worldwide—while the data is impressive, what’s more interesting is the “physical fitness” behind it:
Spot trading volume hitting second place globally in 24 hours, Futures consistently ranking


- Reward
- 1
- 2
- Repost
- Share
CryptoEye:
2026 GOGOGO 👊View More
#美伊局势影响 Former Federal Reserve Chair and former U.S. Treasury Secretary Yellen: Iran Situation Makes the Fed Less Willing to Cut Rates
Former Federal Reserve Chair and former U.S. Treasury Secretary Yellen recently stated that the impact of the Iran conflict on the oil market and how long it lasts will influence U.S. economic growth, while inflationary pressures will also increase. This will make the Fed's decision-making more complex:
I believe that recent developments in Iran have made the Federal Reserve more hesitant to cut rates, even more so than before the incident occurred. Currently,


- Reward
- like
- Comment
- Repost
- Share
#DeepCreationCamp
#DeepCreationCamp
GT Token Deep Dive: Tokenomics & Ecosystem Analysis
In the increasingly mature crypto environment of 2026, exchange ecosystem tokens are no longer evaluated based on hype cycles or temporary volume spikes. They are assessed based on structural alignment, capital efficiency, deflation mechanics, sustainability, and integration depth within their native ecosystems.
GateToken (GT), the native token of Gate.io and its public blockchain GateChain, represents a case study in how an exchange token can evolve from a simple fee-discount instrument into a multi-laye
GT-0,57%
- Reward
- 1
- 1
- Repost
- Share
ybaser :
:
Happy Lantern Festival🏮【$FORM Signal】Long + 1H pullback confirmation, main force clearly intends to support the market
$FORM The 1H timeframe has experienced a sharp rise and is now consolidating strongly at high levels, with prices closely following the short-term moving averages, indicating a healthy pullback and recharging structure. The 4H timeframe has confirmed a breakout of the previous consolidation platform, and the trend has shifted to bullish. Open interest remains stable, and after a sharp rally, prices did not decline along with OI, indicating that the main capital is still in the market and not just sh
$FORM The 1H timeframe has experienced a sharp rise and is now consolidating strongly at high levels, with prices closely following the short-term moving averages, indicating a healthy pullback and recharging structure. The 4H timeframe has confirmed a breakout of the previous consolidation platform, and the trend has shifted to bullish. Open interest remains stable, and after a sharp rally, prices did not decline along with OI, indicating that the main capital is still in the market and not just sh
- Reward
- 2
- 2
- Repost
- Share
Yusfirah:
2026 GOGOGO 👊View More
#Gate广场发帖领五万美金红包
2 Days Left! Gate Square’s $50,000 Red Packet Rain is ongoing 🧧
Post to win — 100% win rate, with increased reward caps!
New and existing users can earn up to 28U per post
Higher daily limits — the more you post, the more you earn
How to join:
1️⃣ Update the app to v8.8.0
2️⃣ Post and rewards are credited automatically
Post now 👉 https://www.gate.com/post
Details 👉 https://www.gate.com/announcements/article/49773

- Reward
- 1
- 1
- Repost
- Share
CryptoChampion:
To The Moon 🌕#深度创作营
Ethereum at Current Price Range Between $1,950 and $2,020
At the time of writing, Ethereum is trading in the narrow range between $1,950 and $2,020, a level that reflects significant indecision in the market. This area has become a reference point for both buyers and sellers, and every dip or bounce is being scrutinized through the lens of technical structure, sentiment, and macro forces. The question that many traders are asking right now “Should I buy the dip or wait?” cannot be answered by sentiment alone. Instead, it requires a structured, multi‑layered view that examines current p

- Reward
- 1
- 1
- Repost
- Share
CryptoChampion:
To The Moon 🌕#元宵赏月领红包 🏮 Lantern Festival Celebration · Win Great Prizes! Gate Plaza Riddle Guessing Event Kicks Off in a Festive Atmosphere!
Lanterns are dazzling, tangyuan (sweet rice balls) are fragrant, and the bright moon is high—Gate celebrates the Lantern Festival with you!
🎁 Draw 5 lucky users to win 28U!
✍️ How to participate:
1️⃣ Follow @GatePlaza_Official
2️⃣ Like + Share this post
3️⃣ Comment with any correct answer to the riddle in the comment section
May everyone's holdings be as full as the moon, steady and complete. Happy Lantern Festival, and may your wealth shine brightly!


- Reward
- 4
- 5
- Repost
- Share
CryptoChampion:
To The Moon 🌕View More
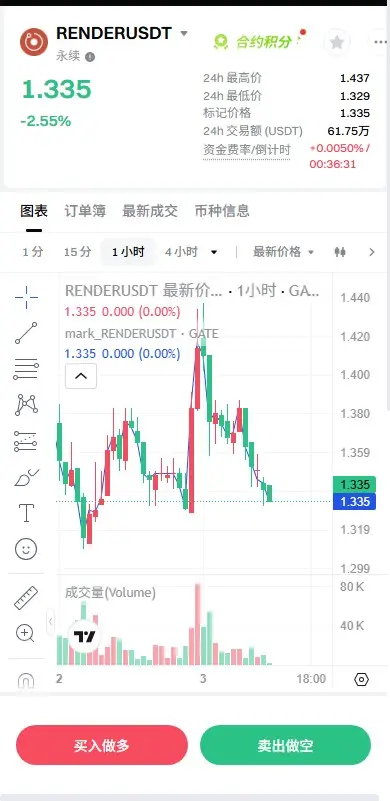
【$RENDER Signal】Pullback to Long + 1H RSI Divergence, Main Force Protecting the Market
$RENDER The 1H timeframe is oscillating around a critical support zone (1.33-1.34). RSI shows a bullish divergence signal, with the price declining but open interest remaining stable, indicating that the selling pressure is more likely due to long traders stopping out rather than main force unloading. Although the 4H timeframe has not yet broken out of the oscillation, the area around 1.33 has been tested multiple times recently as a support level. Coupled with the negative funding rate, there is a short-ter
$RENDER The 1H timeframe is oscillating around a critical support zone (1.33-1.34). RSI shows a bullish divergence signal, with the price declining but open interest remaining stable, indicating that the selling pressure is more likely due to long traders stopping out rather than main force unloading. Although the 4H timeframe has not yet broken out of the oscillation, the area around 1.33 has been tested multiple times recently as a support level. Coupled with the negative funding rate, there is a short-ter
- Reward
- 6
- 4
- 1
- Share
CryptoChampion:
To The Moon 🌕View More
🏮 Lantern Festival Celebration · Win Amazing Rewards with Gate Plaza! 🌕✨
The lanterns glow brightly, sweet rice dumplings fill the air with fragrance, and the full moon lights up the night — Gate.io is celebrating the Lantern Festival with YOU! 🎉
Join the exciting Gate Plaza Riddle Guessing Party and stand a chance to win fantastic prizes!
🎁 28 USDT for 5 Lucky Winners!
✨ How to Participate:
1️⃣ Follow @GatePlaza_Official
2️⃣ Like & Share this post
3️⃣ Comment with any correct answer to the festival riddle
It’s that simple! Test your wisdom, celebrate the tradition, and win rewards! 🏆
🌕

- Reward
- 5
- 3
- 1
- Share
Sakura_3434:
2026 GOGOGO 👊View More
🔥 Gate Live Trading Copy Trading Growth Plan Officially Launched! 🚀
Start your copy trading journey today and unlock amazing rewards on Gate.io!
✨ Exclusive for First-Time Copy Trading Users
Enjoy Triple Benefits designed to boost your trading growth:
🎁 Newcomer Gift
Complete your first contract copy trade and share a massive 23,000 USDT prize pool 💰
🎁 Daily Check-in Gift
Check in daily for copy trading and share 30,000 USDT prize pool 🎉
🎁 Experience Gift
Follow 3 different signal providers and receive 100 USDT instantly ⚡
⏰ Event Duration:
March 2, 2026 (16:00) – March 31, 2026 (16:00)


- Reward
- 4
- 7
- 1
- Share
CryptoChampion:
To The Moon 🌕View More
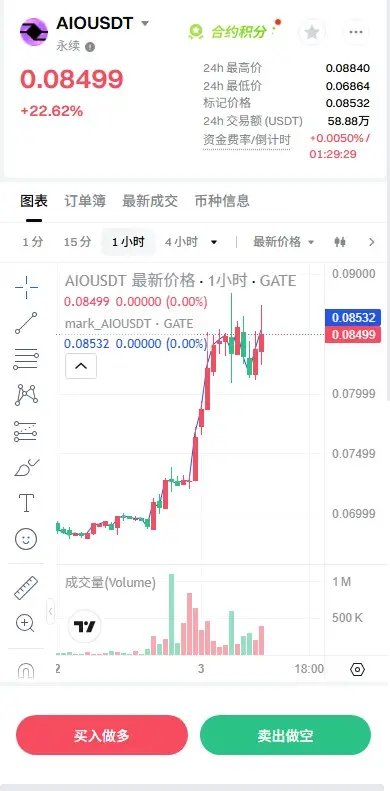
【$AIO Signal】Pullback to Long + 1H Strong Consolidation, Main Force Clearly Protecting the Market
$AIO On the 1H timeframe, after a sharp surge yesterday, the price is currently consolidating strongly at a high level. The price is building a support zone between 0.0812-0.088, with the 1H EMA20 (0.0797) providing dynamic support. The 4H timeframe has broken through the long-term EMA50 resistance, indicating a bullish trend. The key point is: the price is consolidating at a high level, but open interest remains stable with no significant outflow, suggesting that the main force has not exited the
$AIO On the 1H timeframe, after a sharp surge yesterday, the price is currently consolidating strongly at a high level. The price is building a support zone between 0.0812-0.088, with the 1H EMA20 (0.0797) providing dynamic support. The 4H timeframe has broken through the long-term EMA50 resistance, indicating a bullish trend. The key point is: the price is consolidating at a high level, but open interest remains stable with no significant outflow, suggesting that the main force has not exited the

- Reward
- 7
- 8
- Repost
- Share
CryptoChampion:
To The Moon 🌕View More
#DeepCreationCamp
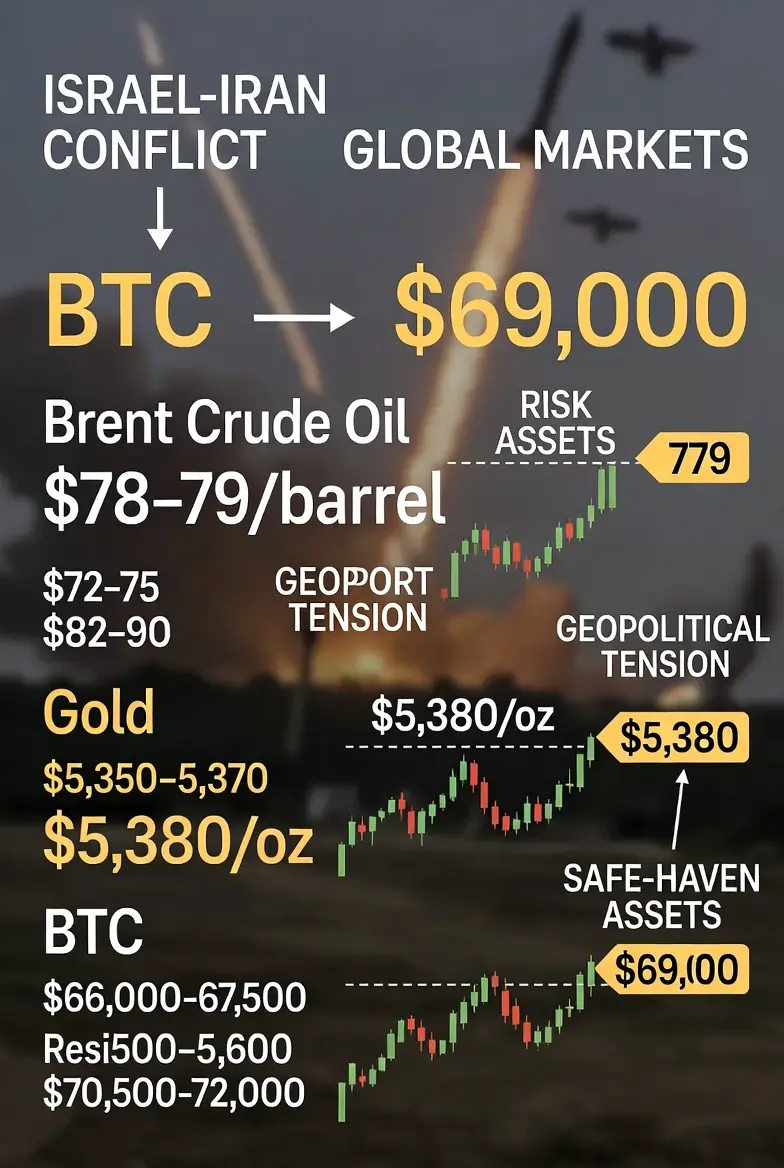
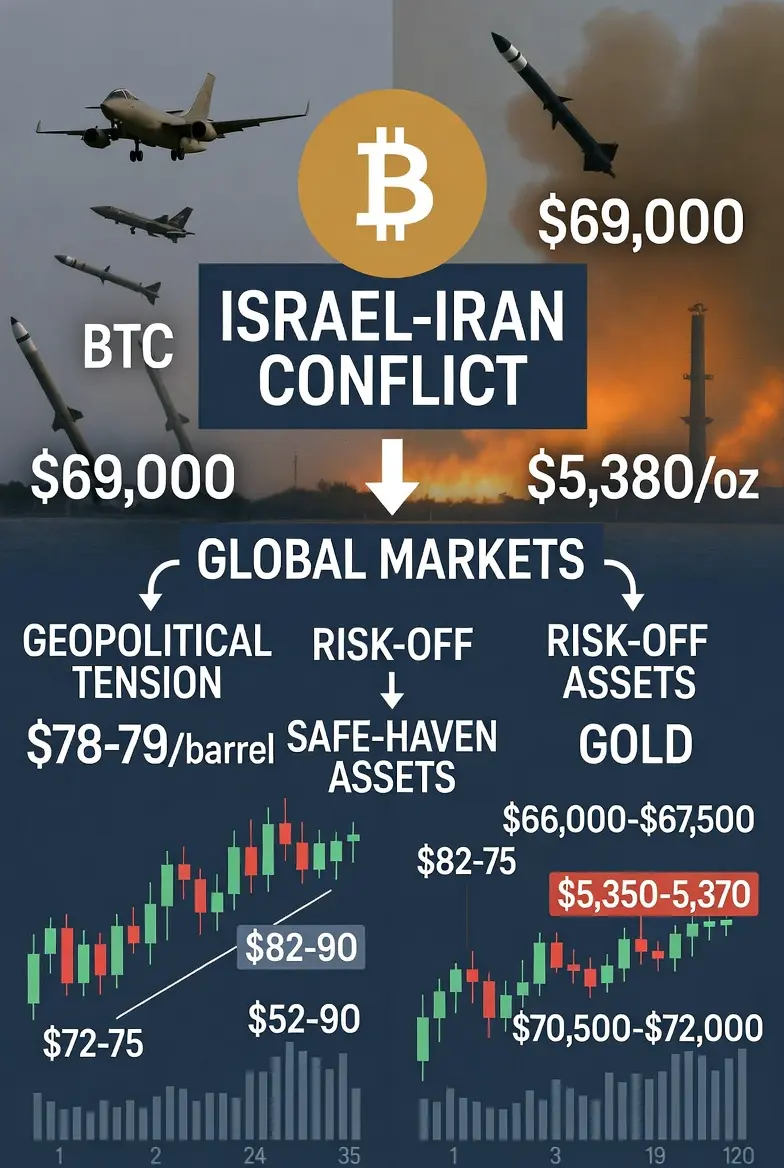
🚨 #DeepCreationCamp | BTC, Crude Oil & Gold – (BTC $69,000)
Friends, traders, and analysts, the Israel-Iran conflict continues to shape global markets dramatically. With BTC now at $69,000, Brent crude at ~$78–79/barrel, and Gold around $5,380/oz, the interplay between geopolitical risk, safe-havens, and risk assets is clearer than ever. Let’s dive fully, answering all the community questions, and exploring every angle.
🌍 Geopolitical Catalyst
The Middle East has shifted from tension to active conflict. US-Israel airstrikes targeted Tehran, nuclear and missile sites, and
BTC-0,39%
- Reward
- 5
- 7
- Repost
- Share
CryptoChampion:
To The Moon 🌕View More
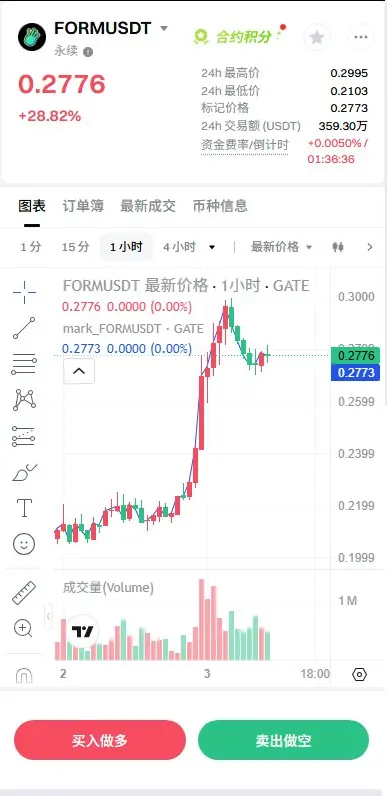
【$FORM Signal】Pullback to add longs + 1H pullback confirmation, main force clearly intends to defend the market
$FORM The 1H timeframe experienced a violent surge of 27% yesterday and is currently in a healthy flag pattern consolidation. The price oscillates between 0.274-0.280, with the 1H EMA20 (0.2617) providing strong dynamic support, and the 4H EMA20 (0.2288) has formed a bullish alignment. The current 1H RSI (68.45) has retreated from overbought territory, preparing for another upward push.
🎯Direction: Long (Long)
⚡Entry/Order: 0.2565 - 0.2622
🛑Stop Loss: 0.2450
🚀Target 1: 0.2950
🚀Ta
BTC-0,39%


- Reward
- 5
- 8
- Repost
- Share
CryptoChampion:
To The Moon 🌕View More
【$FORM Signal】Pullback to add longs + 1H pullback confirmation, main force clearly intends to defend the market
$FORM The 1H timeframe experienced a violent surge of 27% yesterday and is currently in a healthy flag pattern consolidation. The price oscillates between 0.274-0.280, with the 1H EMA20 (0.2617) providing strong dynamic support, and the 4H EMA20 (0.2288) has formed a bullish alignment. The current 1H RSI (68.45) has retreated from overbought territory, preparing for another upward push.
🎯Direction: Long (Long)
⚡Entry/Order: 0.2565 - 0.2622
🛑Stop Loss: 0.2450
🚀Target 1: 0.2950
🚀Ta
$FORM The 1H timeframe experienced a violent surge of 27% yesterday and is currently in a healthy flag pattern consolidation. The price oscillates between 0.274-0.280, with the 1H EMA20 (0.2617) providing strong dynamic support, and the 4H EMA20 (0.2288) has formed a bullish alignment. The current 1H RSI (68.45) has retreated from overbought territory, preparing for another upward push.
🎯Direction: Long (Long)
⚡Entry/Order: 0.2565 - 0.2622
🛑Stop Loss: 0.2450
🚀Target 1: 0.2950
🚀Ta
BTC-0,39%

- Reward
- 6
- 11
- Repost
- Share
CryptoChampion:
To The Moon 🌕View More