Trade
Basic
Futures
Futures
Hundreds of contracts settled in USDT or BTC
Options
HOT
Trade European-style vanilla options
Unified Account
Maximize your capital efficiency
Demo Trading
Futures Kickoff
Get prepared for your futures trading
Futures Events
Participate in events to win generous rewards
Demo Trading
Use virtual funds to experience risk-free trading
Earn
Launch
CandyDrop
Collect candies to earn airdrops
Launchpool
Quick staking, earn potential new tokens
HODLer Airdrop
Hold GT and get massive airdrops for free
Launchpad
Be early to the next big token project
Alpha Points
NEW
Trade on-chain assets and enjoy airdrop rewards!
Futures Points
NEW
Earn futures points and claim airdrop rewards
Investment
Simple Earn
Earn interests with idle tokens
Auto-Invest
Auto-invest on a regular basis
Dual Investment
Buy low and sell high to take profits from price fluctuations
Soft Staking
Earn rewards with flexible staking
Crypto Loan
0 Fees
Pledge one crypto to borrow another
Lending Center
One-stop lending hub
VIP Wealth Hub
Customized wealth management empowers your assets growth
Private Wealth Management
Customized asset management to grow your digital assets
Quant Fund
Top asset management team helps you profit without hassle
Staking
Stake cryptos to earn in PoS products
Smart Leverage
NEW
No forced liquidation before maturity, worry-free leveraged gains
GUSD Minting
Use USDT/USDC to mint GUSD for treasury-level yields
More
Brain777
No content yet
Brain777
Shiba Inu Price Shows Death Cross Pattern
Shiba Inu has formed another death cross on its hourly chart as selling pressure mounts across the meme coin sector. The 50-period moving average has crossed below the 200-period moving average, signaling potential weakness in the short-term trend.
The development marks a sharp reversal from the optimistic sentiment that characterized early January. SHIB currently trades at $0.00000853, up 2.64% over the past 24 hours despite a bearish technical signal.Early 2026 Rally Proves Unsustainable
Shiba Inu began the year with significant momentum. The token s
SHIB-4,89%
- Reward
- 2
- Comment
- Repost
- Share
🇲🇦🔥 An explosive match awaits the Atlas Lions! 🔥🇲🇦
The Moroccan national team will face a strong and decisive match today, Sunday, against the Senegal national team, as part of the Africa Cup of Nations 2025 🏆.
A match full of challenge and excitement, as the Lions aim to confirm their strength and continue their journey with confidence and determination 💪⚽
📢 All eyes are on this highly anticipated encounter…
Good luck to the Atlas Lions! 🇲🇦❤️
#Atlas_Lions
View OriginalThe Moroccan national team will face a strong and decisive match today, Sunday, against the Senegal national team, as part of the Africa Cup of Nations 2025 🏆.
A match full of challenge and excitement, as the Lions aim to confirm their strength and continue their journey with confidence and determination 💪⚽
📢 All eyes are on this highly anticipated encounter…
Good luck to the Atlas Lions! 🇲🇦❤️
#Atlas_Lions

- Reward
- 1
- Comment
- Repost
- Share
Why Ethereum Could Be Ready to Outperform Bitcoin in 2026
Ethereum may be poised to end years of lagging performance and finally outrun Bitcoin in 2026, driven by a regulatory overhaul and a confluence of key on-chain and market metrics.
Ethereum’s bull run since 2023 has yielded 160%, less than half of Bitcoin’s staggering 457% return, according to CoinGecko data. The difference in gains highlights Ethereum’s muted performance over the years despite improving market conditions.
But several catalysts suggest that the outlook could change.
Catalysts for Ethereum
The first signal is a clear mark

- Reward
- 6
- 2
- Repost
- Share
LittleQueen :
:
2026 GOGOGO 👊View More
Monero (XMR) has experienced significant growth
in recent months, reaching a new all-time high of
$797.73 on January 14, 2025. According to CoinGecko
data, XMR's price has increased by 47.4% in the last
week, 60% in the 14 days, 56.6% in the last month,
and 221.4% since January 2025. However, the upward
trend is showing signs of slowing. XMR's price has
fallen by 4.8% in the last 24 hours and over 16% from
its recent peak. Despite this correction, a $1000
investment in Monero could have yielded over $3
million. Let's explore how. Source: CoinGecko Monero
(XMR) was at its lowest price of $0.216
ZEC-4,59%
- Reward
- 1
- Comment
- Repost
- Share
Bitcoin Price Forecast for Jan 15: Support Holds Firm as BTC Sees $655.36M in Futures Inflows
Bitcoin continues its bullish momentum with strong futures inflows, as support holds firm and traders eye further upside potential.
Notably, Bitcoin (BTC) extended its recent recovery on Thursday, climbing 1.9% over the past 24 hours, and is now trading at $96,517. The price fluctuated between $94,620 and $97,704 but is now trading near the mid-range.
Bitcoin’s surge aligns with broader market sentiment, which has been influenced by developments like the proposed U.S. bill aiming to create a regulator
BTC-2,49%

- Reward
- 1
- Comment
- Repost
- Share
Cardano privacy token Midnight (NIGHT) has seen its
momentum stall after a major surge shortly after its
launch in December. Advertisement Privacy-linked
tokens gained the spotlight late last year, with
investors rotating into the segment even as attention
centered on Zcash. Midnight also rallied as investors
rotated back into privacy-focused assets.A massive
surge in December had seen Midnight token rise to
highs of $0.119 on Dec. 21. The price surge also
coincided with an explosion in volume, which at one
point surpassed $8 billion. HOT Stories BREAKING:
Strategy Announces Biggest Bitcoin Pu
- Reward
- 1
- Comment
- Repost
- Share
Bitcoin and Ethereum ETFs have cooled off fast this year. As hopes for early Fed rate cuts fade, a lot of money is heading for the exit.
Most of the inflows seen since January are already gone. Bitcoin ETFs took the biggest hit last week, with hundreds of millions flowing out, and Ethereum products are also feeling the pressure.
What’s interesting is where the money is going instead. Some altcoins are quietly attracting fresh inflows. $XRP , Solana, and Sui funds all saw new interest, even while $BTC and ETH pulled back.
In short, big names are taking a breather, but investors aren’t leaving c

- Reward
- 1
- Comment
- Repost
- Share
Shiba Inu Burn Rate Surges 38,000%: In-Depth Analysis of Its Impact on the SHIB Market Trend
In the latest developments in the Shiba Inu (SHIB) ecosystem, the token's burn metric experienced an unusual surge, recording a 38,043% increase in just 24 hours. This aggressive reduction in circulating supply marks a pivotal moment for this community-driven asset and foreshadows a potential shift in market sentiment as the project enters a new phase of its 2026 roadmap.
Exponential Growth in Burn Metric
According to the latest data from on-chain monitoring platform Shibburn, over 7.2 million SHIB tok
SHIB-4,89%
- Reward
- 1
- Comment
- Repost
- Share
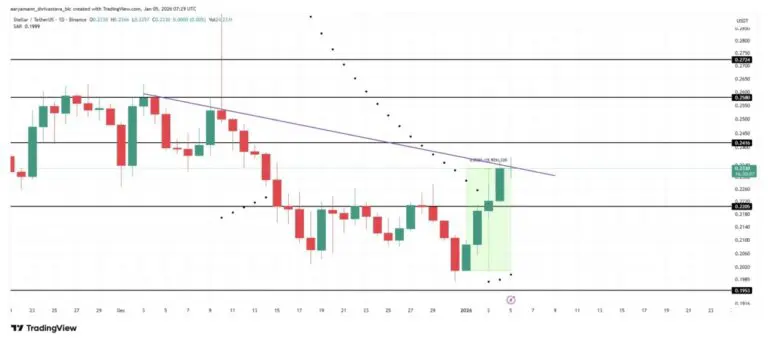
Stellar (XLM)
On January 5, 2026, XLM
was trading at around
$0.233, registering a gain of almost 16% in the last
seven days. Read also: Altcoin Market Holds Key
Support -- Ready for the Next Big Rally? Despite the
recovery, Stellar's XLM0.62%-> price movement
is still held back by the downtrend line that has
capped the movement for over a month, so there
is no confirmation of a sustained trend reversal. To
break out of this downtrend, XLM needs to break the
resistance level at $0.241. The Parabolic SAR indicator
is below the current price, indicating an ongoing
uptrend. HTX Year-End Carnival:
XLM-3,86%
- Reward
- 1
- Comment
- Repost
- Share
ETH CONSOLIDATES NEAR $3,100 AS LABOR DATA AND KEY RESISTANCE SHAPE MARKET DIRECTION
Ethereum $ETH continues to trade near the $3,120 level after facing rejection earlier this week, reflecting a broader pause across the cryptocurrency market. Most major digital assets are holding above critical support zones, suggesting that selling pressure has cooled for now. Bitcoin has stabilized after briefly dipping to the $90,000 level, while XRP is attempting to recover near $2.07, helping to keep overall market sentiment relatively balanced.
Despite short-term volatility, $ETH maintains a technically
- Reward
- 1
- Comment
- Repost
- Share
Tether Introduces Scudo, a New Fractional Unit for Tether Gold (XAUT)
Tether has launched a new unit of account for Tether Gold, designed to simplify the pricing and use of gold on the blockchain in everyday transactions.
Tether announced this update on January 6 in an official statement, describing the launch of Scudo, a fractional unit designed specifically for Tether Gold.
xaut-0.23%Tether Gold.
XAUT1,45%
- Reward
- 1
- Comment
- Repost
- Share
FLOKI Strengthens Sharply, Will this Trend Continue in January 2026?
After several months of decline, FLOKI (FLOKI) is finally showing signs of recovery. Despite the cryptocurrency’s annualized decline of 72%, FLOKI has managed to rise 18% in the past day. This rise may signal a return of investor interest in the meme currency. However, questions remain regarding the sustainability of this interest in the market
After several months of decline, FLOKI (FLOKI) is finally showing signs of recovery. Despite the cryptocurrency’s annualized decline of 72%, FLOKI has managed to rise 18% in the past day. This rise may signal a return of investor interest in the meme currency. However, questions remain regarding the sustainability of this interest in the market
FLOKI-9,12%
- Reward
- 3
- Comment
- Repost
- Share
Shiba Inu Price Jumps 13%, Technical Analysis Points to 246% Upside Potential
Bullish Divergence and Wedge Breakout Signal Potential Move to $0.000032 Target
Shiba Inu price surged 13% on Sunday amid the continued rally in the 2026 meme coin market.
A technical breakout of the descending wedge confirms bullish divergence with a target price of $0.000032.
The top 10 holders control 63% of the supply, with the largest holder owning 41%, worth approximately $3.3 billion.
Derivatives data shows $1.11 million in long positions versus $705,000 in short positions at key levels of $0.0000078-$0.000008
SHIB-4,89%
- Reward
- 1
- 1
- Repost
- Share
W若曦:
2026 Go Go Go 👊Bitcoin Price Analysis: What Are BTC’s Next Targets After Reclaiming $90K
Bitcoin has recently pushed higher after an extended corrective phase, but the broader structure still reflects hesitation rather than a clear trend transition. While the price has shown signs of recovery, momentum remains muted, keeping the market in a fragile equilibrium.
Bitcoin Price Analysis: The Daily Chart
On the daily timeframe, BTC has registered a bullish breakout above the descending channel that previously defined the corrective structure. This breakout is technically constructive, as it signals a shift away
BTC-2,49%
- Reward
- 1
- Comment
- Repost
- Share
Dogecoin and PEPE soar 25% amid memecoin rally in early 2026.
Dogecoin and PEPE led the sharp rise in memecoins on Friday, as traders eagerly discussed the "meme season" ahead of 2026.
Dogecoin is up about 11% in 24 hours, while PEPE is up about 17% after a stronger intraday rally.
The cryptocurrency meme basket is also gaining momentum overall. CoinGecko's GMCI Meme Index showed a market capitalization of about $33.8 billion with a 24-hour trading volume of about $5.9 billion, suggesting that the rally isn't just a single token.
Meanwhile, the dog-themed meme basket is seeing gains across the
- Reward
- 1
- Comment
- Repost
- Share
Cardano (ADA) Rebounds with 8% Surge as Whale Accumulation Signals Renewed Market Confidence
Cardano (ADA) has inaugurated the 2026 trading year with a decisive bullish turn, posting an 8% price increase in a single day. Moving past the $0.36 threshold, ADA has emerged as one of the market's top-performing altcoins, effectively stalling the bearish momentum that saw the asset decline by nearly 20% throughout December. This recovery is underpinned by a significant uptick in institutional-grade activity and strengthening network fundamentals.
Whale Activity and On-Chain Momentum
Data sourced fro
ADA-6,59%
- Reward
- 1
- Comment
- Repost
- Share
Shiba Inu Price Technicals Signal a Potential Rebound
Technical analysis suggests that Shiba Inu price may be on the verge of a strong rebound in the near term. A closer look shows that the token has slowly formed a falling wedge pattern on the three-day chart.
This pattern, which is shown in purple, is characterized by the falling and converging trendlines. A rebound normally happens whenever these lines are nearing their confluence.
Meanwhile, the Relative Strength Index (RSI) has moved to the oversold level of 30 for the first time since March last year. The last time it dropped to this le
SHIB-4,89%
- Reward
- 3
- Comment
- Repost
- Share